Updated Five-Unit Multifamily
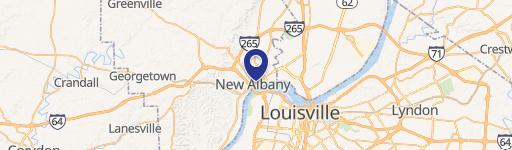
1110 Chartres St New Albany, IN 47150
1110 Chartres St, New Albany, IN, 47150
Contact for pricing
For Sale
Contact for pricing
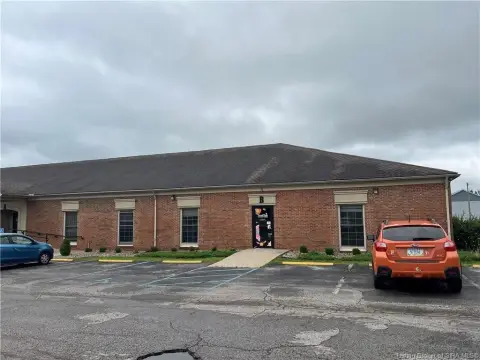
Two-story five-unit property with three currently occupied and recent updates including paint, flooring, and appliances.
Property Size2,280 SF
Price / SF$142.54
Days on Market103
Property Features for 1110 Chartres St
General Information
- Standard status
- Active
- Size
- 2,280 SF
- Property subtype
- Multifamily
Building Details
- Year Built
- 1929
Listing agency
KW Commercial Southern Indiana
Listed by
Brian Haeseley · License #KY b3113
Source
Crexi
Added: Apr 11 Updated: Jul 22 at 8:22AM Checked: Jul 22 at 8:22AM
Displayed information is deemed reliable but is not guaranteed and should be independently verified. All listing content including descriptions, pricing, images are the copyrighted material of KW Commercial Southern Indiana
Investment Insights
Based on property information with market context.
This two-story five-unit multifamily property is positioned as an income-producing house with current occupancy in three units. One additional unit is described as rent-ready, and another is being prepped for rent. Updates completed this year include fresh paint, flooring, appliance replacements, and water/sewer line upgrades. The property is being sold AS-IS.
The seller reports gross rent approaching $5,000 per month. The listing encourages scheduled showings for investors seeking a turnkey unit mix with ongoing rent-up underway.
Income approach aside, the practical configuration is straightforward: five separate units within a single house structure, with occupancy spanning three units plus two units transitioning to rent readiness.
The seller reports gross rent approaching $5,000 per month. The listing encourages scheduled showings for investors seeking a turnkey unit mix with ongoing rent-up underway.
Income approach aside, the practical configuration is straightforward: five separate units within a single house structure, with occupancy spanning three units plus two units transitioning to rent readiness.
Key Highlights
- Five‑unit, two‑story income property built in 1929 in New Albany
- Income close to $5,000 gross rent per month, with three units currently occupied
- One additional unit is ready for rent, and one unit is being prepped for rent
Local Financial Insights For Apartment 5plus
Simulate Cap Rate and NOI
NOI Build-Up
- Vacancy
- income lost from leasable area expected to sit empty during the year — subtracted from gross rent.
- EGI (Effective Gross Income)
- gross rent minus vacancy losses — the realistic income before paying operating costs.
- OpEx (Operating Expenses)
- recurring costs to operate the property (property tax, insurance, utilities, maintenance, management) — excludes financing and capital improvements.
- NOI (Net Operating Income)
- income a property generates after operating costs but before financing and taxes.
| Component | $ | $/SF |
|---|---|---|
| Gross rent | $31.5k | $13.80 |
| − Vacancy | −$2.1k | −$0.92 |
| EGI | $29.4k | $12.88 |
| − OpEx | −$13.2k | −$5.79 |
| NOI | $16.1k | $7.08 |
2,280 SF · lease $13.80/SF/yr · vacancy 6.70% · expense 45.00%
Alternative Uses
Best Use
Apartment 5plus
$230.7K
$201.8K – $269.1K
NOI $16,146 @ 7.0% cap · market cap 4.97%
Second Best
—
—
no second resolved use
Theoretical Best
Specialty Retail
$1.65M
$1.44M – $1.92M
NOI $115,360 @ 7.0% cap · market cap 35.50%
Zoning and permitted uses should be independently verified with local authorities.
Property Analytics
Location Intelligence
Current Use by Public Records
Apartment buildings
Similar For Sale Nearby


FAQs
What type of property is this?
Apartment building - Two-story five-unit property with three currently occupied and recent updates including paint, flooring, and appliances.
Where is this apartment building located?
The property is located at 1110 Chartres St New Albany, IN.
What is the asking price?
The asking price for this property is $325,000.
What are key features of this property?
This property features: Five‑unit, two‑story income property built in 1929 in New Albany; Income close to $5,000 gross rent per month, with three units currently occupied; One additional unit is ready for rent, and one unit is being prepped for rent