Three-Family Home with Private
For Sale
Contact for pricing
109 Pulaski Street, Brooklyn, NY 11206
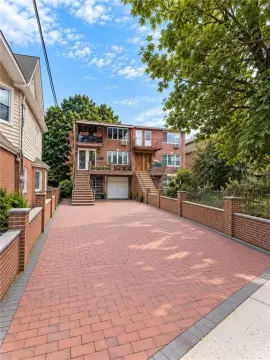
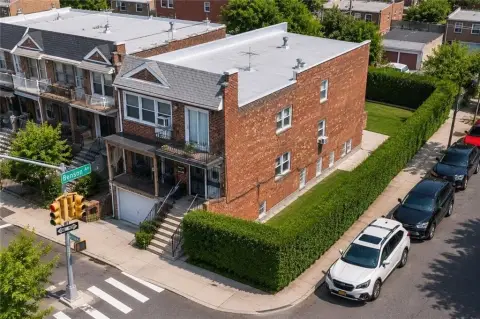
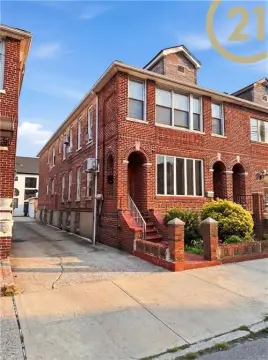
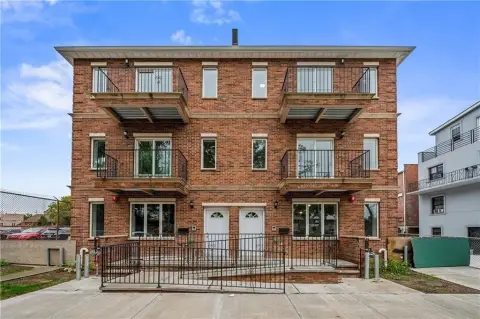
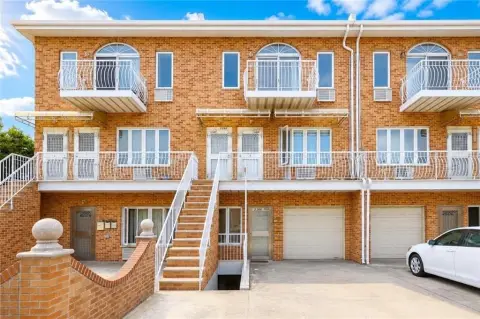
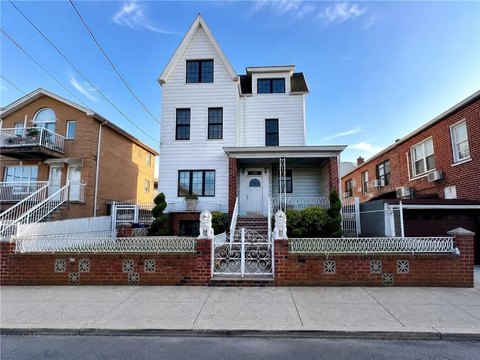
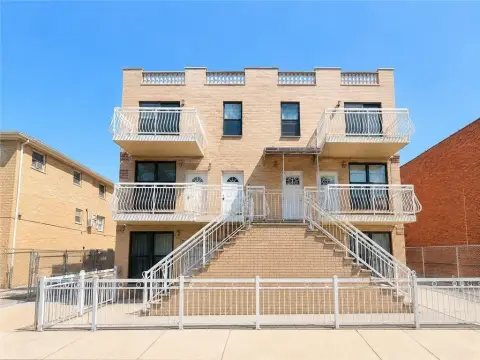
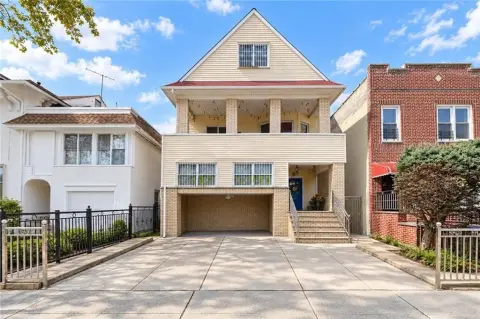
Three-unit residence delivered vacant, with updated kitchens, separate utilities, and rear private parking for daily convenience.
Property Size3,811 SF
Price / SF$734.72
Days on Market131
Property Features for 109 Pulaski Street
General Information
Standard status
Active
Size
3,811 SF
Property subtype
Multifamily
Zoning
R6B
Investment Type
Value Add
Additional Details
Multifamily Units
3
Building Details
Year Built
2005
Year Renovated
2018
Units
1
Tenancy
Multi
Listing Agency:
Compass New York
Listed By:
Jonathan Cabrera · License #10401294594
(347) 623-4661
Source:
Crexi
Added: May 29
Changed: Sep 21
Last Checked: Oct 5 at 3:26PM
Displayed information is deemed reliable but is not guaranteed and should be independently verified. All listing content including descriptions, pricing, images are the copyrighted material of Compass New York
Investment Insights
Based on property information with market context.
109 Pulaski Street is a three-family home with approximately 2,800 square feet of living space, offered completely vacant and ready for new ownership. The garden unit features a 2-bed, 1-bath layout with a sloped, fully accessible entrance leading to a private, granite-paved front patio. The parlor triplex offers 3 beds and 2 baths across multiple levels, connecting down through the basement to a fully enclosed backyard area finished with granite hardscaping. A top-floor studio adds a flexible, self-contained living option.
The property is set on a tree-lined street in Brooklyn’s Bedford-Stuyvesant area, with convenient access to local dining, boutique shopping, and transit connections for getting around the city. There is a highly coveted private parking space at the rear of the property.
Each unit includes an updated modern kitchen and is separately metered with gas and electric services, supporting straightforward management for owners and future tenants. With the home delivered vacant, buyers have the opportunity to occupy as a primary residence with additional rental income potential, or to reposition the building for an income-focused ownership strategy—depending on how they plan to use the three distinct spaces.
The property is set on a tree-lined street in Brooklyn’s Bedford-Stuyvesant area, with convenient access to local dining, boutique shopping, and transit connections for getting around the city. There is a highly coveted private parking space at the rear of the property.
Each unit includes an updated modern kitchen and is separately metered with gas and electric services, supporting straightforward management for owners and future tenants. With the home delivered vacant, buyers have the opportunity to occupy as a primary residence with additional rental income potential, or to reposition the building for an income-focused ownership strategy—depending on how they plan to use the three distinct spaces.
Key Highlights
- Three‑unit home built in 2005 with approximately 2,800 SF of living space
- Delivered completely vacant and ready for an owner‑occupant or investment buyer
- Updated modern kitchens in every unit
Financial Insights
Estimated NOI and Cap Rate
NOI / Yr
$133,468
Cap Rate
4.77%
Suggested Prices Based on Cap Rates
Cap Rate 5%
$2,669,360
$2.7M
Cap Rate 7%
$1,906,686
$1.9M
Cap Rate 9%
$1,482,978
$1.5M
Market Conditions
NOI Build-Up for 3,811 SF
Gross rent
$194.4K $51.00/SF
− Vacancy
−$3.7K −$0.97/SF
EGI
$190.7K $50.03/SF
− OpEx
−$57.2K −$15.01/SF
NOI
$133.5K $35.02/SF
Area
Brooklyn, NY
Vacancy
1.90%
Lease Rate
$51.00 /SF/Yr
Expense Ratio
30.00%
Simulate Cap Rate and NOI
Suggested Prices Based on Cap Rates
Cap Rate 5%
$2,669,360
Cap Rate 7%
$1,906,686
Cap Rate 9%
$1,482,978
Alternative Uses
Best Use
Multifamily LT 5
$1.91M
$1.67M – $2.22M
NOI $133,468 @ 7.0% cap · market cap 4.77%
Second Best
Apartment 5plus
$1.66M
$1.45M – $1.94M
NOI $116,346 @ 7.0% cap · market cap 4.16%
Theoretical Best
Specialty Retail
$3.16M
$2.76M – $3.68M
NOI $220,886 @ 7.0% cap · market cap 7.89%
Zoning and permitted uses should be independently verified with authorities.
Property Analytics
Unlock full access to Insights
Subscribe to Realmo Intelligence
Open Analytics
Current Use
Lease Details
3
Residential units
Multi-tenant
Tenancy
Location Intelligence
Trade Area within ½ mile
5,663
Businesses Nearby
Explore this area
Business Placement
Demographics for 11206, NY
91,549
Population
34,838
Households
2.6
Avg Household Size
30
Median Age
36%
College-Educated
77%
High-School Grad
1.4 sq mi
ZIP Area
65,392
Density / Sq Mi
$57,280
Median Household Income
$44,145
Median Earnings
$1,558
Median Rent
$822,100
Median Home Value
Check the figures for this property
Cap Rate, Value Estimation, Potential NOI and more
View Realmo Analytics
Market
Vacancy Rate% for Multifamily in Northeast region

Questions? Ask Rey
Realmo’s AI knows this listing — price, zoning, demand, history. Ask anything.


Frequently Asked Questions
What type of property is this?
Triplex - Three-unit residence delivered vacant, with updated kitchens, separate utilities, and rear private parking for daily convenience.
Where is this triplex located?
The property is located at 109 Pulaski Street Brooklyn, NY.
What is the asking price?
The asking price for this property is $2,800,000.
What are key features of this property?
This property features: Three‑unit home built in 2005 with approximately 2,800 SF of living space; Delivered completely vacant and ready for an owner‑occupant or investment buyer; Updated modern kitchens in every unit