Remodeled Mixed-Use
For Sale
Contact for pricing
Pending
107 S Main St, Nixa, MO 65714
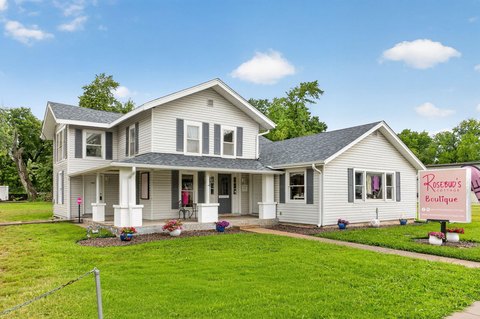
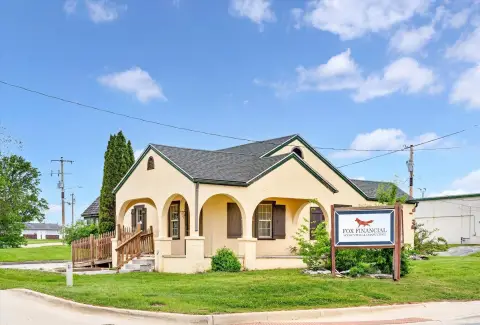
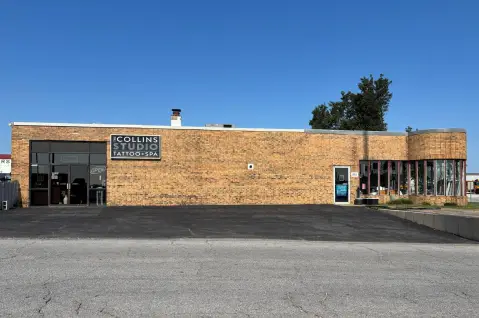
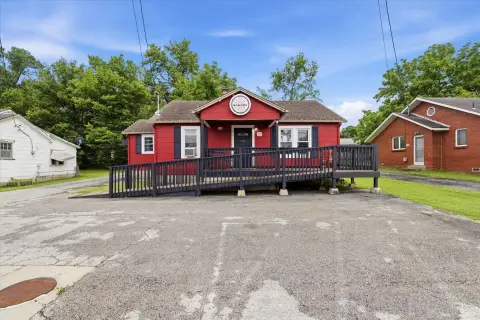
Remodeled mixed-use downtown building with existing tenants, offering flexible space for retail and office concepts.
Property Size7,528 SF
Days on Market145
Property Features for 107 S Main St
General Information
Standard status
Pending
Size
7,528 SF
Property subtype
Retail, Office, Mixed Use
Additional Details
Business Included
Yes
Building Details
Year Built
1909
Tenancy
Multi
Listing Agency:
Massengale Group - Keller Williams - Nixa
Listed By:
Jason Massengale · License #MO 2015008583
(417) 883-4900
Source:
Crexi
Added: May 29
Changed: Oct 3
Last Checked: Oct 19 at 7:00AM
Displayed information is deemed reliable but is not guaranteed and should be independently verified. All listing content including descriptions, pricing, images are the copyrighted material of Massengale Group - Keller Williams - Nixa

Ask AI about this property
Review the available facts, identify missing information and prepare questions for the agent.
Investment Insights
Based on property information with market context.
This remodeled mixed-use property is suited for multiple operating models, with configurations that support retail and office use. The building has been updated and is presented as move-in ready, with established tenants already in place.
Situated in downtown Nixa at 107 S Main St, the property benefits from prominent street exposure. Its central, walkable setting supports businesses that want to be seen and accessed easily by local customers and visitors.
For buyers, the combination of remodeled improvements and existing tenancy can help simplify near-term operations while keeping options open for future retail or office upgrades. For owner-operators, the live-work and storefront/office versatility supports concepts that require a visible presence and adaptable interior use. The property is being offered for sale at a single building level, with the intent that it can serve as an operating asset from day one.
Situated in downtown Nixa at 107 S Main St, the property benefits from prominent street exposure. Its central, walkable setting supports businesses that want to be seen and accessed easily by local customers and visitors.
For buyers, the combination of remodeled improvements and existing tenancy can help simplify near-term operations while keeping options open for future retail or office upgrades. For owner-operators, the live-work and storefront/office versatility supports concepts that require a visible presence and adaptable interior use. The property is being offered for sale at a single building level, with the intent that it can serve as an operating asset from day one.
Key Highlights
- 1909‑built mixed‑use building in downtown Nixa
- Remodeled mixed‑use property with existing tenants already in place
- Flexible space suited for retail and office concepts
Financial Insights
Estimated NOI and Cap Rate
NOI / Yr
$59,652
Cap Rate
7.32%
Suggested Prices Based on Cap Rates
Cap Rate 5%
$1,193,040
$1.2M
Cap Rate 7%
$852,171
$852.2K
Cap Rate 9%
$662,800
$662.8K
Market Conditions
NOI Build-Up for 7,528 SF
Gross rent
$83.1K $11.04/SF
− Vacancy
−$3.6K −$0.47/SF
EGI
$79.5K $10.57/SF
− OpEx
−$19.9K −$2.64/SF
NOI
$59.7K $7.92/SF
Area
Christian County, MO
Vacancy
4.30%
Lease Rate
$11.04 /SF/Yr
Expense Ratio
25.00%
Simulate Cap Rate and NOI
Suggested Prices Based on Cap Rates
Cap Rate 5%
$1,193,040
Cap Rate 7%
$852,171
Cap Rate 9%
$662,800
Alternative Uses
Best Use
Office B
$852.2K
$745.7K – $994.2K
NOI $59,652 @ 7.0% cap · market cap 7.32%
Second Best
Mixed Use
$804.6K
$704.0K – $938.7K
NOI $56,319 @ 7.0% cap · market cap 6.91%
Theoretical Best
Office A
$1.14M
$994.2K – $1.33M
NOI $79,535 @ 7.0% cap · market cap 9.76%
Zoning and permitted uses should be independently verified with authorities.
How Realmo checks its estimates
Property Analytics
Unlock full access to Insights
Subscribe to Realmo Intelligence
Open Analytics
Current Use
Lease Details
Turnkey business
Opportunity
Location Intelligence
Trade Area within ½ mile
742
Businesses Nearby
Explore this area
Business Placement
Demographics for 65714, MO
35,109
Population
13,459
Households
2.6
Avg Household Size
39
Median Age
37%
College-Educated
94%
High-School Grad
51.1 sq mi
ZIP Area
687
Density / Sq Mi
$82,548
Median Household Income
$46,746
Median Earnings
$985
Median Rent
$261,300
Median Home Value
Check the figures for this property
Cap Rate, Value Estimation, Potential NOI and more
View Realmo Analytics
Market
Vacancy Rate% for Office in Midwest region




Frequently Asked Questions
What type of property is this?
Live-work space - Remodeled mixed-use downtown building with existing tenants, offering flexible space for retail and office concepts.
Where is this live-work space located?
The property is located at 107 S Main St Nixa, MO.
What is the asking price?
The asking price for this property is $815,000.
What are key features of this property?
This property features: 1909‑built mixed‑use building in downtown Nixa; Remodeled mixed‑use property with existing tenants already in place; Flexible space suited for retail and office concepts


