Retail Storefront with Dressing
For Sale
$365,000
107-1431 Capital Ave, Watkinsville, GA 30677
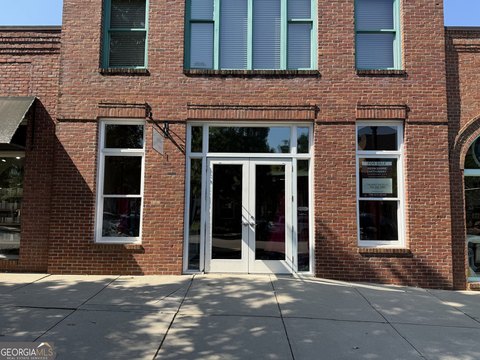
Standalone retail storefront offers natural light, high ceilings, sealed concrete floors, and interior dressing rooms and office.
Property Size1,401 SF
Price / SF$260.53
Days on Market159
Property Features for 107-1431 Capital Ave
General Information
Standard status
Active
Size
1,401 SF
Additional Details
Traffic Count
14,100 vehicles/day
Taxes and HOA fees
Annual Taxes
$2,417
Listing Agency:
BHHS Georgia Properties (Athen
(706) 613-6040
Listed By:
Heather McElroy · License #274191
(706) 206-5282
Source:
Exprealty
Added: May 12
Changed: Oct 15
Last Checked: Oct 16 at 11:15AM
Displayed information is deemed reliable but is not guaranteed and should be independently verified. All listing content including descriptions, pricing, images are the copyrighted material of BHHS Georgia Properties (Athen

Ask AI about this property
Review the available facts, identify missing information and prepare questions for the agent.
Investment Insights
Based on property information with market context.
This retail storefront space is approximately 1,400 square feet and features French doors with transoms flanked by two large storefront windows for natural light. Inside, the space includes high ceilings and sealed concrete floors. The current layout offers five dressing rooms, a half bathroom, and an office served by a rear entry.
The property is located in a market center on Capital Avenue in Watkinsville, Georgia. Public remarks reference 2024 GDOT AADT of 14,100.
Showings are available by appointment only.
The property is located in a market center on Capital Avenue in Watkinsville, Georgia. Public remarks reference 2024 GDOT AADT of 14,100.
Showings are available by appointment only.
Key Highlights
- Approximately 1,400 SF standalone retail storefront in Market Center on Capital Avenue
- French doors with transoms flanked by two large storefront windows for natural light
- High ceilings and sealed concrete floors
Financial Insights
Estimated NOI and Cap Rate
NOI / Yr
$15,834
Cap Rate
4.34%
Suggested Prices Based on Cap Rates
Cap Rate 5%
$316,680
$316.7K
Cap Rate 7%
$226,200
$226.2K
Cap Rate 9%
$175,933
$175.9K
Market Conditions
NOI Build-Up for 1,401 SF
Gross rent
$25.2K $18.00/SF
− Vacancy
−$2.6K −$1.85/SF
EGI
$22.6K $16.15/SF
− OpEx
−$6.8K −$4.84/SF
NOI
$15.8K $11.30/SF
Area
Oconee County, GA
Vacancy
10.30%
Lease Rate
$18.00 /SF/Yr
Expense Ratio
30.00%
Simulate Cap Rate and NOI
Suggested Prices Based on Cap Rates
Cap Rate 5%
$316,680
Cap Rate 7%
$226,200
Cap Rate 9%
$175,933
Alternative Uses
Best Use
Retail
$226.2K
$197.9K – $263.9K
NOI $15,834 @ 7.0% cap · market cap 4.34%
Second Best
—
—
no second resolved use
Theoretical Best
Office A
$337.7K
$295.5K – $394.0K
NOI $23,642 @ 7.0% cap · market cap 6.48%
Zoning and permitted uses should be independently verified with authorities.
How Realmo checks its estimates
Property Analytics
Current Use
Lease Details
14,100 VPD
Traffic count
Location Intelligence
Trade Area within ½ mile
416
Businesses Nearby
2k
Monthly Visits Nearby
Balanced
Demand for This Use
Explore this area
Business Placement
Foot Traffic Nearby
Dining 100%
Marco's Pizza
Dining
1,825 visits/mo
0.4 miles
Demographics for 30677, GA
20,579
Population
7,797
Households
2.6
Avg Household Size
41
Median Age
55%
College-Educated
97%
High-School Grad
122.2 sq mi
ZIP Area
168
Density / Sq Mi
$103,165
Median Household Income
$49,399
Median Earnings
$1,403
Median Rent
$394,800
Median Home Value
Market
Vacancy Rate% for Retail in South region






Frequently Asked Questions
What type of property is this?
Storefront property - Standalone retail storefront offers natural light, high ceilings, sealed concrete floors, and interior dressing rooms and office.
Where is this storefront property located?
The property is located at 107-1431 Capital Ave Watkinsville, GA.
What is the asking price?
The asking price for this property is $365,000.
What are key features of this property?
This property features: Approximately 1,400 SF standalone retail storefront in Market Center on Capital Avenue; French doors with transoms flanked by two large storefront windows for natural light; High ceilings and sealed concrete floors


