Four-Unit Quadplex With
For Sale
$550,000
10598 106TH, Largo, FL 33773
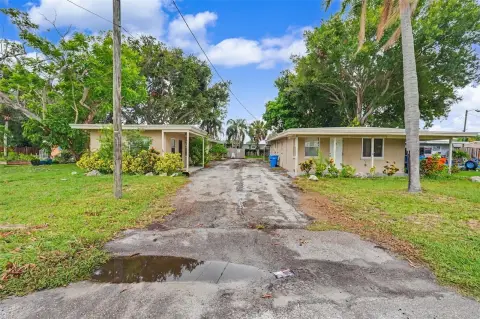
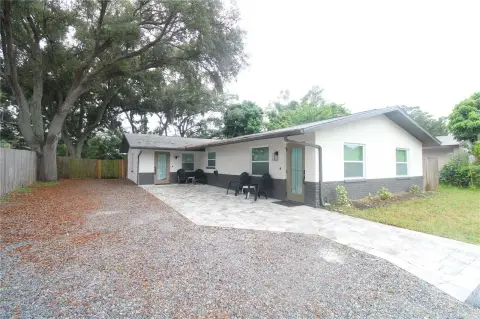
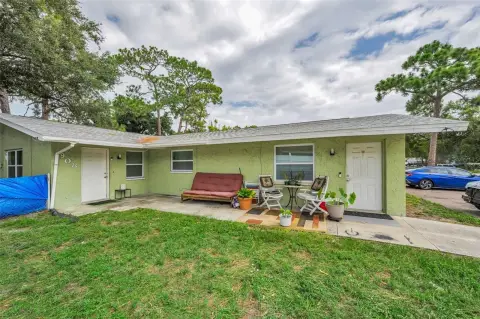
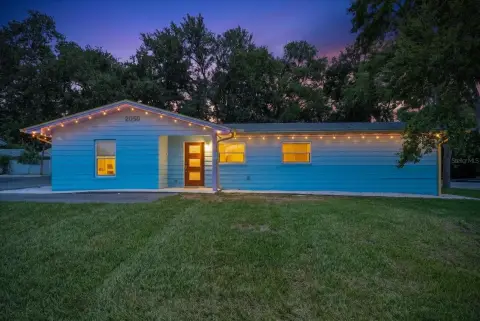
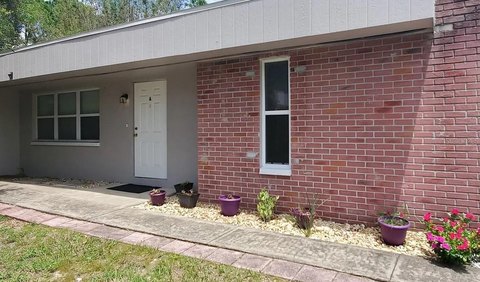
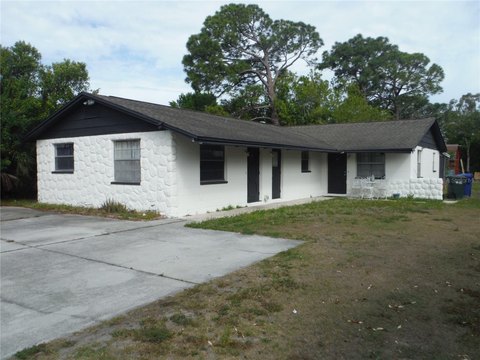
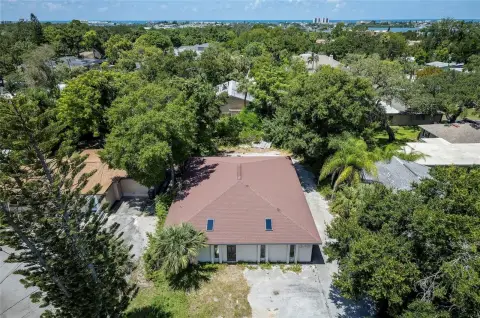
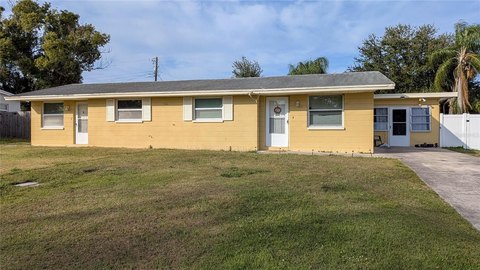
Two separate buildings offer a manageable layout with attached garage space and one unit undergoing renovation.
Property Size1,860 SF
Days on Market49
Property Features for 10598 106TH
General Information
Standard status
Active
Size
1,860 SF
Property subtype
Investment
Taxes and HOA fees
Annual Taxes
$7,791
Building Details
Building Size
1,860 SF
Year Built
1957
Listing Agency:
EXP REALTY LLC
Listed By:
Jeffrey Borham, PA · License #3115528
(866) 308-7109
Source:
Elliman
Added: Aug 19
Changed: Sep 29
Last Checked: Oct 5 at 7:41PM
Displayed information is deemed reliable but is not guaranteed and should be independently verified. All listing content including descriptions, pricing, images are the copyrighted material of EXP REALTY LLC
Investment Insights
Based on property information with market context.
This quadplex contains four 1-bedroom, 1-bathroom residences arranged across two separate buildings, with two units in each structure. Three apartments are currently rented, while the remaining unit is being renovated. Two residences have attached one-car garages. Roofing includes a 2024 installation on one building and a 2017 installation on the other, and the property is identified as being outside a flood zone.
The property is located at 10598 106TH in Largo, FL 33773, within Pinellas County. Indian Rocks Beach is approximately 15 minutes away, with Walsingham Park, shopping, restaurants, and daily conveniences nearby. Walk Score is 41, Bike Score is 47, and Transit Score is 28.
The property is located at 10598 106TH in Largo, FL 33773, within Pinellas County. Indian Rocks Beach is approximately 15 minutes away, with Walsingham Park, shopping, restaurants, and daily conveniences nearby. Walk Score is 41, Bike Score is 47, and Transit Score is 28.
Key Highlights
- Four 1‑bedroom, 1‑bathroom units across two separate buildings
- Three units currently rented; fourth unit undergoing renovation
- Two attached one‑car garages
Financial Insights
Estimated NOI and Cap Rate
NOI / Yr
$21,711
Cap Rate
3.95%
Suggested Prices Based on Cap Rates
Cap Rate 5%
$434,220
$434.2K
Cap Rate 7%
$310,157
$310.2K
Cap Rate 9%
$241,233
$241.2K
Market Conditions
NOI Build-Up for 1,860 SF
Gross rent
$33.3K $17.88/SF
− Vacancy
−$2.2K −$1.21/SF
EGI
$31.0K $16.67/SF
− OpEx
−$9.3K −$5.00/SF
NOI
$21.7K $11.67/SF
Area
Pinellas County, FL
Vacancy
6.74%
Lease Rate
$17.88 /SF/Yr
Expense Ratio
30.00%
Simulate Cap Rate and NOI
Suggested Prices Based on Cap Rates
Cap Rate 5%
$434,220
Cap Rate 7%
$310,157
Cap Rate 9%
$241,233
Alternative Uses
Best Use
Multifamily LT 5
$310.2K
$271.4K – $361.9K
NOI $21,711 @ 7.0% cap · market cap 3.95%
Second Best
Apartment 5plus
$244.4K
$213.8K – $285.1K
NOI $17,107 @ 7.0% cap · market cap 3.11%
Theoretical Best
Office A
$483.8K
$423.3K – $564.4K
NOI $33,866 @ 7.0% cap · market cap 6.16%
Zoning and permitted uses should be independently verified with authorities.
Property Analytics
Current Use
Location Intelligence
Trade Area within ½ mile
558
Businesses Nearby
Explore this area
Business Placement
Demographics for 33773, FL
17,494
Population
8,353
Households
2.1
Avg Household Size
48
Median Age
31%
College-Educated
91%
High-School Grad
5.1 sq mi
ZIP Area
3,430
Density / Sq Mi
$74,115
Median Household Income
$46,759
Median Earnings
$1,567
Median Rent
$280,600
Median Home Value
Market
Vacancy Rate% for Multifamily in South region

Questions? Ask Rey
Realmo’s AI knows this listing — price, zoning, demand, history. Ask anything.



Frequently Asked Questions
What type of property is this?
Quadplex - Two separate buildings offer a manageable layout with attached garage space and one unit undergoing renovation.
Where is this quadplex located?
The property is located at 10598 106TH Largo, FL.
What is the asking price?
The asking price for this property is $550,000.
What are key features of this property?
This property features: Four 1‑bedroom, 1‑bathroom units across two separate buildings; Three units currently rented; fourth unit undergoing renovation; Two attached one‑car garages