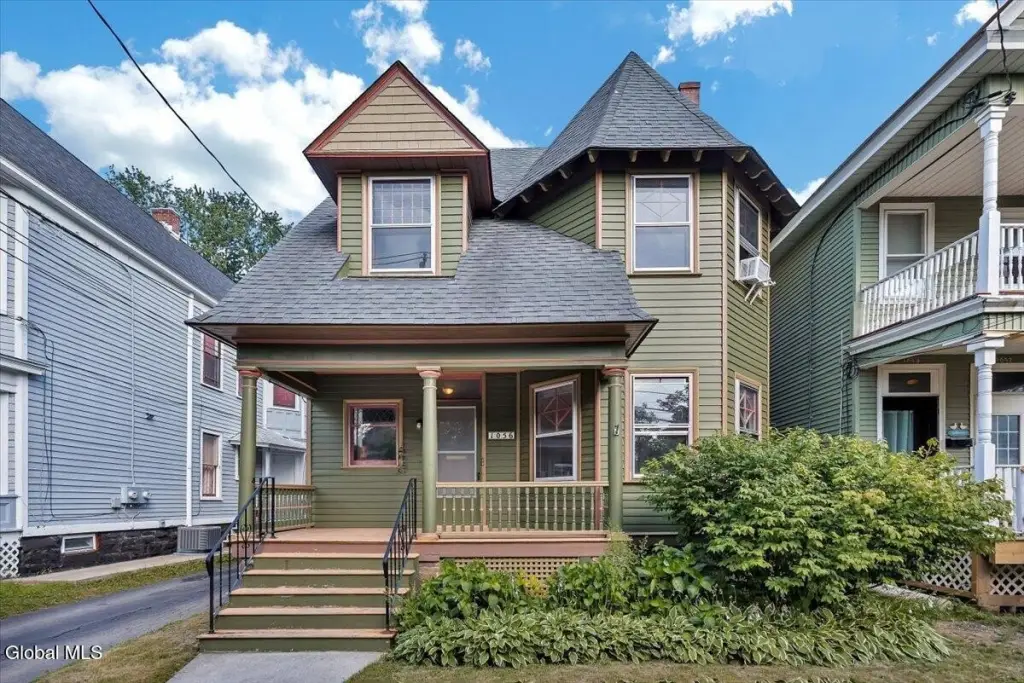
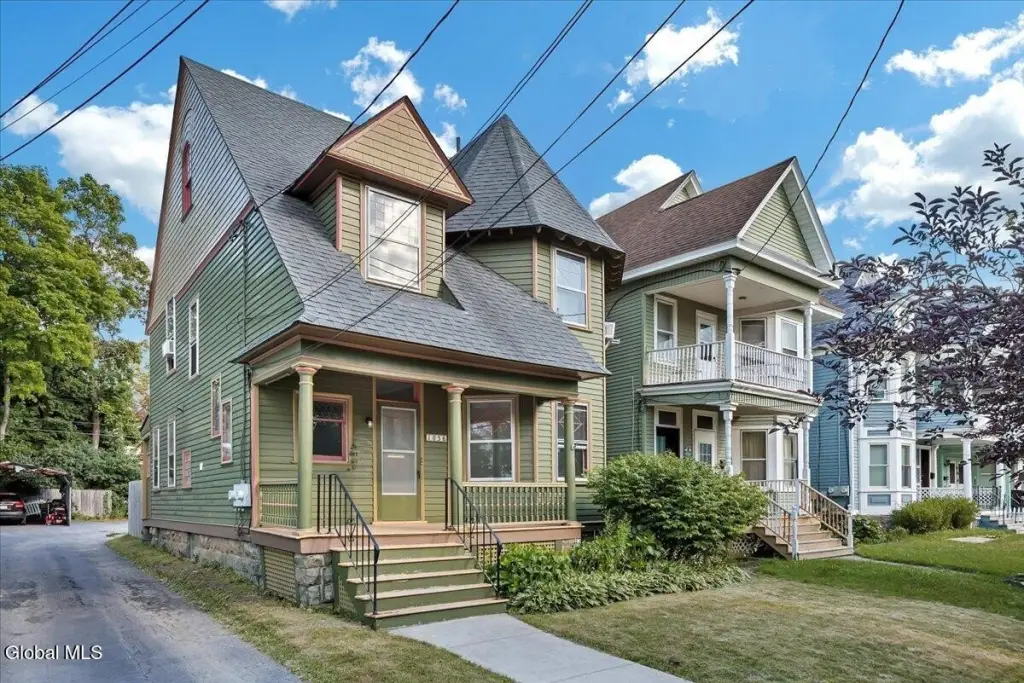
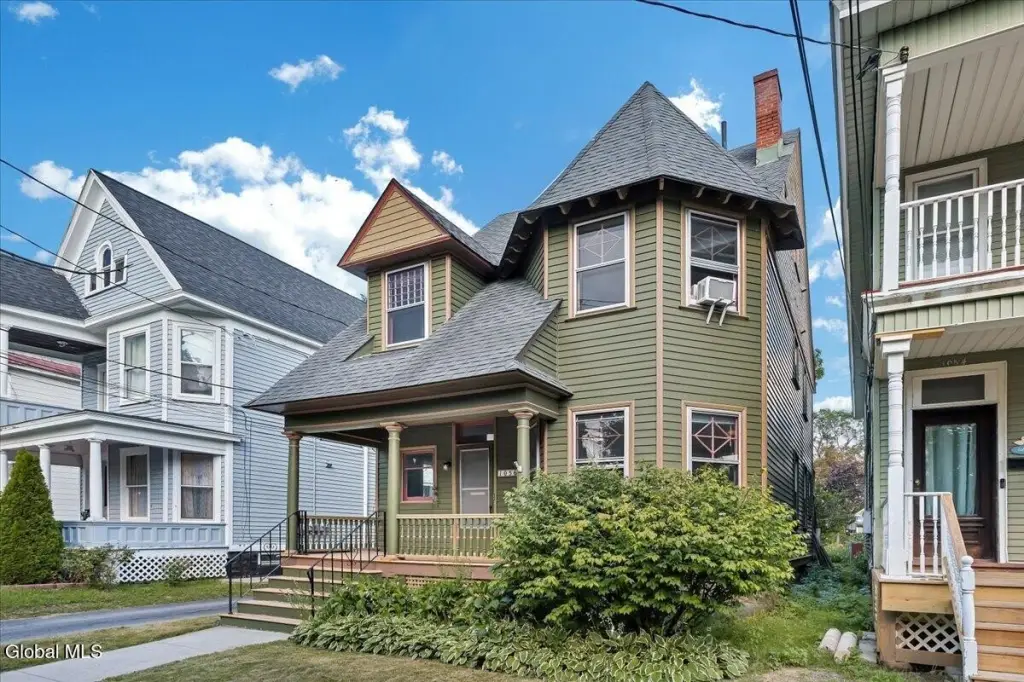
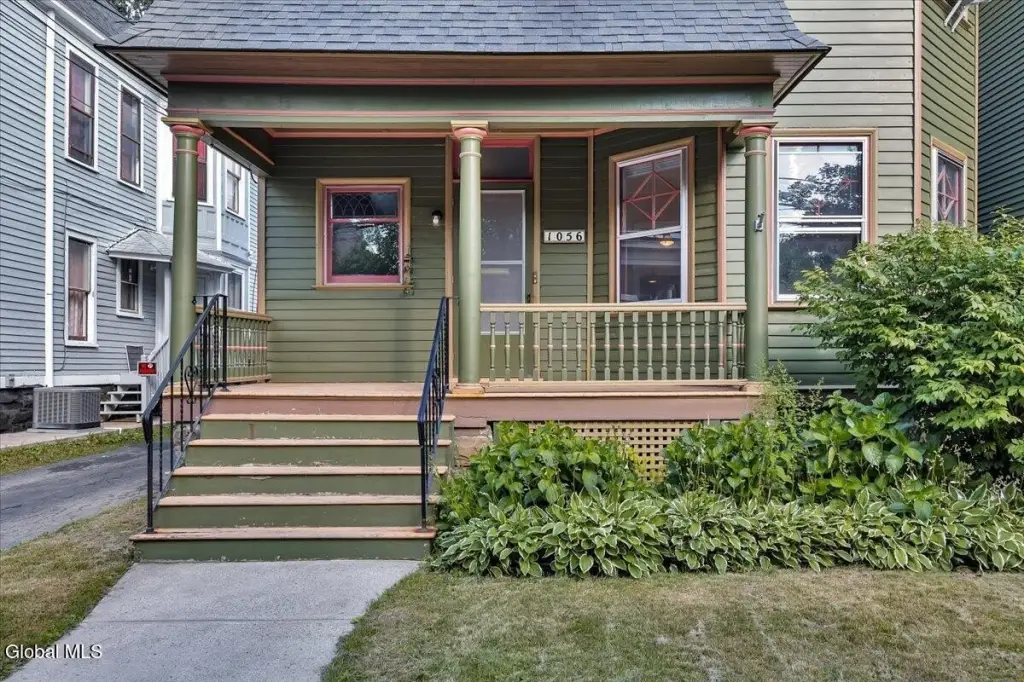
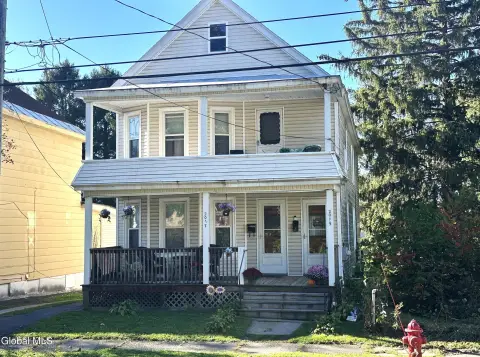
Three-Level Victorian
For Sale
$325,000
1056 Wendell Avenue, Schenectady, NY 12308
MultiFamily, Schenectady, NY
Property Size2,139 SF
Lot Size0.10 Acres
Price / SF$151.94
Days on Market97
Property Features for 1056 Wendell Avenue
General Information
Property type
Residential Multi Family
Property subtype
Duplex
Bedrooms
4
Bathrooms
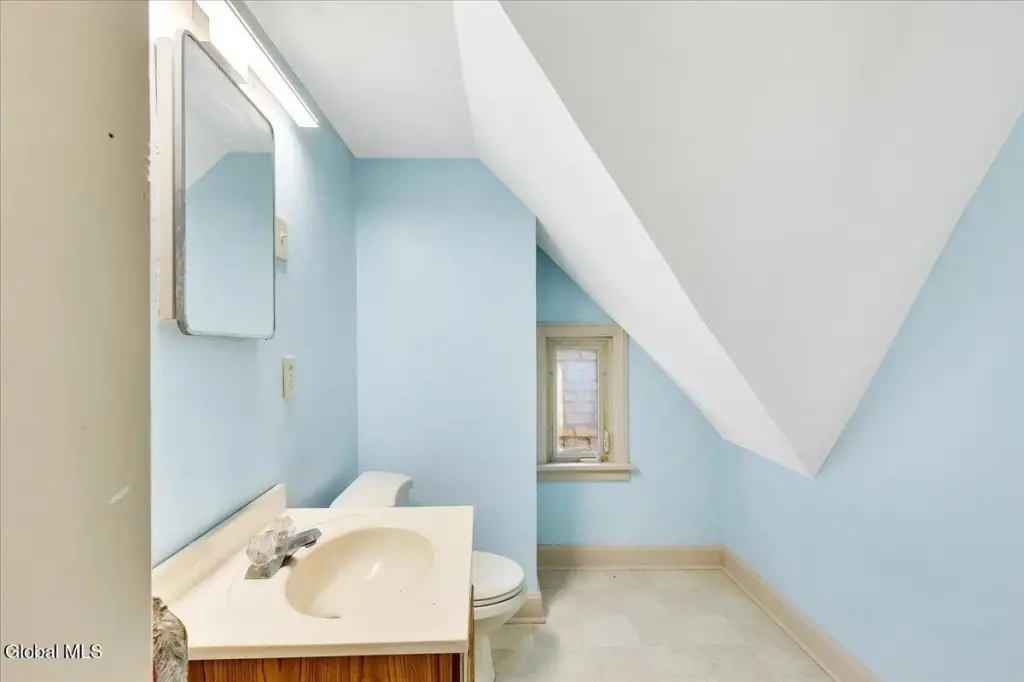
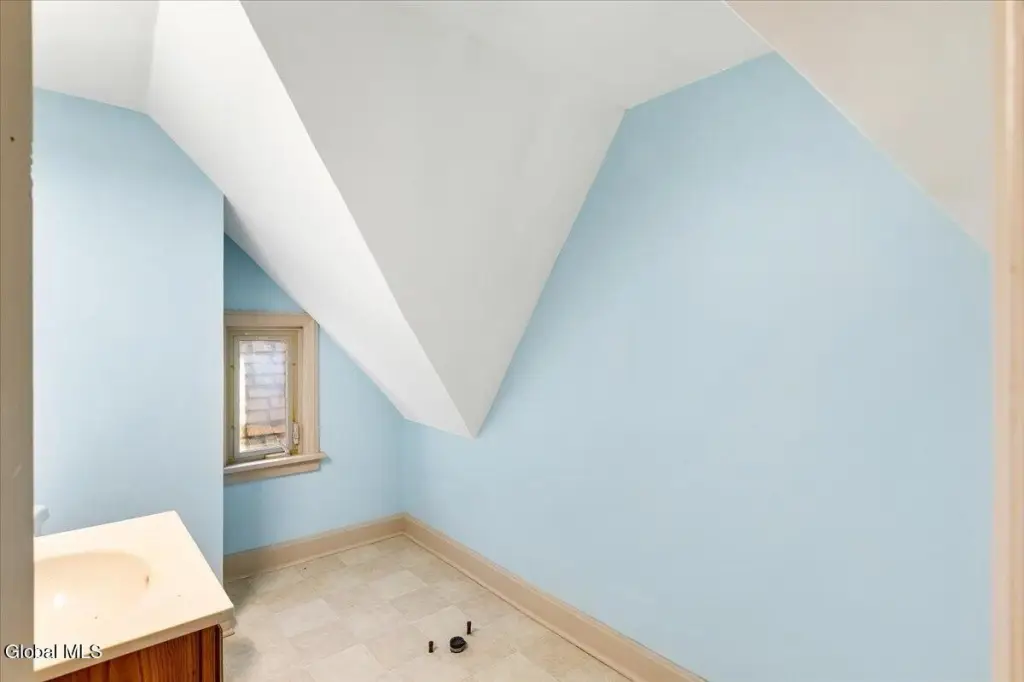
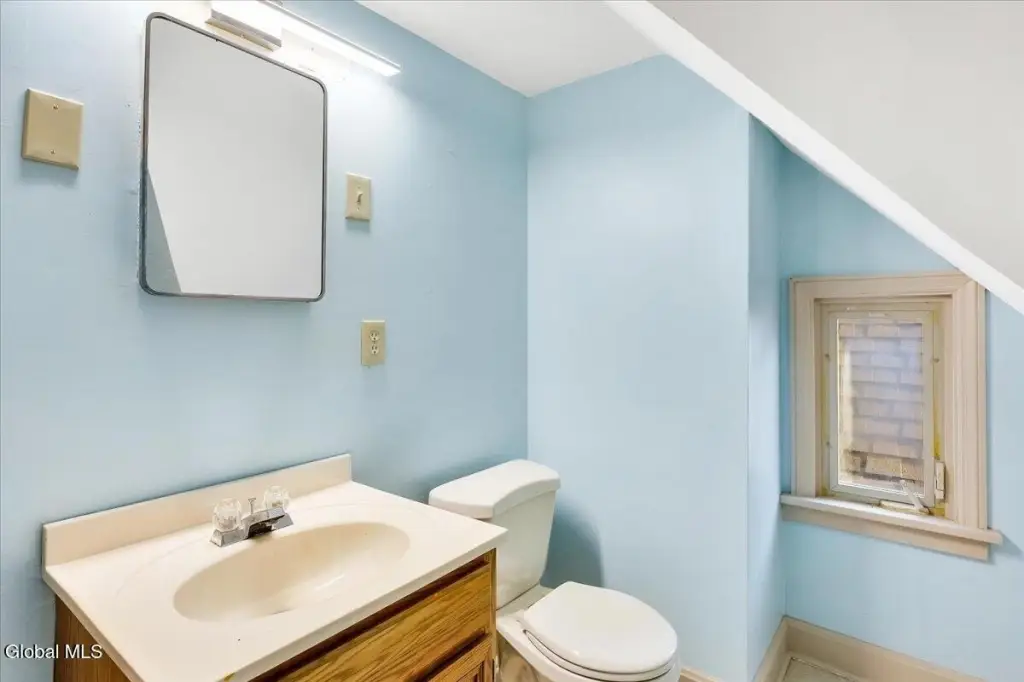
3
Full bathrooms
2
Half bathrooms
1
Rooms
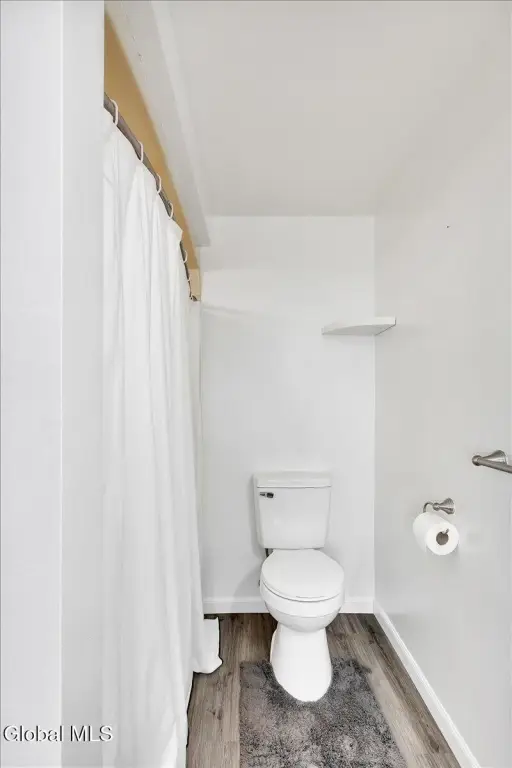
Bathroom 3, Bathroom 2, Bedroom 1, Bedroom 2, Bedroom 3, Bedroom 4, Bathroom 1
Parking
2
Parking features
Off Street, Driveway
Patio and Porch features
Porch, Deck
Interior features
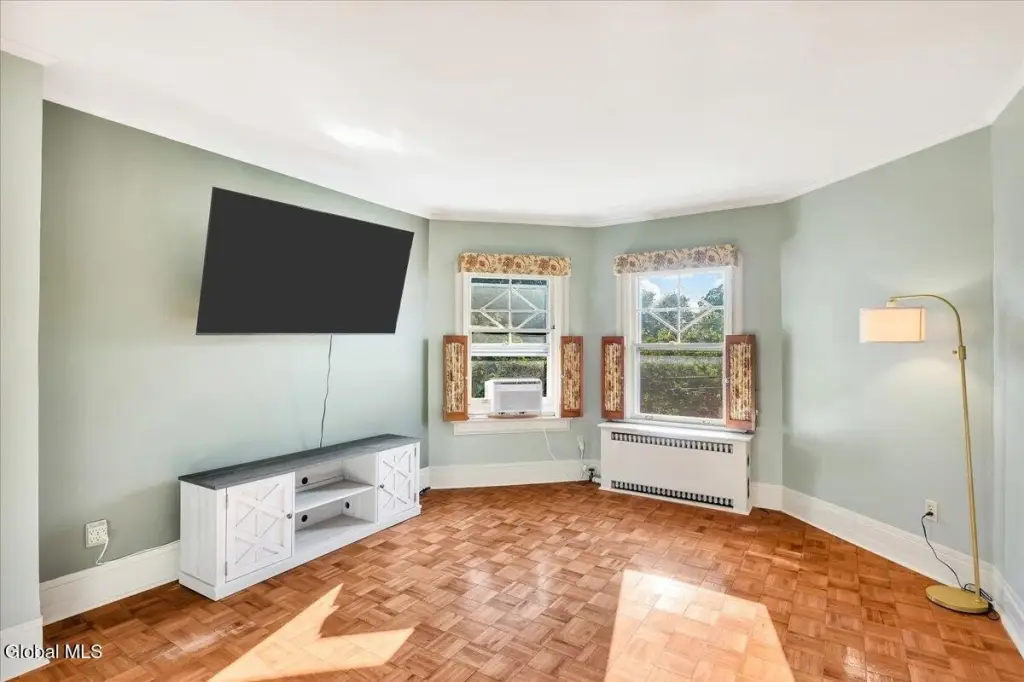
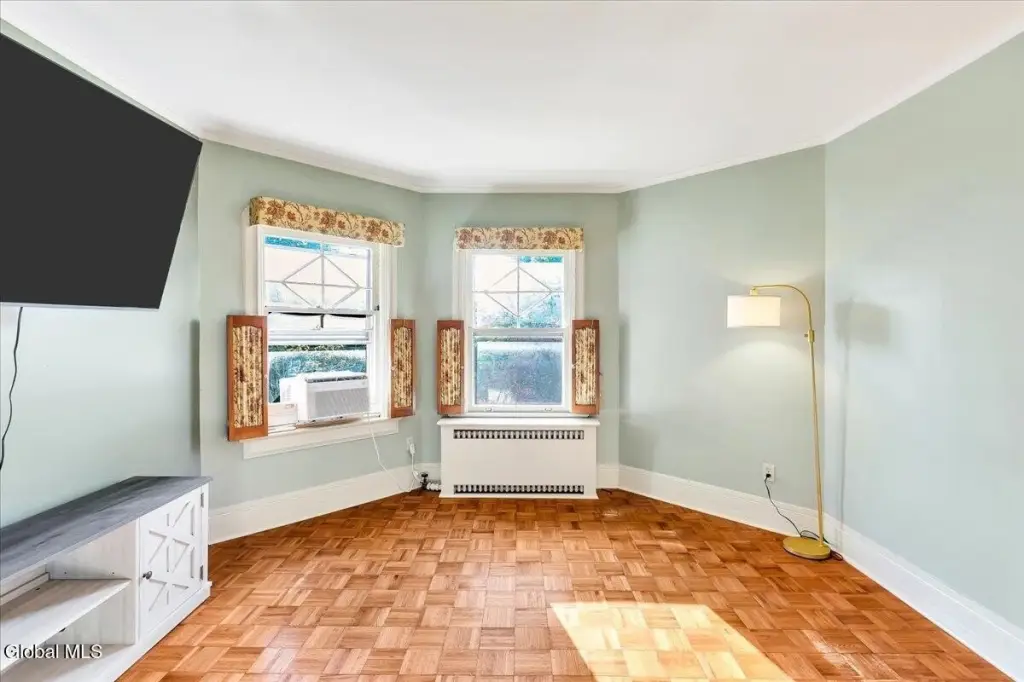
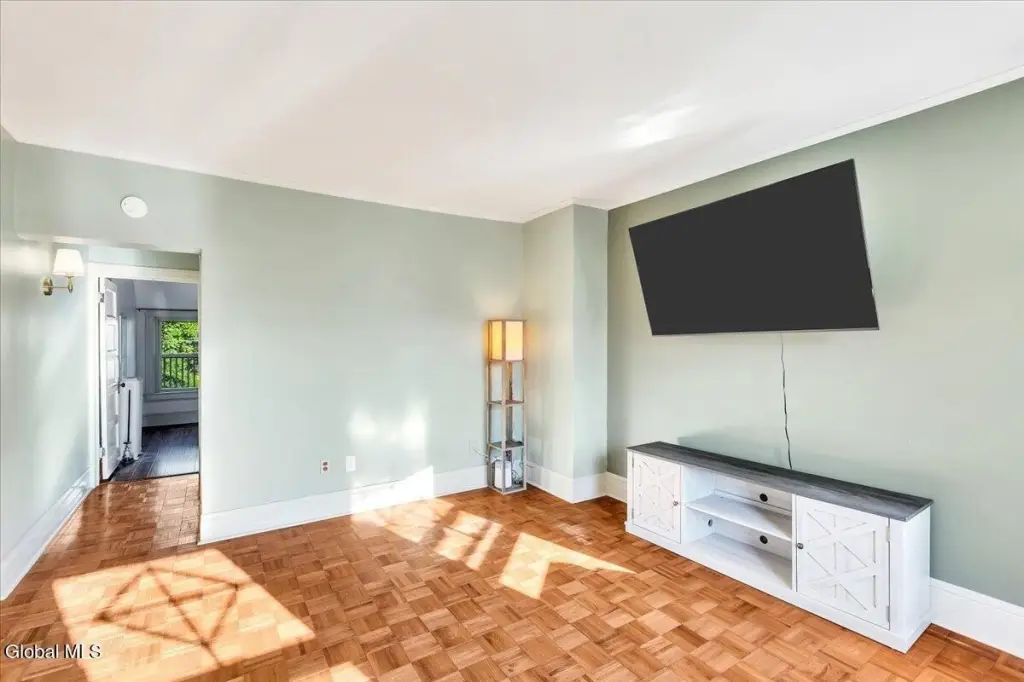
Paddle Fan, High Speed Internet, Walk-In Closet(s), Built-in Features, Ceramic Tile Bath, Chair Rail, Crown Molding
Basement
Full, Walk-Out Access, Exterior Entry, Interior Entry
Lot features
Level, Garden
High school
Schenectady
Elementary school district
Schenectady
Middle school district
Schenectady
High school district
Schenectady
Directions
Union St to Wendell Ave, home on the right hand side before Oxford Pl
Standard status
Active
APN
421500 39.75-2-52
Size
2,139 SF
Lot size
0.10 Acres
Taxes and HOA fees
Tax Annual Amount
8054
Utilities
Utilities
Cable Available
Sewer type
Public Sewer
Heating system
Hot Water(Heating), Baseboard, Natural Gas, Radiant
Cooling system
Window Unit(s)
Water source
Public
Amenities
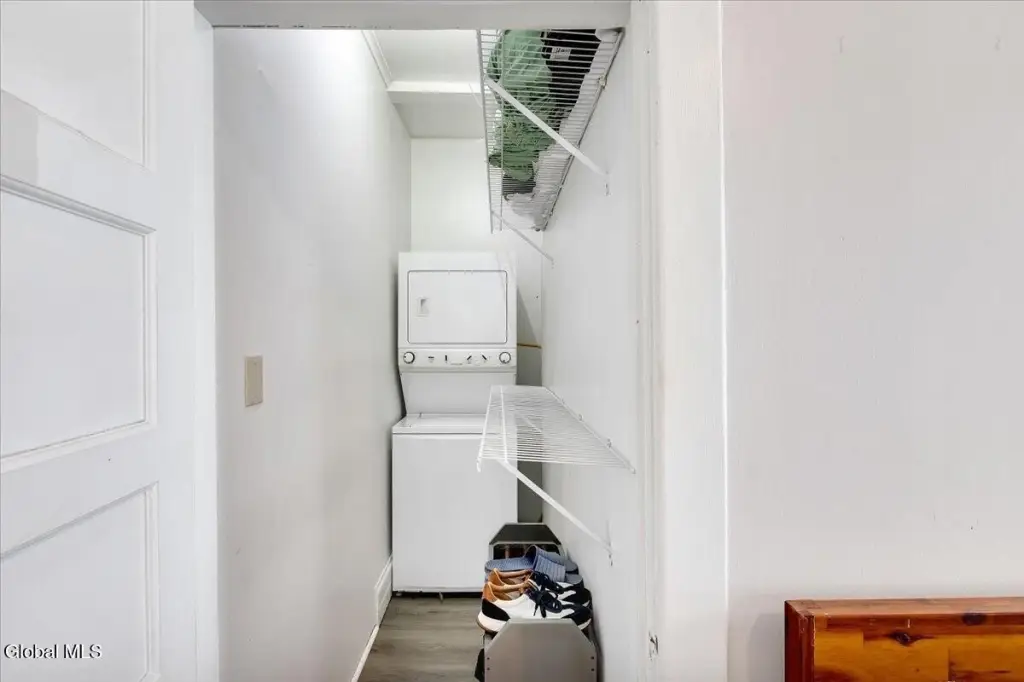
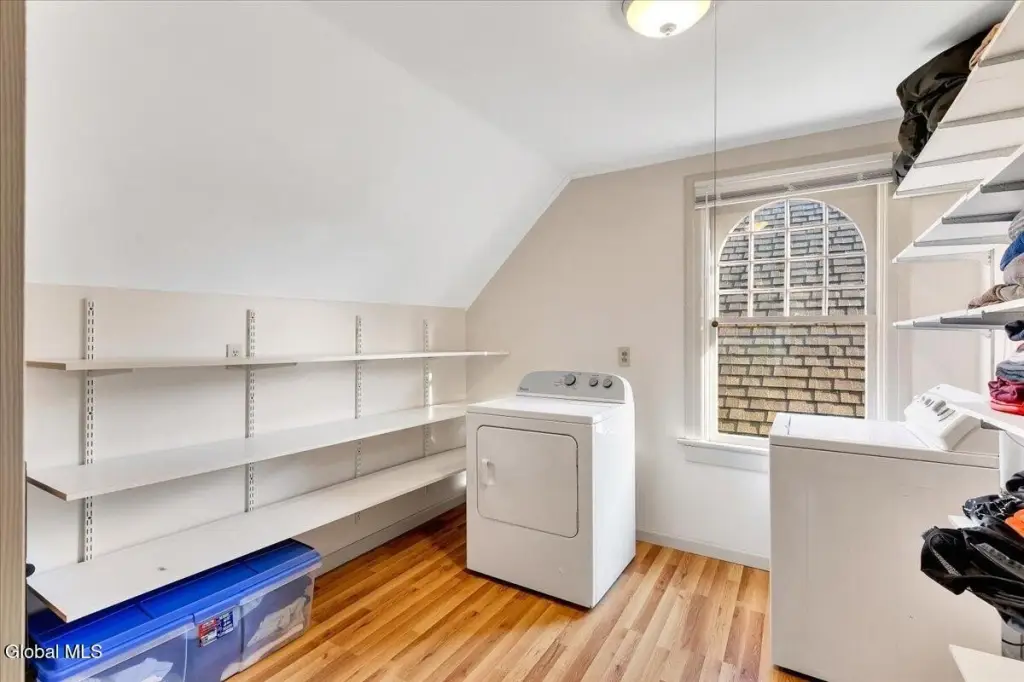
in-unit washer/dryer
deck
storage
walkout basement
Building Details
Year built
1896
Number of units
2
Flooring type
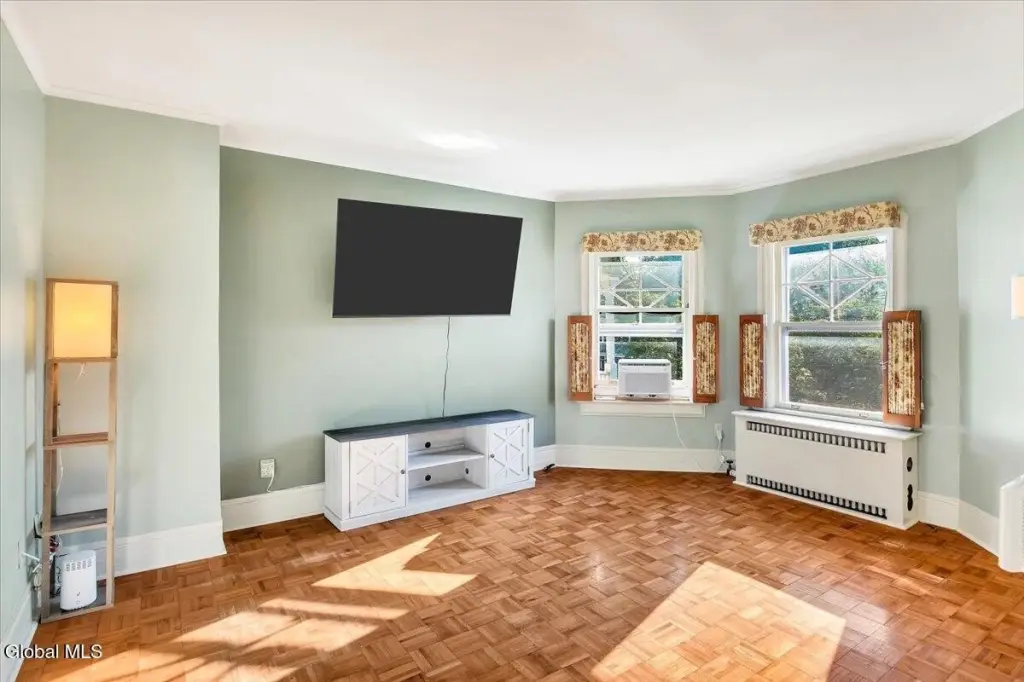
Laminate, Hardwood, Tile - Ceramic, Vinyl
Building materials
Wood Siding
Roof type
Shingle, Asphalt
Architectural style
Other
Listing Agency:
KW Platform · Keller Williams Realty
(518) 724-5800
Listed By:
Patrick Dunn · License #10401288889
(518) 407-9834
Added: Jul 10
Changed: Oct 2
Last Checked: Oct 14 at 7:06PM
MLS# 202621568
Copyright © 2026 Global MLS, Inc. All rights reserved. All information provided by the listing agent/broker is deemed reliable but is not guaranteed and should be independently verified.
Investment Insights
Based on property information with market context.
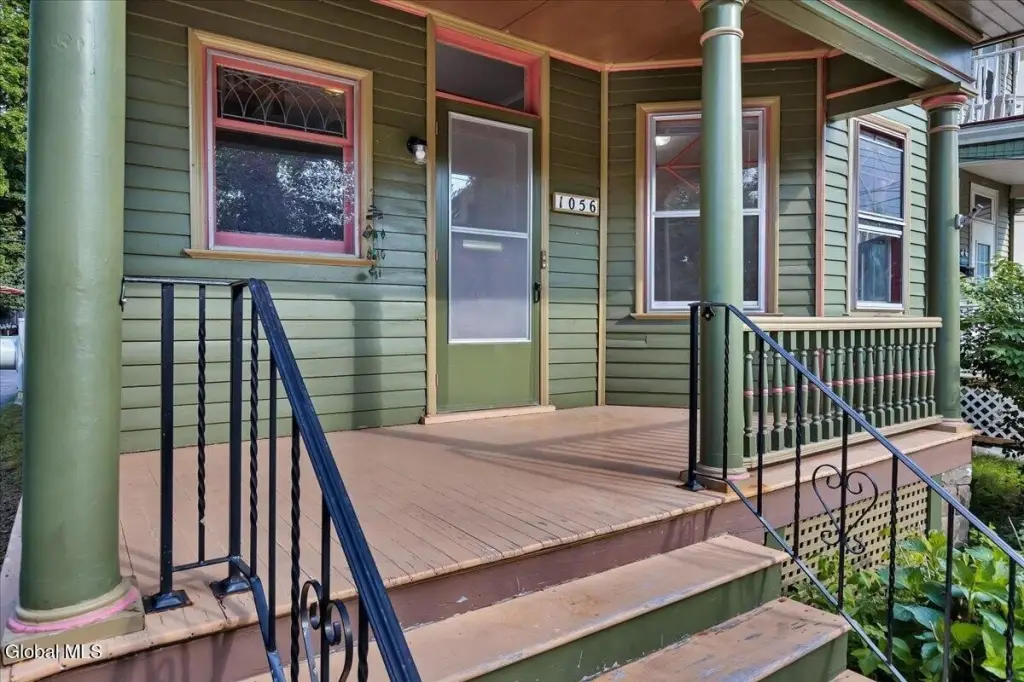
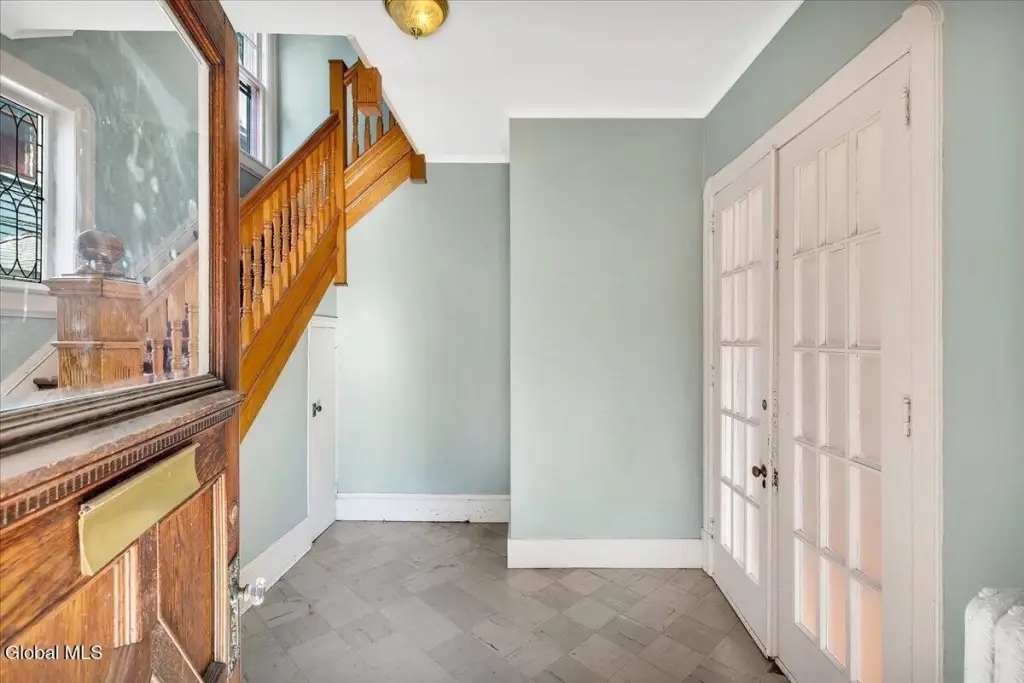
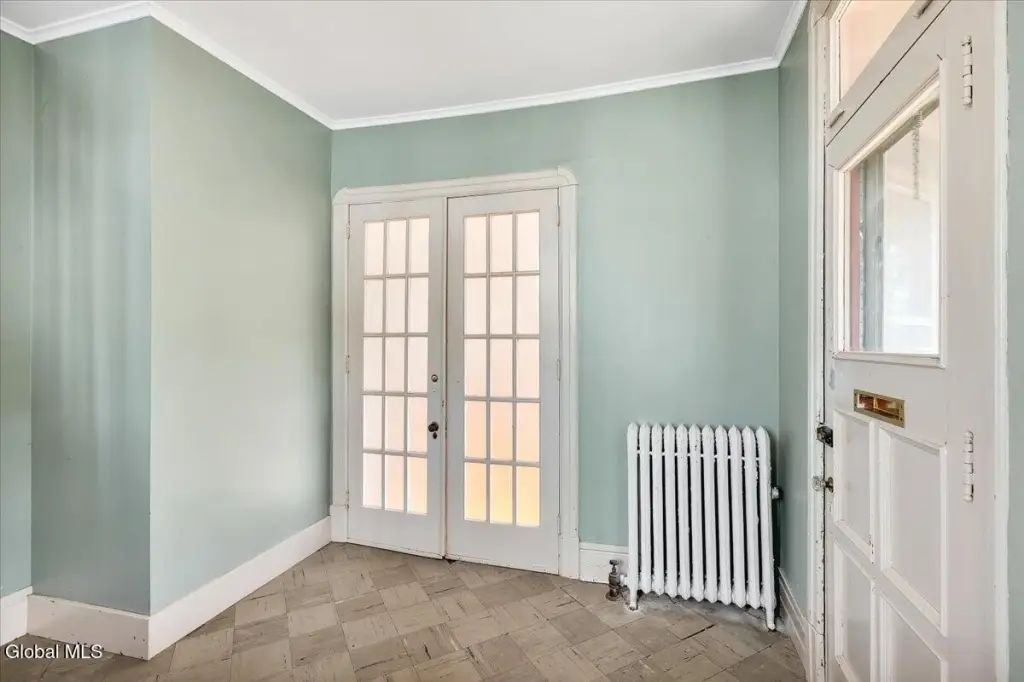
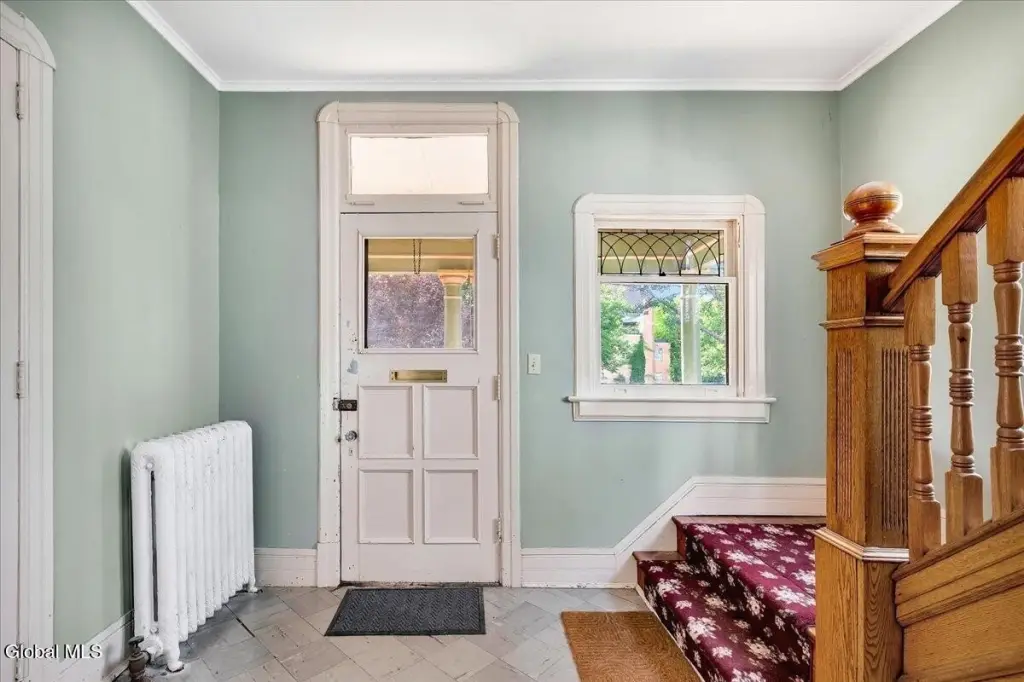
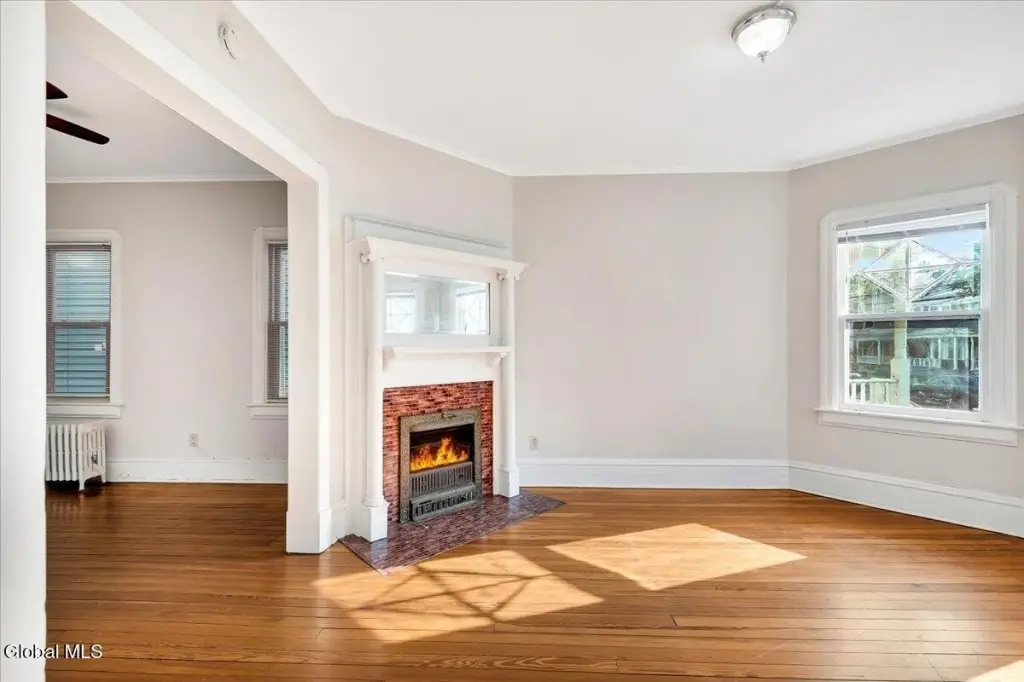
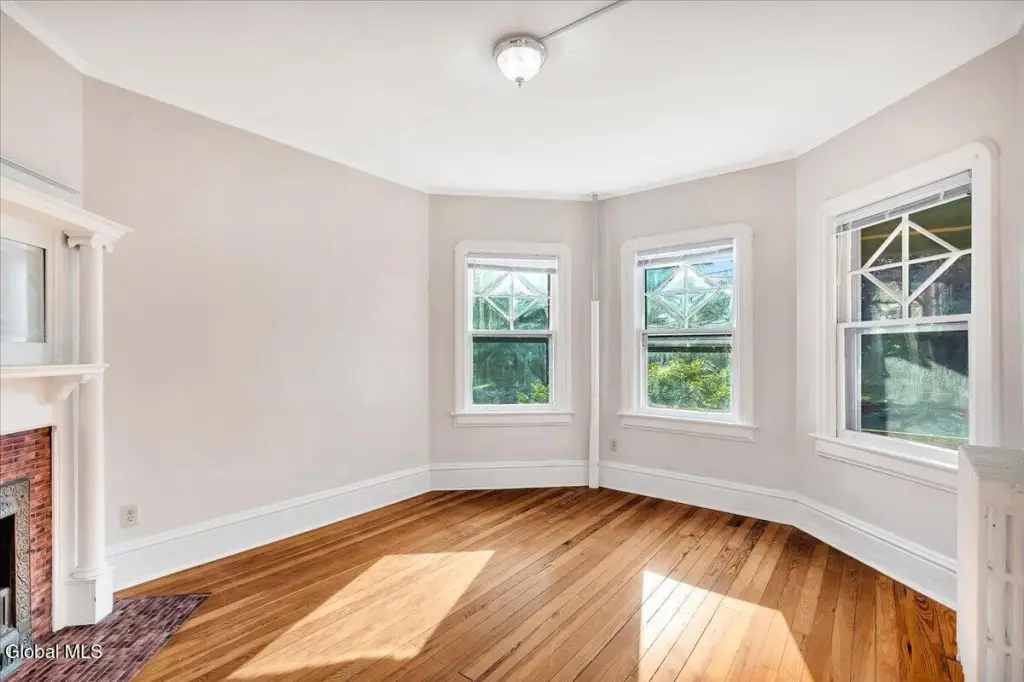
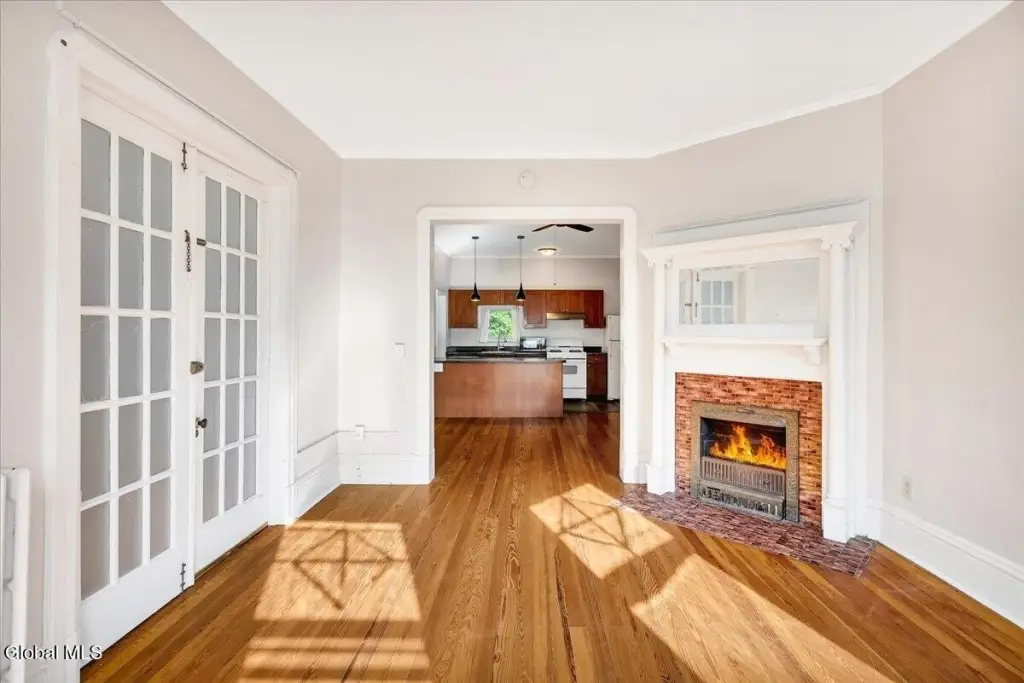
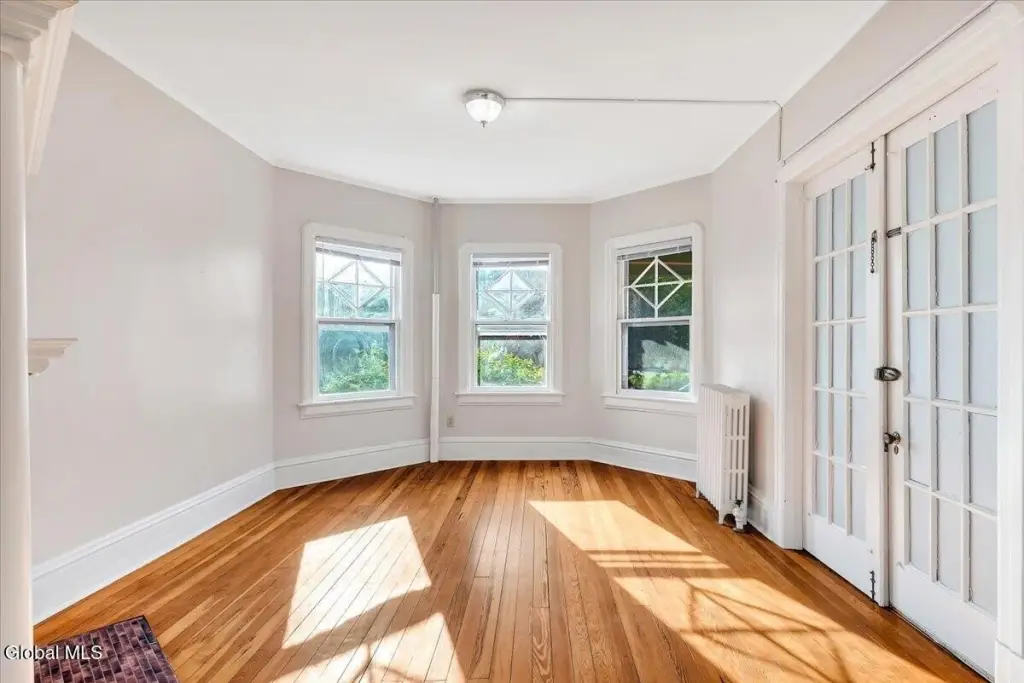
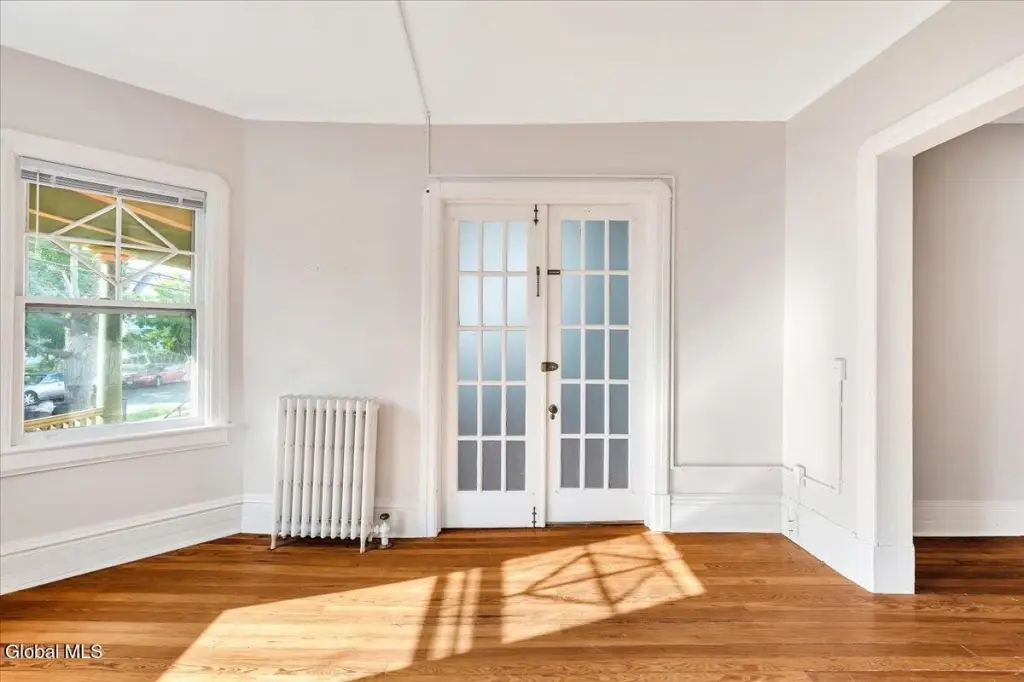
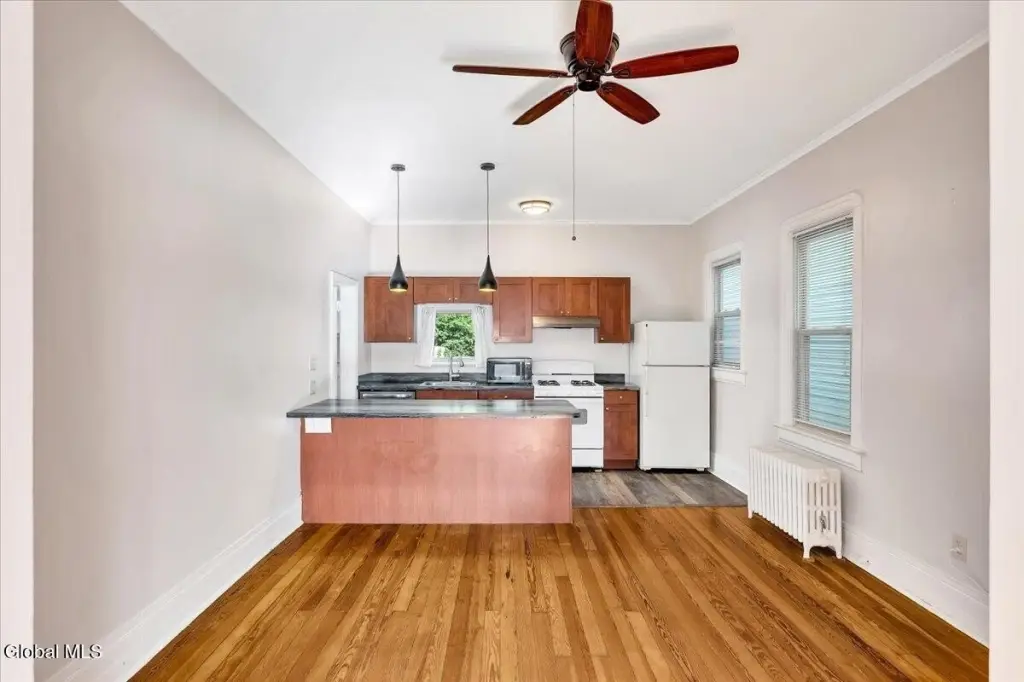
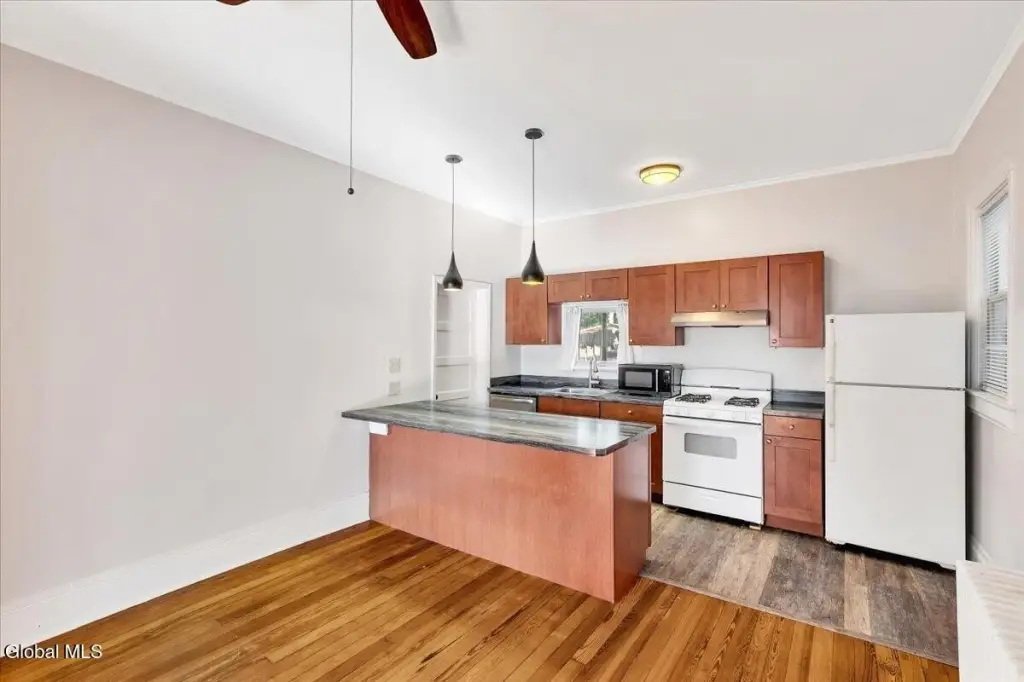
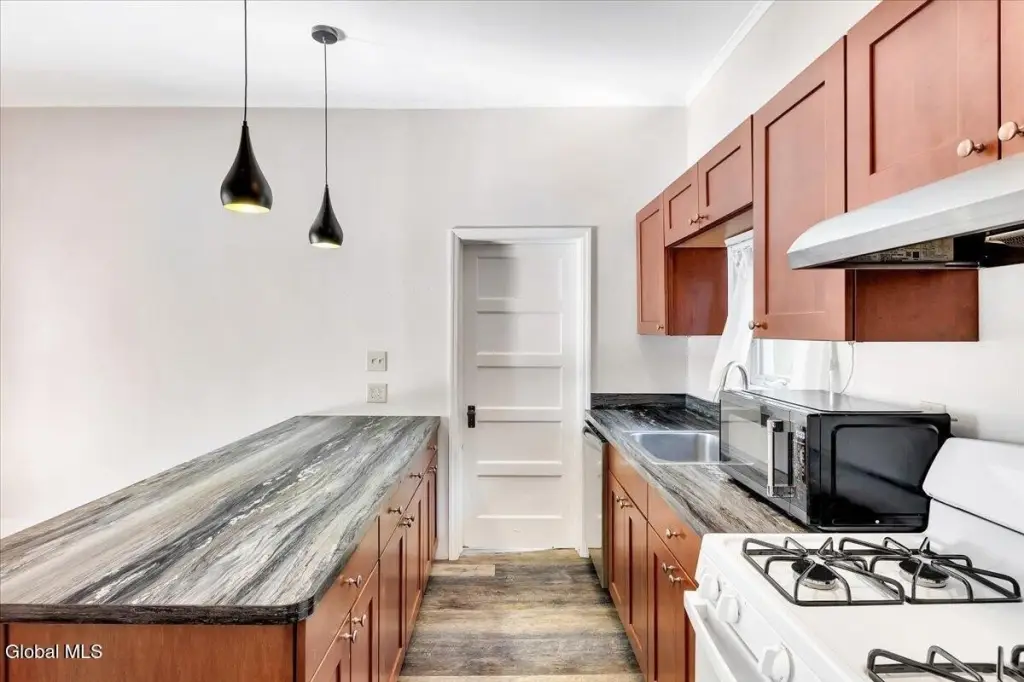
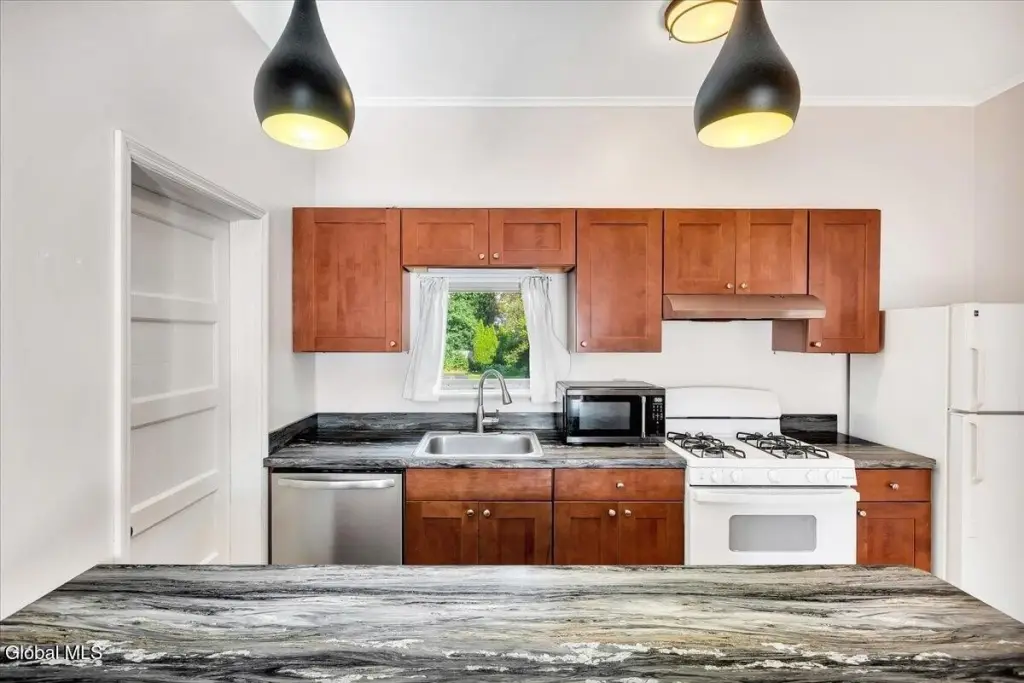
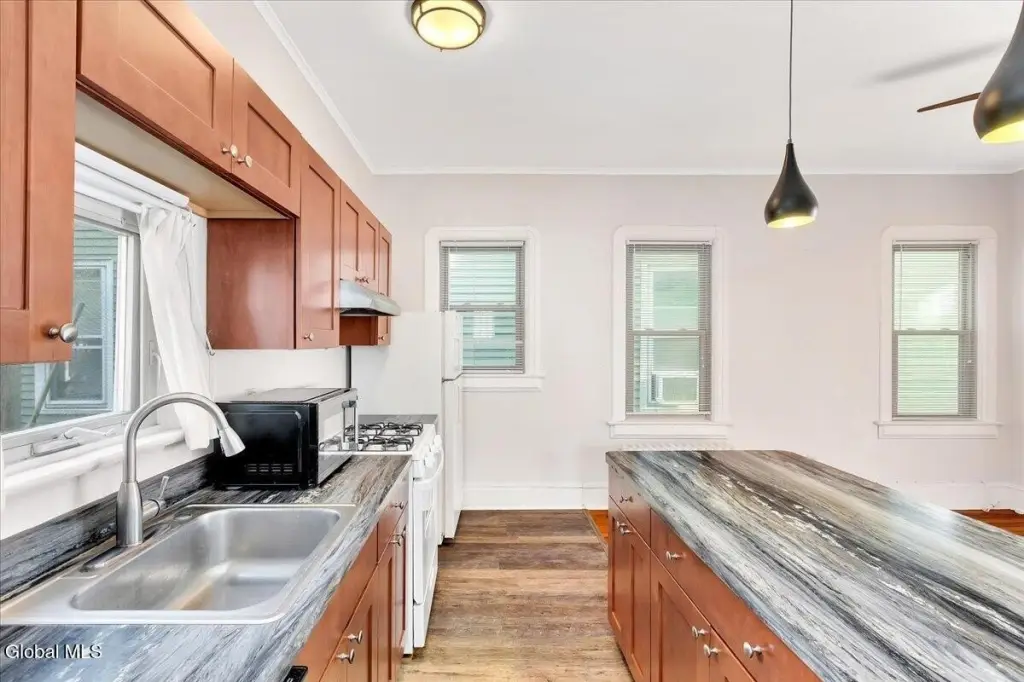
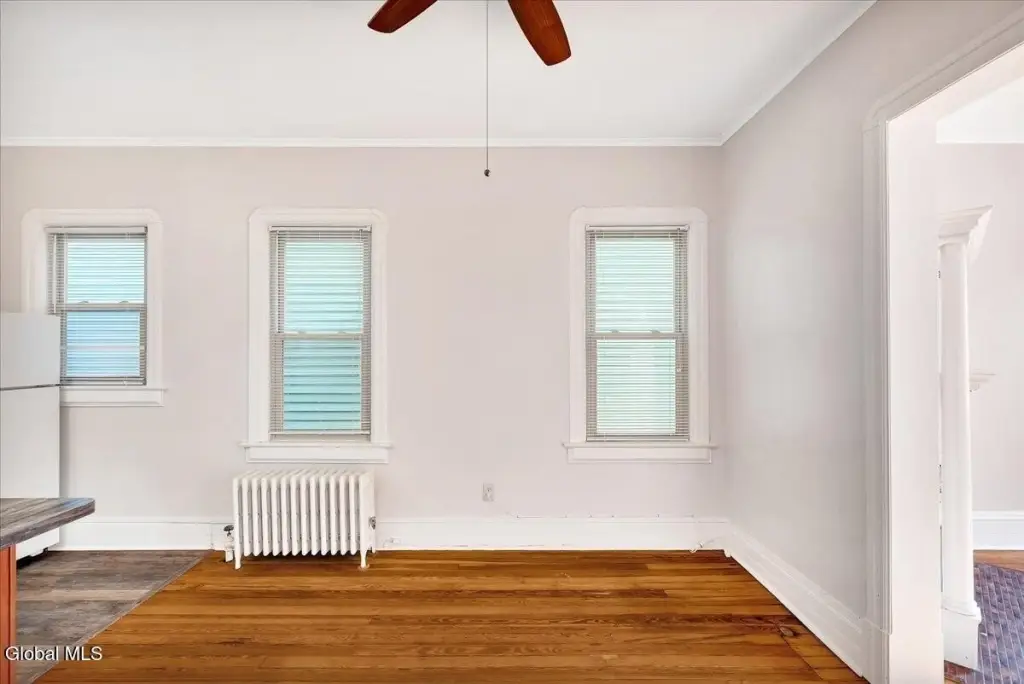
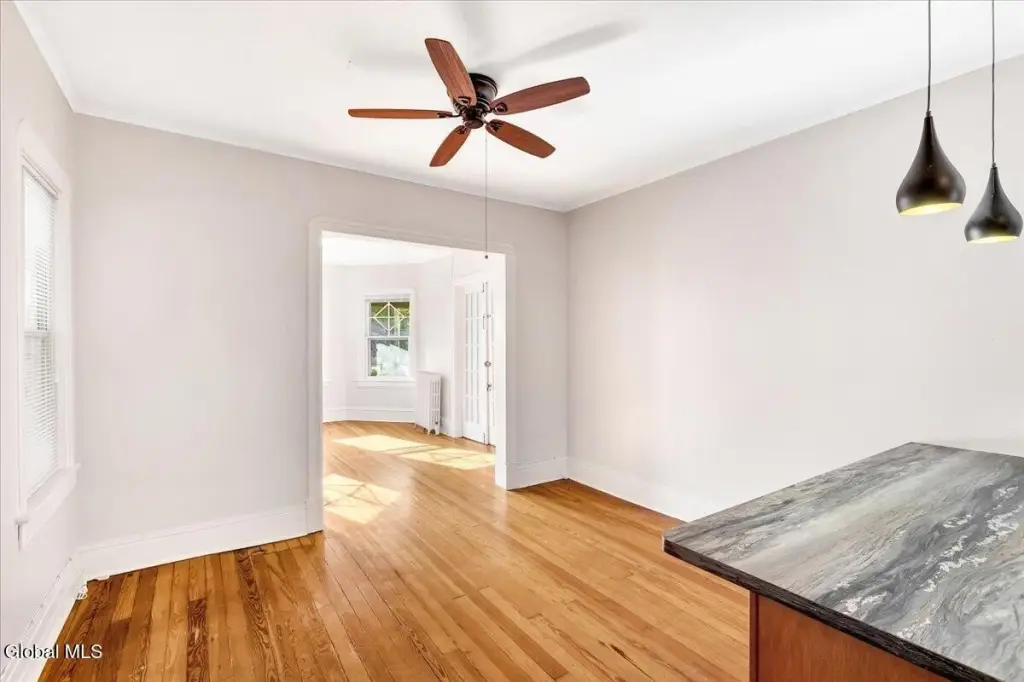
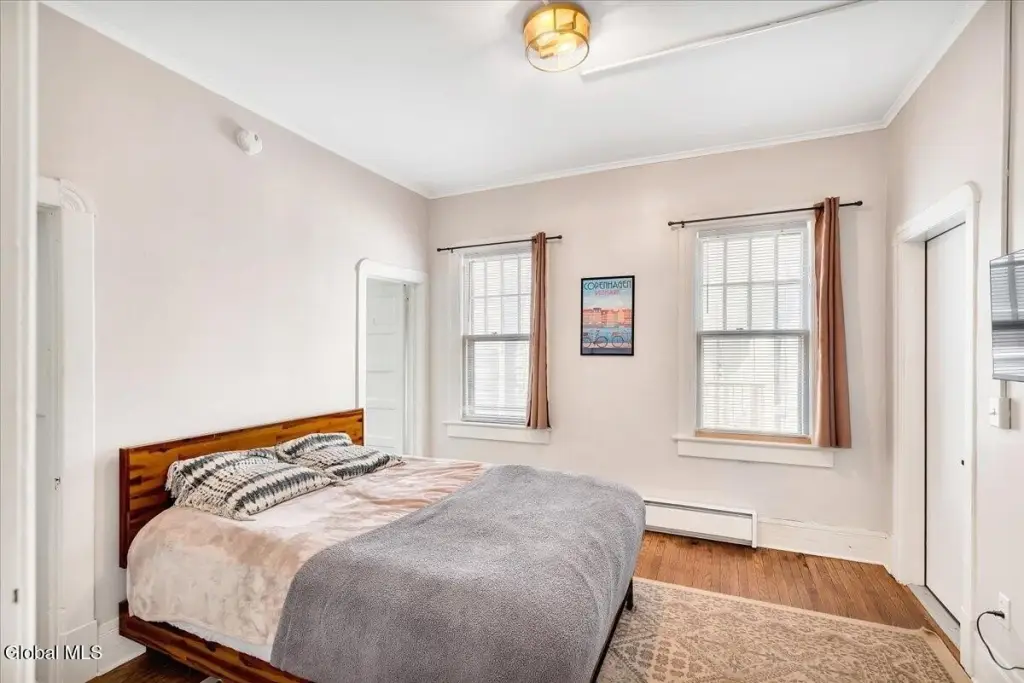
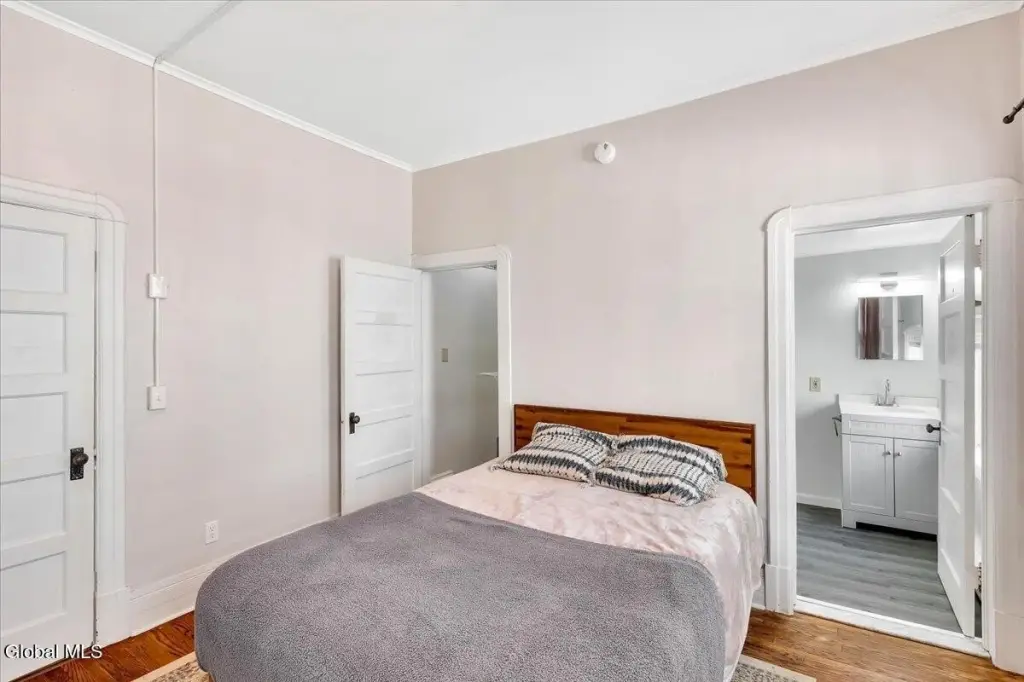
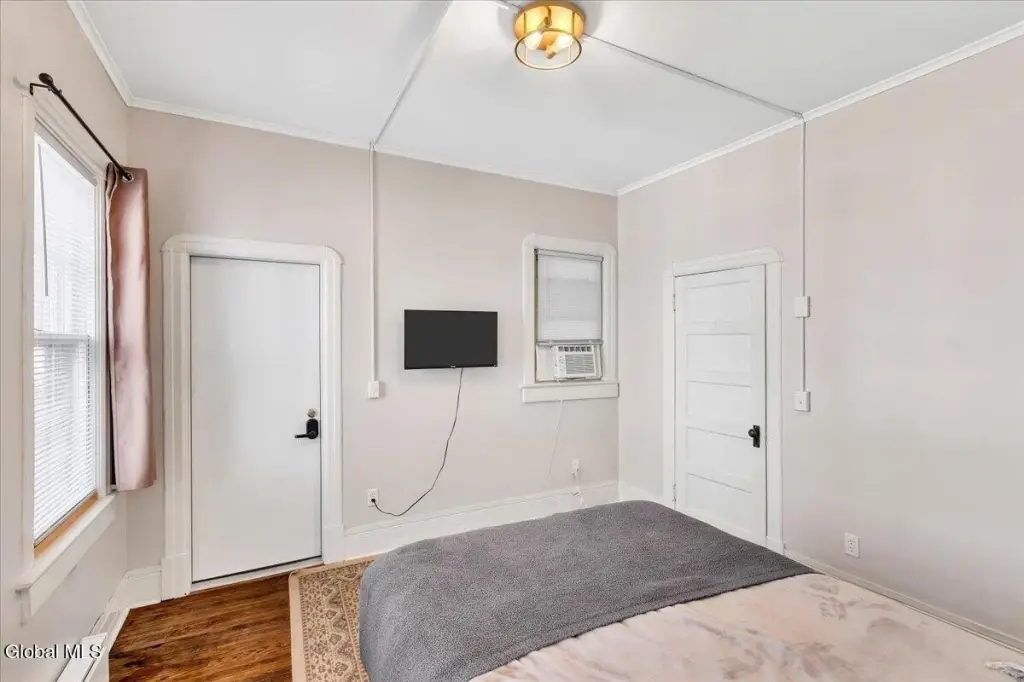
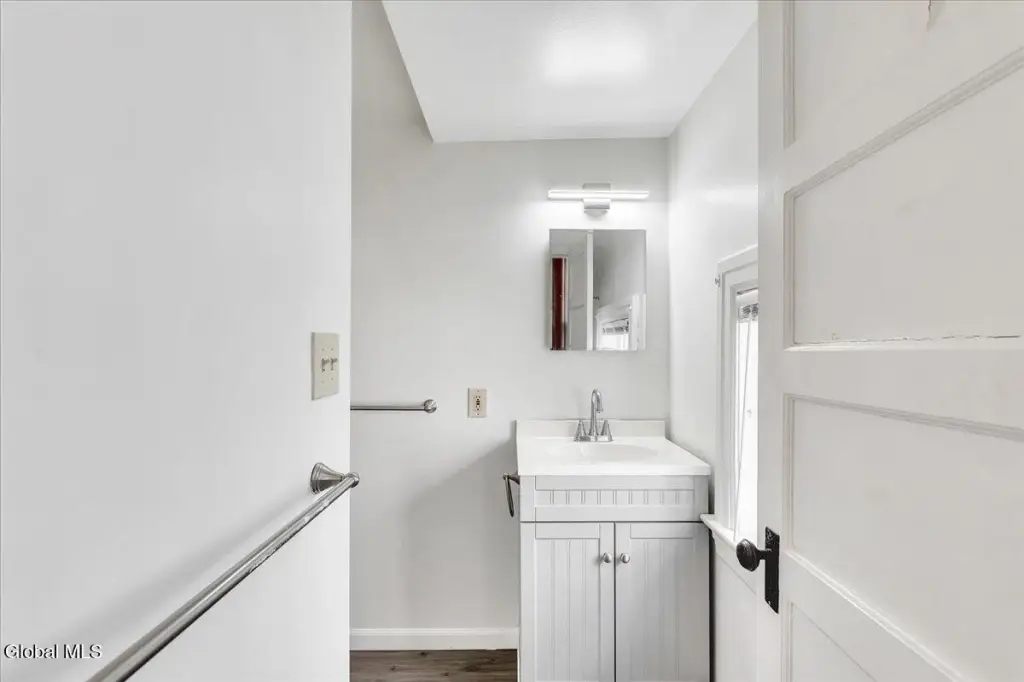
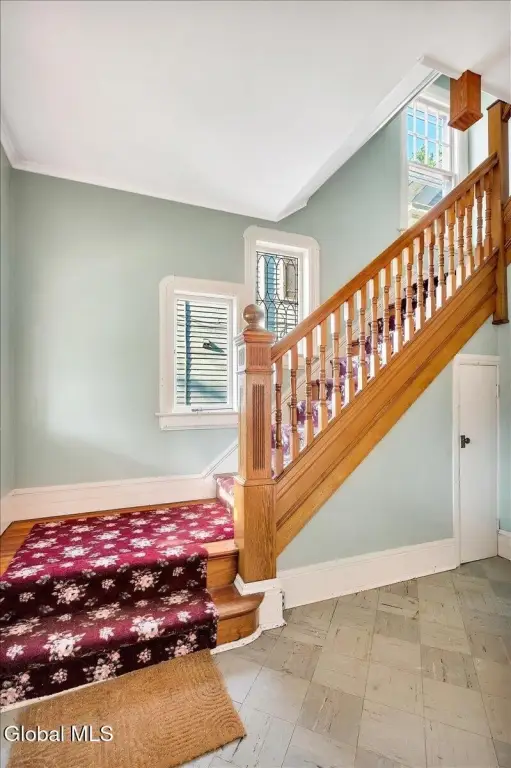
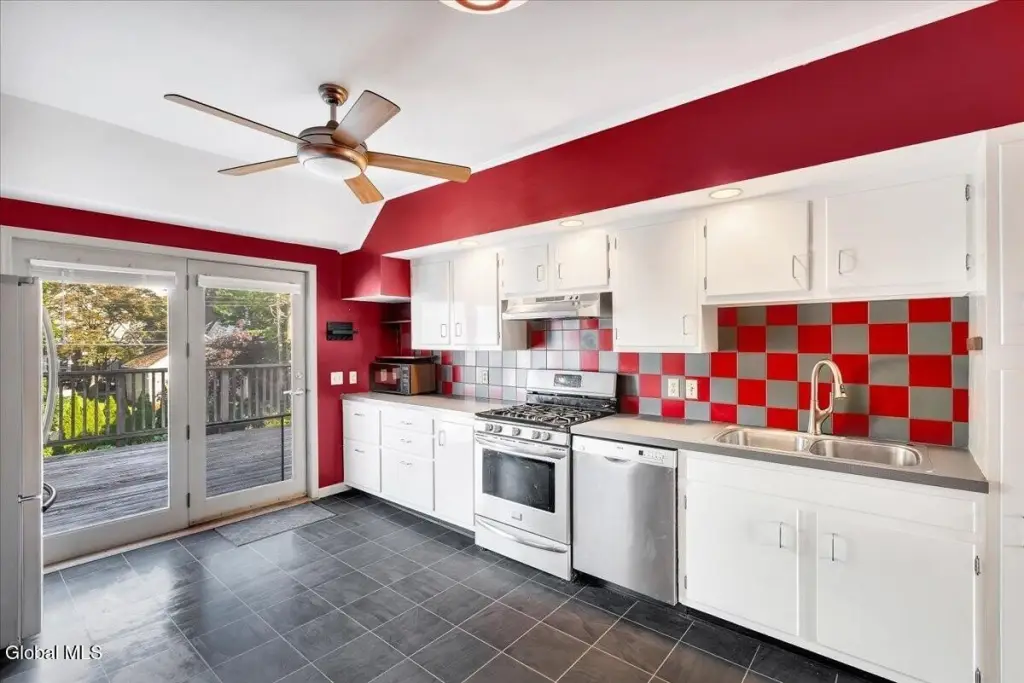
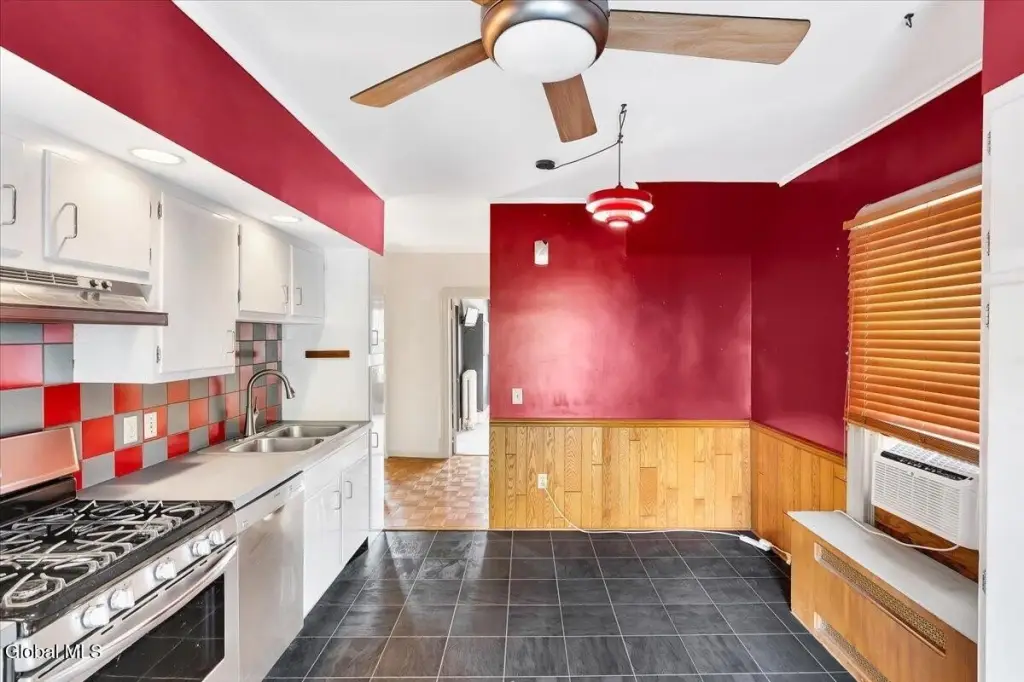
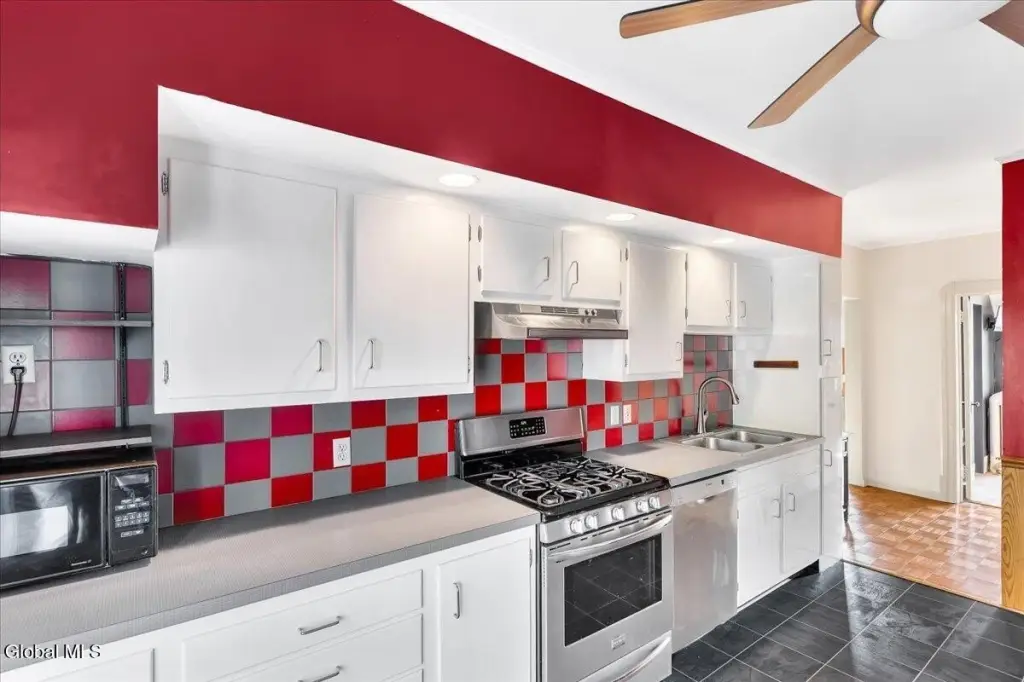
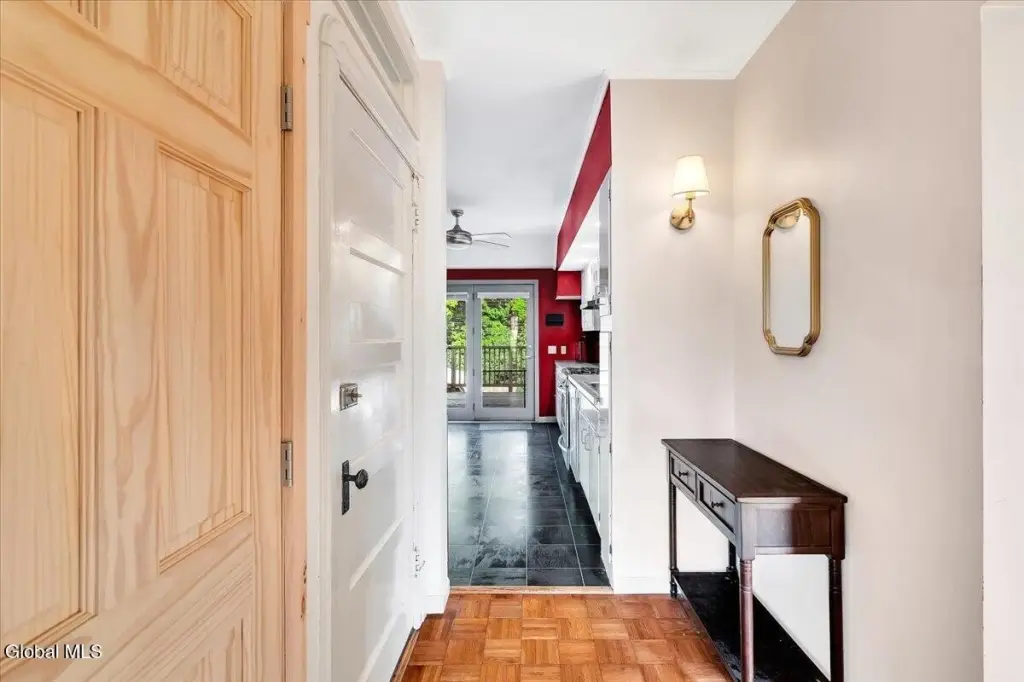
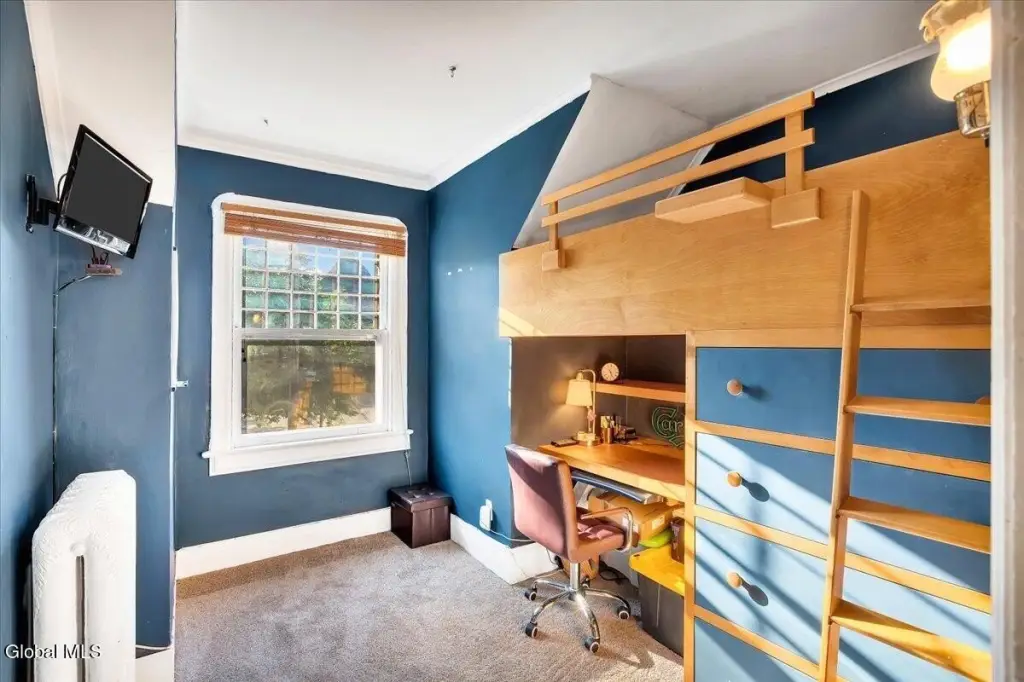
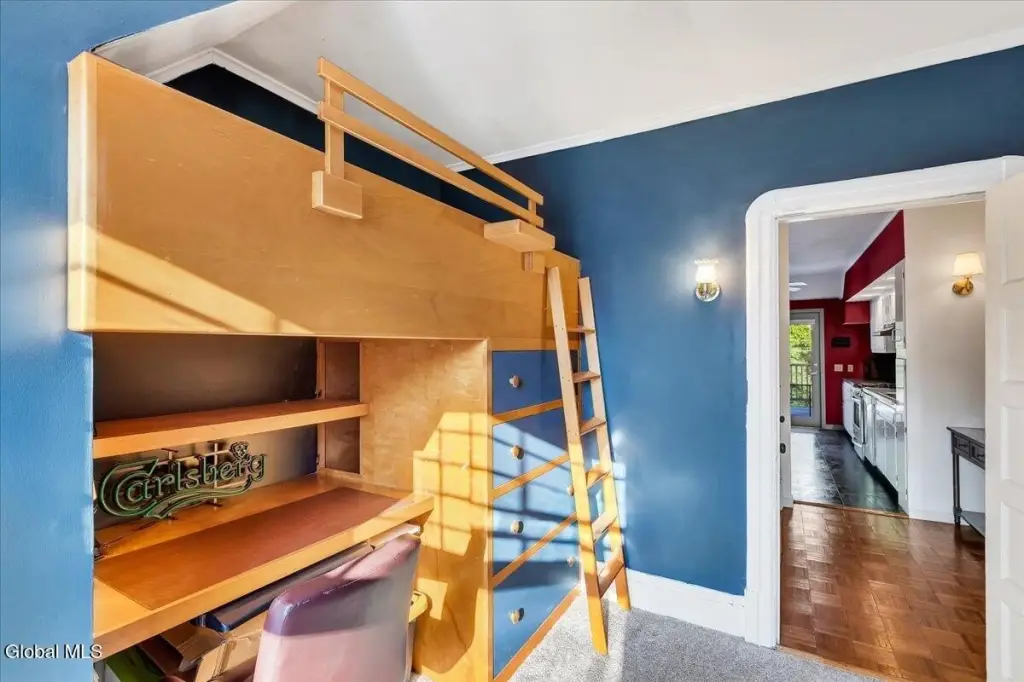
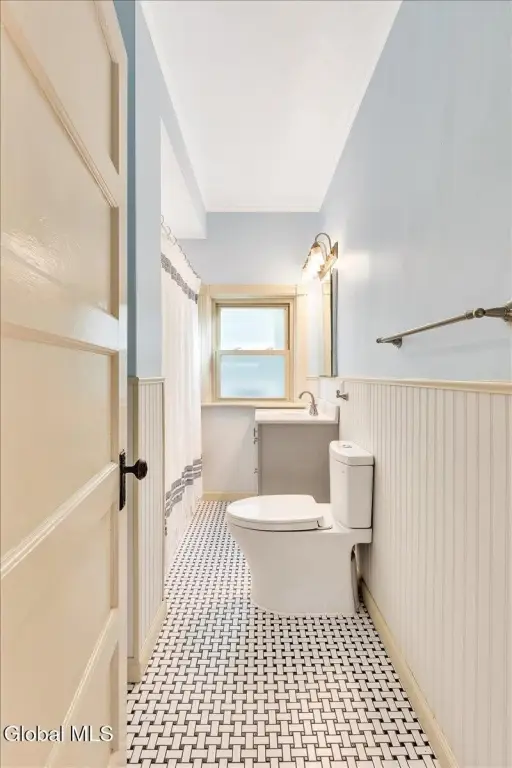
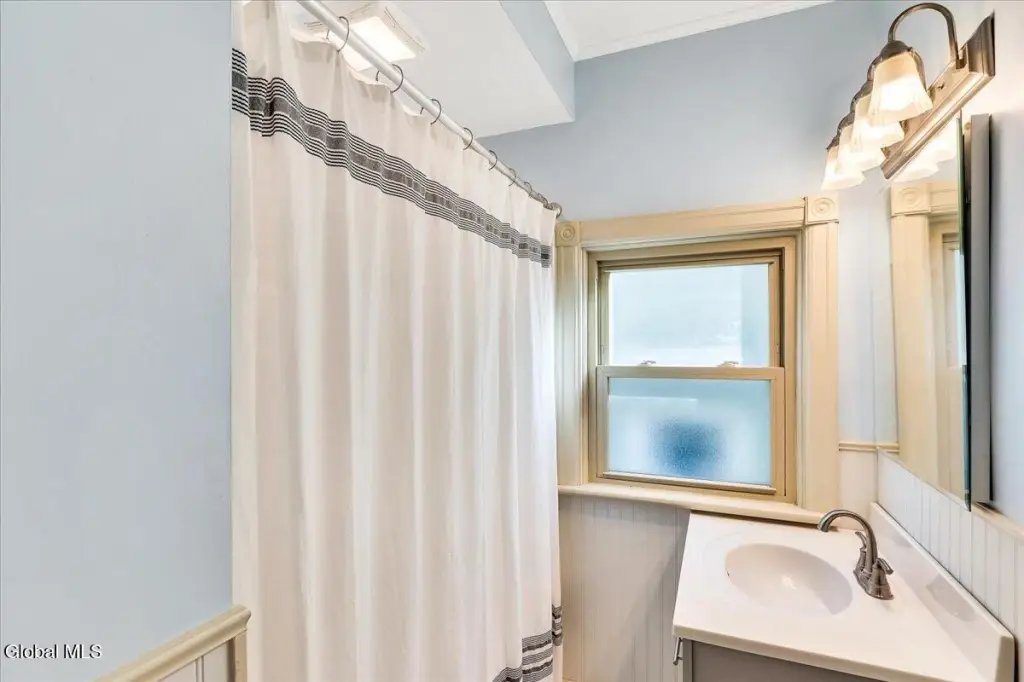
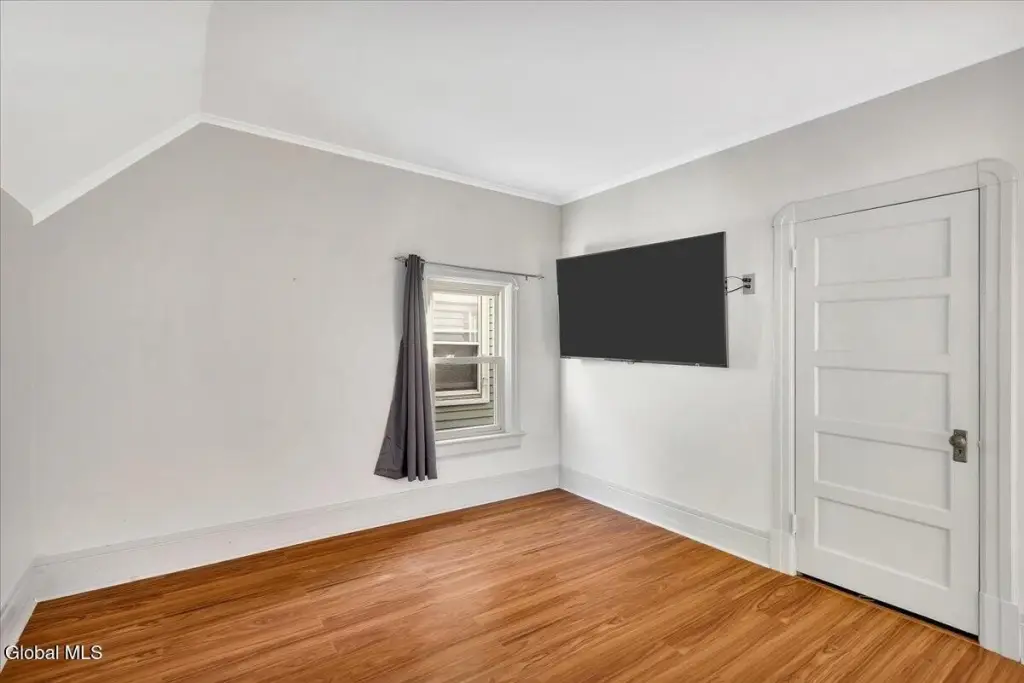
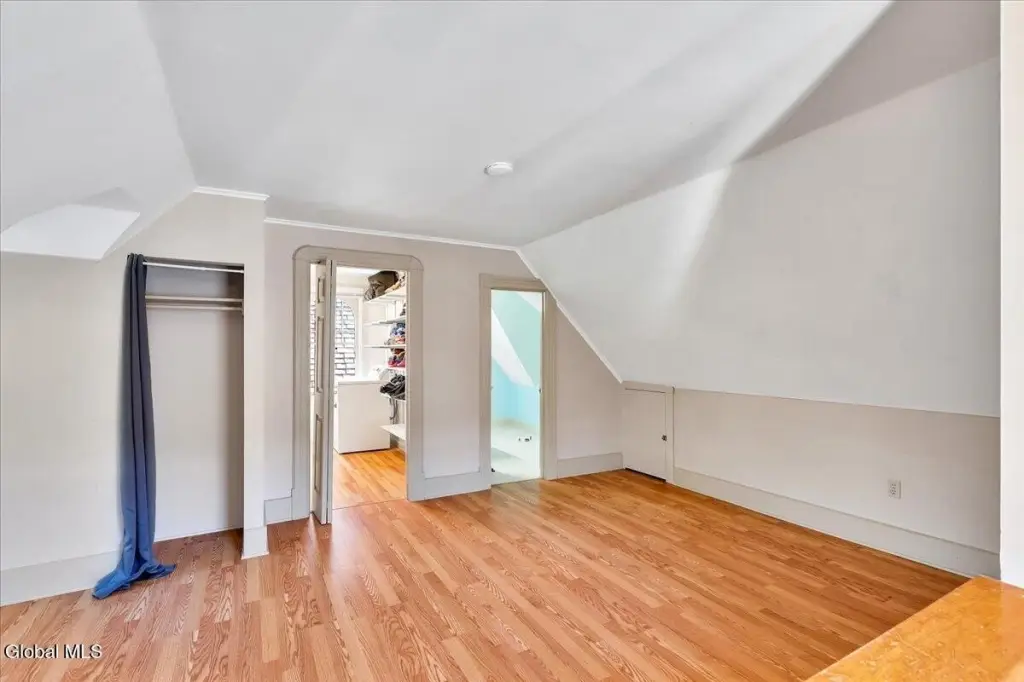
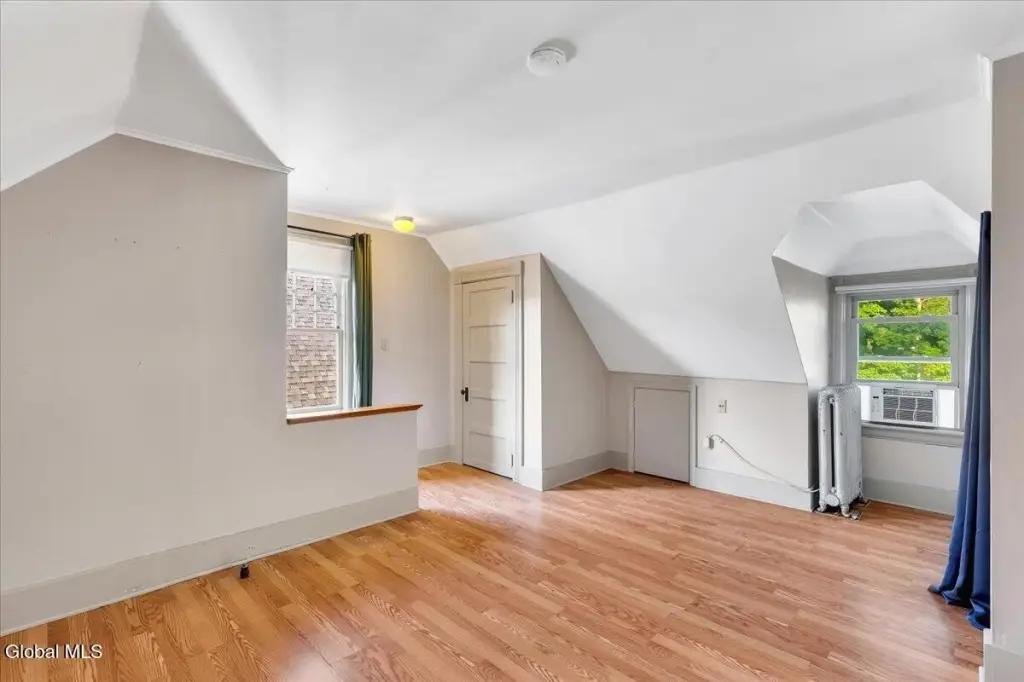
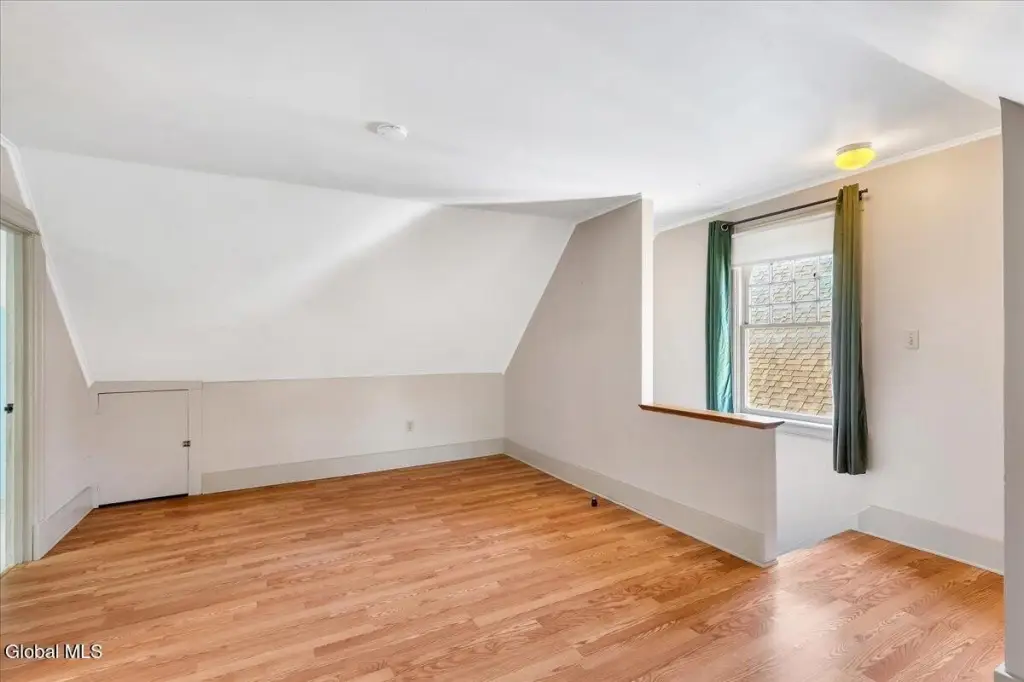
This 1896 Victorian-style duplex contains two residences across three levels and offers 2139 square feet on a 0.1-acre lot. Original wood detailing remains throughout, complemented by newer plumbing, electrical improvements, and renovated bathrooms. Each unit includes its own washer and dryer and separately metered utilities. Hardwood, vinyl, laminate, and ceramic tile flooring are found throughout the property.
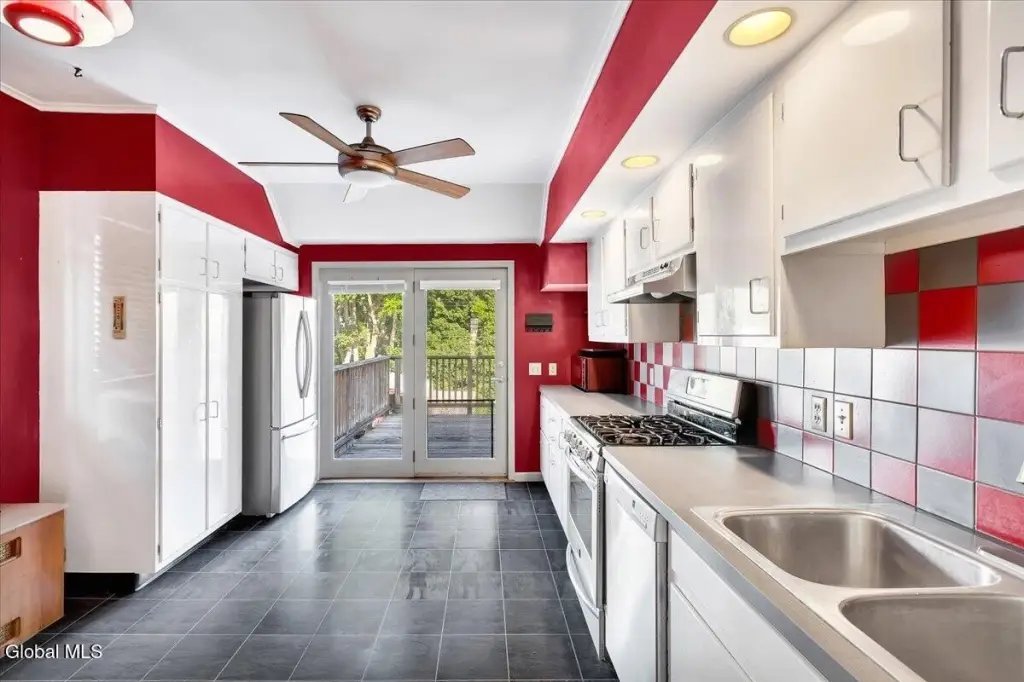
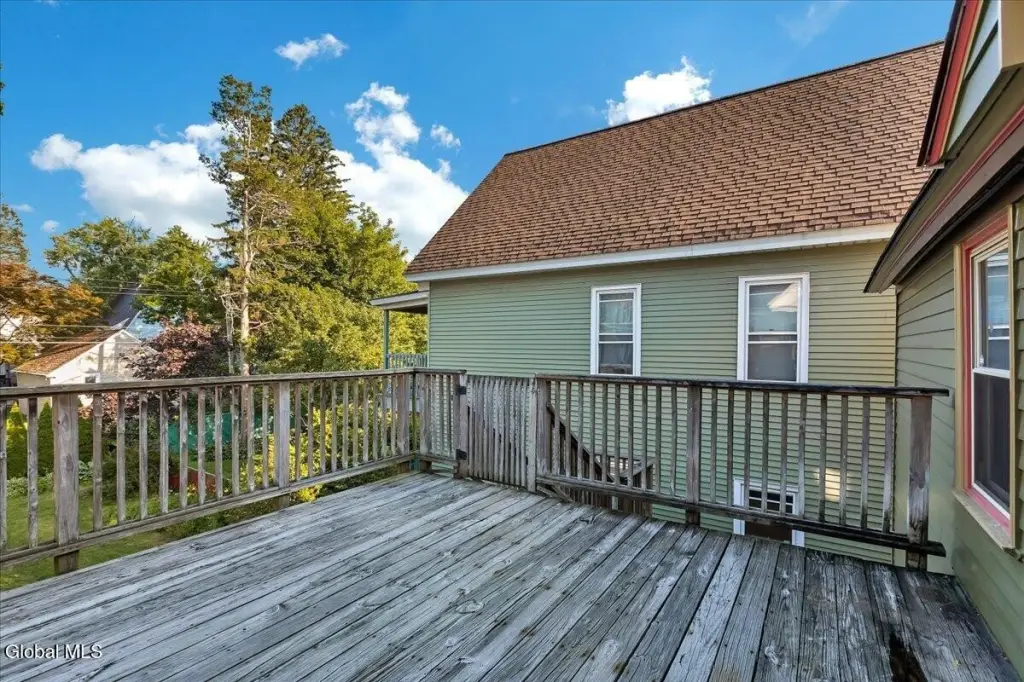
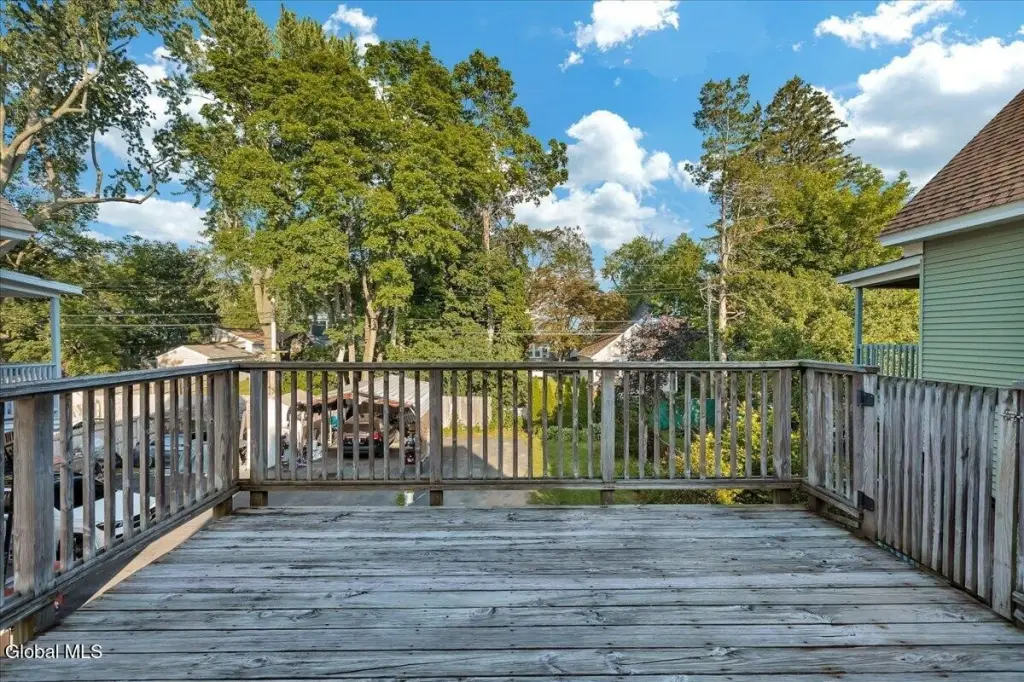
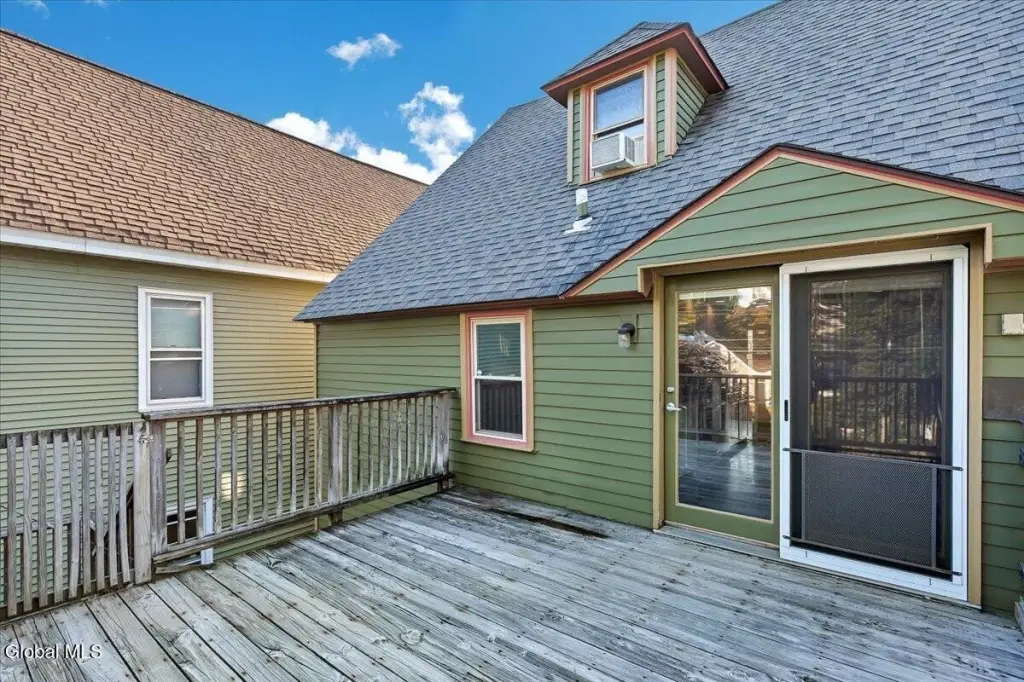
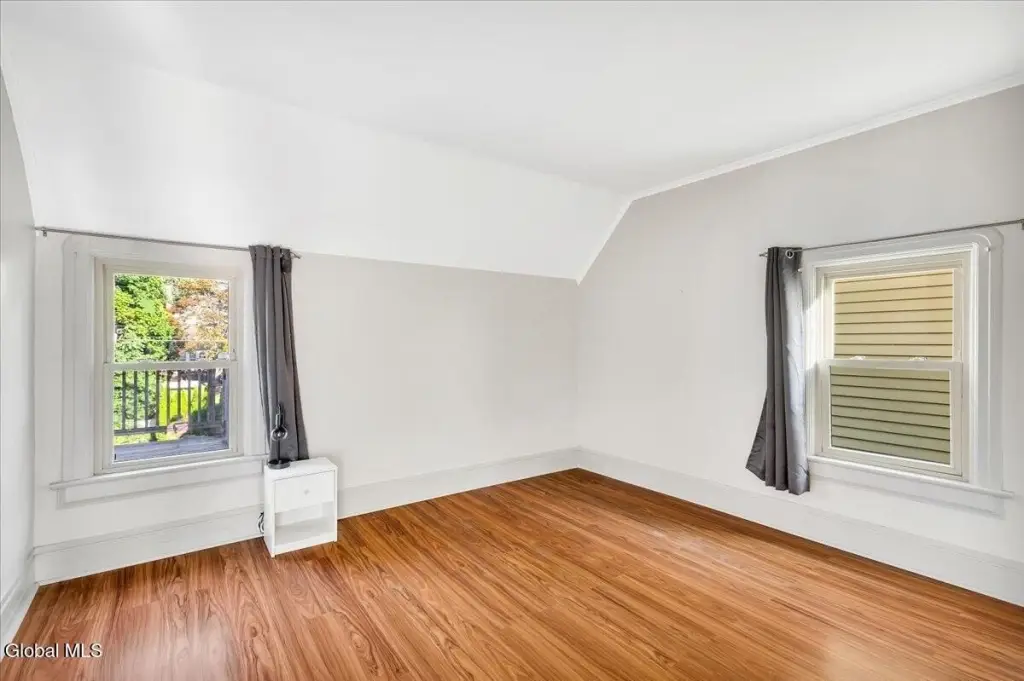
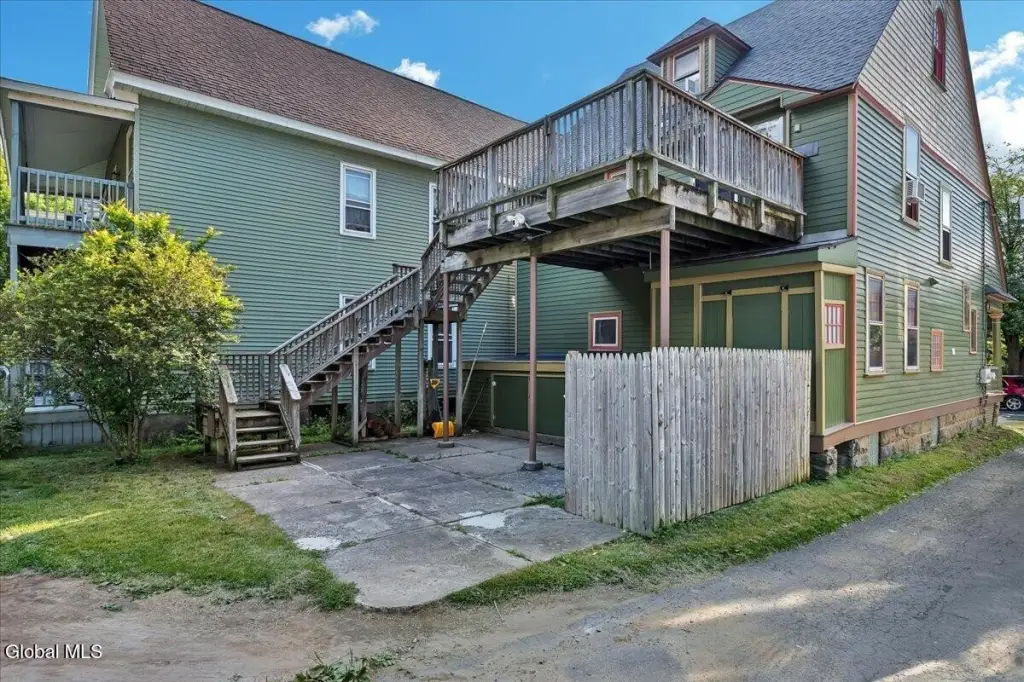
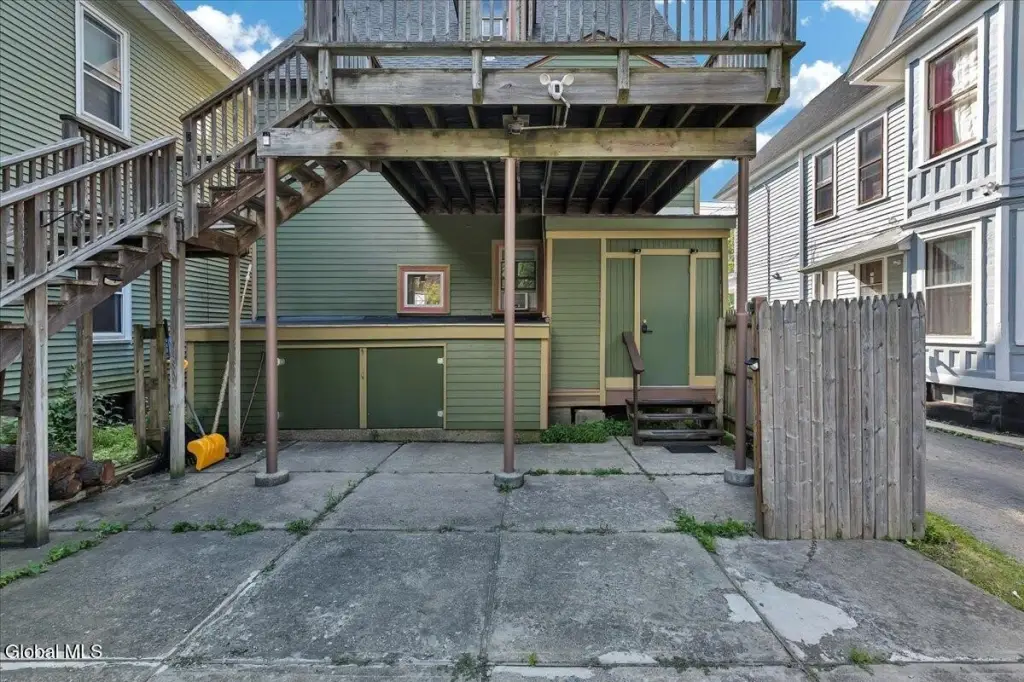
A second-floor deck extends toward the backyard, while a porch, walkout basement, and additional storage provide useful outdoor and service space. The property includes driveway and off-street parking, public water and sewer, natural-gas heating, and window-unit cooling. Its Schenectady setting places it near Union Street, Union College, parks, restaurants, shopping, and Ellis Hospital.
A second-floor deck extends toward the backyard, while a porch, walkout basement, and additional storage provide useful outdoor and service space. The property includes driveway and off-street parking, public water and sewer, natural-gas heating, and window-unit cooling. Its Schenectady setting places it near Union Street, Union College, parks, restaurants, shopping, and Ellis Hospital.
Key Highlights
- Two‑family duplex spanning three levels with 2139 square feet
- 1896 Victorian‑style property with original woodwork and craftsmanship
- Each unit has a washer, dryer, and separate utilities
Financial Insights
Estimated NOI and Cap Rate
NOI / Yr
$24,360
Cap Rate
7.50%
Suggested Prices Based on Cap Rates
Cap Rate 5%
$487,200
$487.2K
Cap Rate 7%
$348,000
$348.0K
Cap Rate 9%
$270,667
$270.7K
Market Conditions
NOI Build-Up for 2,139 SF
Gross rent
$37.2K $17.40/SF
− Vacancy
−$2.4K −$1.13/SF
EGI
$34.8K $16.27/SF
− OpEx
−$10.4K −$4.88/SF
NOI
$24.4K $11.39/SF
Area
Schenectady County, NY
Vacancy
6.50%
Lease Rate
$17.40 /SF/Yr
Expense Ratio
30.00%
Simulate Cap Rate and NOI
Suggested Prices Based on Cap Rates
Cap Rate 5%
$487,200
Cap Rate 7%
$348,000
Cap Rate 9%
$270,667
Alternative Uses
Best Use
Multifamily LT 5
$348.0K
$304.5K – $406.0K
NOI $24,360 @ 7.0% cap · market cap 7.50%
Second Best
Apartment 5plus
$312.1K
$273.1K – $364.2K
NOI $21,849 @ 7.0% cap · market cap 6.72%
Theoretical Best
Office A
$640.2K
$560.2K – $746.9K
NOI $44,816 @ 7.0% cap · market cap 13.79%
Zoning and permitted uses should be independently verified with authorities.
How Realmo checks its estimates
Property Analytics
Unlock full access to Insights
Subscribe to Realmo Intelligence
Open Analytics
Current Use
Lease Details
2
Residential units
Location Intelligence
Trade Area within ½ mile
1,216
Businesses Nearby
Explore this area
Business Placement
Demographics for 12308, NY
15,285
Population
6,442
Households
2.4
Avg Household Size
31
Median Age
29%
College-Educated
89%
High-School Grad
2.3 sq mi
ZIP Area
6,646
Density / Sq Mi
$59,789
Median Household Income
$35,966
Median Earnings
$1,159
Median Rent
$180,100
Median Home Value
Check the figures for this property
Cap Rate, Value Estimation, Potential NOI and more
View Realmo Analytics
Market
Vacancy Rate% for Multifamily in Northeast region

Questions? Ask Rey
Realmo’s AI knows this listing — price, zoning, demand, history. Ask anything.





Frequently Asked Questions
What type of property is this?
Duplex - Updated two-family property with separate utilities, in-unit laundry, and a second-floor deck overlooking the backyard.
Where is this duplex located?
The property is located at 1056 Wendell Avenue Schenectady, NY.
What is the asking price?
The asking price for this property is $325,000.
What are key features of this property?
This property features: Two‑family duplex spanning three levels with 2139 square feet; 1896 Victorian‑style property with original woodwork and craftsmanship; Each unit has a washer, dryer, and separate utilities


