Upgraded Office Building Near
For Sale
$11,739,360
10542 S Jordan Gateway, South Jordan, UT 84095
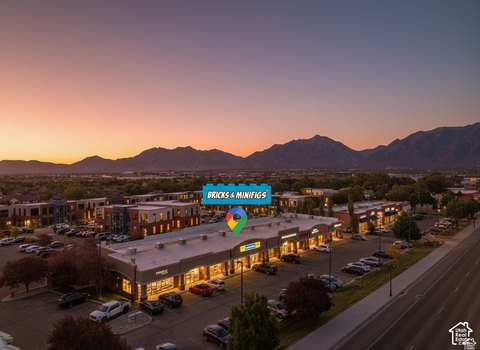
Renovated office building near I-15 and FrontRunner station.
Property Size48,914 SF
Price / SF$240
Days on Market194
Property Features for 10542 S Jordan Gateway
General Information
Standard status
Active
Size
48,914 SF
Property subtype
Office - General Office
Building Details
Building Size
48,914 SF
Listing Agency:
Colliers
Listed By:
Brandon D. Fugal · License #5477023-SA00
(801) 947-8300
Source:
Commercialcafe
Added: Mar 27
Changed: Oct 4
Last Checked: Oct 5 at 3:36PM
Displayed information is deemed reliable but is not guaranteed and should be independently verified. All listing content including descriptions, pricing, images are the copyrighted material of Colliers
Investment Insights
Based on property information with market context.
The property is a renovated office building located off I-15 in South Jordan, Utah. Originally constructed in 2000, it underwent a major renovation completed in 2024. The three-story, steel-framed building has a total of 48,914 square feet. It is strategically located just off the 10600 S exit off Interstate 15 and is within a three-minute walk to FrontRunner (Mass Transit High-Speed Commuter Rail). The remodel included a full update to the common area and building exterior. The landlord recently completed two new modern suites on a speculative basis to most effectively position to two vacancies, which could be occupied by an owner-user. The building currently has a diverse tenant roster, with staggered lease terms. The building is an attractive option for an owner-user or a strategic investor seeking long-term upside with Utah’s economy.
Key Highlights
- Dramatically upgraded office building (major renovation completed in 2024).
- Located off I‑15 with immediate access to 10600 S exit.
- Three‑minute walk to FrontRunner (Mass Transit High Speed Commuter Rail).
Financial Insights
Estimated NOI and Cap Rate
NOI / Yr
$709,204
Cap Rate
6.04%
Suggested Prices Based on Cap Rates
Cap Rate 5%
$14,184,080
$14.2M
Cap Rate 7%
$10,131,486
$10.1M
Cap Rate 9%
$7,880,044
$7.9M
Market Conditions
NOI Build-Up for 48,914 SF
Gross rent
$1.05M $21.48/SF
− Vacancy
−$105.1K −$2.15/SF
EGI
$945.6K $19.33/SF
− OpEx
−$236.4K −$4.83/SF
NOI
$709.2K $14.50/SF
Area
Salt Lake County, UT
Vacancy
10.00%
Lease Rate
$21.48 /SF/Yr
Expense Ratio
25.00%
Simulate Cap Rate and NOI
Suggested Prices Based on Cap Rates
Cap Rate 5%
$14,184,080
Cap Rate 7%
$10,131,486
Cap Rate 9%
$7,880,044
Alternative Uses
Best Use
Office B
$10.13M
$8.87M – $11.82M
NOI $709,204 @ 7.0% cap · market cap 6.04%
Second Best
—
—
no second resolved use
Theoretical Best
Multifamily LT 5
$651.31M
$569.89M – $759.86M
NOI $45,591,555 @ 7.0% cap · market cap 388.36%
Zoning and permitted uses should be independently verified with authorities.
Property Analytics
Unlock full access to Insights
Subscribe to Realmo Intelligence
Open Analytics
Current Use
Location Intelligence
Trade Area within ½ mile
1,463
Businesses Nearby
Explore this area
Business Placement
Demographics for 84095, UT
39,278
Population
13,518
Households
2.9
Avg Household Size
35
Median Age
46%
College-Educated
97%
High-School Grad
11.5 sq mi
ZIP Area
3,415
Density / Sq Mi
$123,082
Median Household Income
$57,833
Median Earnings
$1,794
Median Rent
$669,600
Median Home Value
Check the figures for this property
Cap Rate, Value Estimation, Potential NOI and more
View Realmo Analytics
Market
Vacancy Rate% for Office in West region

Questions? Ask Rey
Realmo’s AI knows this listing — price, zoning, demand, history. Ask anything.




Frequently Asked Questions
What type of property is this?
Office building - Renovated office building near I-15 and FrontRunner station.
Where is this office building located?
The property is located at 10542 S Jordan Gateway South Jordan, UT.
What is the asking price?
The asking price for this property is $11,739,360.
What are key features of this property?
This property features: Dramatically upgraded office building (major renovation completed in 2024).; Located off I‑15 with immediate access to 10600 S exit.; Three‑minute walk to FrontRunner (Mass Transit High Speed Commuter Rail).



