Four-Bay Automotive Repair
For Sale
Contact for pricing
1049 DEWEY AVE, Rochester, NY 14613
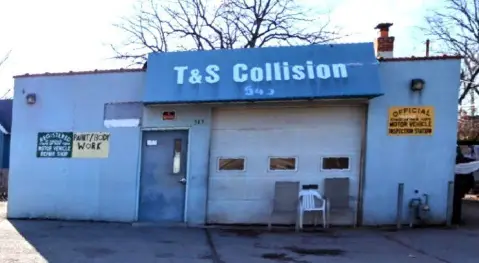
Operating repair shop with lifts, overhead doors, and truck-capable ceiling height.
Property Size2,576 SF
Price / SF$135.87
Days on Market102
Property Features for 1049 DEWEY AVE
General Information
Standard status
Active
Size
2,576 SF
Total Parking Spaces
30
Property subtype
Retail
Zoning
Urban Renewal District
Site & Location
Traffic Count
14,000 vehicles/day
Utilities to Site
Yes
Additional Details
Business Included
Yes
Service Bays
4
Amenities
overhead gas-fired radiant heat
recycled oil burner
single-phase electric
14-foot ceilings
Building Details
Year Built
1940
Year Renovated
1990
Buildings
1
Units
1
Abandoned
No
Listing Agency:
Hanna Commercial Real Estate Cleveland
Listed By:
Paul Schiliro · License #NY 40SC0913944
(585) 756-7310
Source:
Crexi
Added: Jul 8
Changed: Oct 8
Last Checked: Oct 16 at 8:43AM
Displayed information is deemed reliable but is not guaranteed and should be independently verified. All listing content including descriptions, pricing, images are the copyrighted material of Hanna Commercial Real Estate Cleveland

Ask AI about this property
Review the available facts, identify missing information and prepare questions for the agent.
Investment Insights
Based on property information with market context.
The property is a 2,576-square-foot automotive repair facility at 1049 Dewey Ave in Rochester. Built in 1940, it includes the land, building, equipment, four service bays, and four above-ground lifts. Two bays have 10-foot overhead doors, while the remaining two have 12-foot doors. The addition provides 14-foot ceilings for vans and trucks. Heating is provided by overhead gas-fired radiant systems and a 1,500-gallon recycled oil burner. The facility has single-phase electric service and is located within the Urban Renewal District.
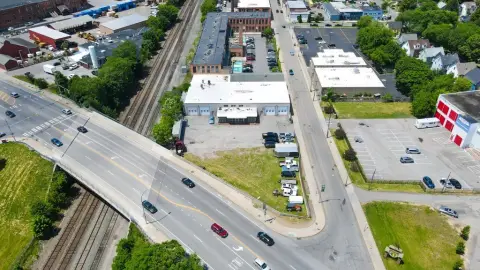
The shop fronts Dewey Ave in Rochester’s Maplewood Neighborhood, with reported exposure to more than 14,000 vehicles per day. The surrounding market includes more than 70,000 people within two miles and approximately 335,000 people within five miles.
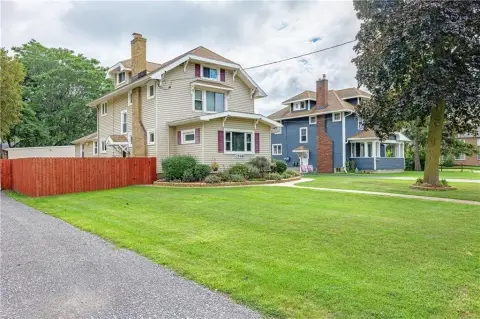
An adjacent single-family residence at 301 Birr Street is also available exclusively to the purchaser of the repair facility. The residence has three bedrooms, a kitchen, dining room, living room, and a 3-car garage.
The shop fronts Dewey Ave in Rochester’s Maplewood Neighborhood, with reported exposure to more than 14,000 vehicles per day. The surrounding market includes more than 70,000 people within two miles and approximately 335,000 people within five miles.
An adjacent single-family residence at 301 Birr Street is also available exclusively to the purchaser of the repair facility. The residence has three bedrooms, a kitchen, dining room, living room, and a 3-car garage.
Key Highlights
- 2,576‑square‑foot automotive repair facility built in 1940
- Four service bays with two 10‑foot and two 12‑foot overhead doors
- Four above‑ground lifts: two 10,000 lb., one 12,000 lb., and one 9,000 lb.
Financial Insights
Estimated NOI and Cap Rate
NOI / Yr
$26,273
Cap Rate
7.51%
Suggested Prices Based on Cap Rates
Cap Rate 5%
$525,460
$525.5K
Cap Rate 7%
$375,329
$375.3K
Cap Rate 9%
$291,922
$291.9K
Market Conditions
NOI Build-Up for 2,576 SF
Gross rent
$40.2K $15.60/SF
− Vacancy
−$2.7K −$1.03/SF
EGI
$37.5K $14.57/SF
− OpEx
−$11.3K −$4.37/SF
NOI
$26.3K $10.20/SF
Area
Rochester, NY
Vacancy
6.60%
Lease Rate
$15.60 /SF/Yr
Expense Ratio
30.00%
Simulate Cap Rate and NOI
Suggested Prices Based on Cap Rates
Cap Rate 5%
$525,460
Cap Rate 7%
$375,329
Cap Rate 9%
$291,922
Alternative Uses
Best Use
Retail
$499.1K
$436.7K – $582.3K
NOI $34,937 @ 7.0% cap · market cap 9.98%
Second Best
Industrial
$375.3K
$328.4K – $437.9K
NOI $26,273 @ 7.0% cap · market cap 7.51%
Theoretical Best
Office A
$705.7K
$617.5K – $823.3K
NOI $49,397 @ 7.0% cap · market cap 14.11%
Zoning and permitted uses should be independently verified with authorities.
How Realmo checks its estimates
Property Analytics
Unlock full access to Insights
Subscribe to Realmo Intelligence
Open Analytics
Current Use
Lease Details
4
Service bays
14,000 VPD
Traffic count
Turnkey business
Opportunity
Yes
Utilities to site
Location Intelligence
Trade Area within ½ mile
481
Businesses Nearby
42k
Monthly Visits Nearby
Balanced
Demand for This Use
Explore this area
Business Placement
Foot Traffic Nearby
Groceries 68%
Shops & Services 26%
Apparel 4%
Dining 2%
Price Rite
Groceries
28,602 visits/mo
0.3 miles
Family Dollar
Shops & Services
8,506 visits/mo
0.5 miles
Sunoco
Shops & Services
2,369 visits/mo
0.4 miles
Rainbow
Apparel
1,775 visits/mo
0.5 miles
Salvatore's Old Fashioned Pizzeria
Dining
909 visits/mo
0.4 miles
Demographics for 14613, NY
14,882
Population
6,561
Households
2.3
Avg Household Size
31
Median Age
14%
College-Educated
77%
High-School Grad
1.9 sq mi
ZIP Area
7,833
Density / Sq Mi
$33,370
Median Household Income
$29,530
Median Earnings
$939
Median Rent
$108,200
Median Home Value
Check the figures for this property
Cap Rate, Value Estimation, Potential NOI and more
View Realmo Analytics
Market
Vacancy Rate% for Retail in Rochester, NY





Similar Off Market Nearby
- Moore's Tire Sales Inc — 185 Norman St, Rochester, NY 14613
- Best Way Automotive — 713 Lake Ave, Rochester, NY 14613
- Messo auto+repair and sales — 656 Lake Ave, Rochester, NY 14613
- Mike's Auto Sales & Service Inc. — 656, 340 Lake Ave, Rochester, NY 14613
- Cheap towing — 602 Driving Park Ave, Rochester, NY 14613
Frequently Asked Questions
What type of property is this?
Auto shop - Operating repair shop with lifts, overhead doors, and truck-capable ceiling height.
Where is this auto shop located?
The property is located at 1049 DEWEY AVE Rochester, NY.
What is the asking price?
The asking price for this property is $350,000.
What are key features of this property?
This property features: 2,576‑square‑foot automotive repair facility built in 1940; Four service bays with two 10‑foot and two 12‑foot overhead doors; Four above‑ground lifts: two 10,000 lb., one 12,000 lb., and one 9,000 lb.


