Mixed-Use Property with Two
For Sale
$695,000
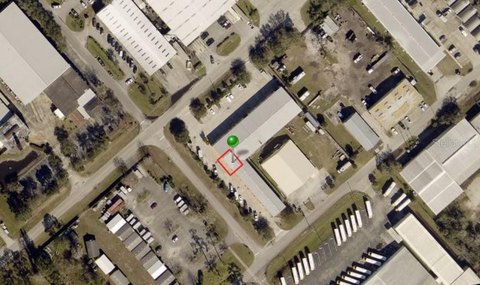
1030 CAMPHOR, Deland, FL 32720
Two-building property combines adaptable commercial space with an adjacent residential component.
Property Size3,430 SF
Days on Market47
Property Features for 1030 CAMPHOR
General Information
Standard status
Active
Size
3,430 SF
Property subtype
Commercial
Taxes and HOA fees
Annual Taxes
$4,529
Building Details
Building Size
3,430 SF
Year Built
1948
Listing Agency:
Glory International Real Estat
Listed By:
Louis Castriota · License #349095
(386) 469-9036
Source:
Elliman
Added: Sep 10
Changed: Oct 12
Last Checked: Oct 24 at 5:28PM
Displayed information is deemed reliable but is not guaranteed and should be independently verified. All listing content including descriptions, pricing, images are the copyrighted material of Glory International Real Estat

Ask AI about this property
Review the available facts, identify missing information and prepare questions for the agent.
Investment Insights
Based on property information with market context.
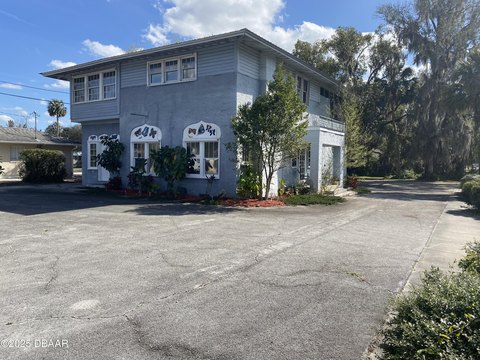
This mixed-use property on approximately 0.65 acre includes a 2,400-square-foot heated and cooled commercial building plus a separate block residence. The commercial structure is currently occupied by an operating business and includes an open work area, conference room, kitchen, additional rooms, and five to six potential private offices. Recent improvements include exterior wood-rot replacement, fresh paint, new doors and awnings, exterior decking, and refreshed parking lines.
The second building is a two-bedroom, one-bath single-family residence with a screened porch. The buildings can support combined or separate occupancy, including business operations alongside residential use, subject to applicable requirements. The property is located at 1030 Camphor in DeLand, Florida, and was built in 1948. WalkScore is 8 and BikeScore is 43.
The second building is a two-bedroom, one-bath single-family residence with a screened porch. The buildings can support combined or separate occupancy, including business operations alongside residential use, subject to applicable requirements. The property is located at 1030 Camphor in DeLand, Florida, and was built in 1948. WalkScore is 8 and BikeScore is 43.
Key Highlights
- Approximately 0.65‑acre mixed‑use property with two separate buildings
- 2,400 SF heated and cooled commercial building
- Commercial layout includes open area, conference room, kitchen, and 5 to 6 potential offices
Financial Insights
Estimated NOI and Cap Rate
NOI / Yr
$51,399
Cap Rate
7.40%
Suggested Prices Based on Cap Rates
Cap Rate 5%
$1,027,980
$1.0M
Cap Rate 7%
$734,271
$734.3K
Cap Rate 9%
$571,100
$571.1K
Market Conditions
NOI Build-Up for 3,430 SF
Gross rent
$74.1K $21.60/SF
− Vacancy
−$5.6K −$1.62/SF
EGI
$68.5K $19.98/SF
− OpEx
−$17.1K −$5.00/SF
NOI
$51.4K $14.99/SF
Area
Volusia County, FL
Vacancy
7.50%
Lease Rate
$21.60 /SF/Yr
Expense Ratio
25.00%
Simulate Cap Rate and NOI
Suggested Prices Based on Cap Rates
Cap Rate 5%
$1,027,980
Cap Rate 7%
$734,271
Cap Rate 9%
$571,100
Alternative Uses
Best Use
Office B
$734.3K
$642.5K – $856.7K
NOI $51,399 @ 7.0% cap · market cap 7.40%
Second Best
Mixed Use
$605.3K
$529.6K – $706.2K
NOI $42,369 @ 7.0% cap · market cap 6.10%
Theoretical Best
Office A
$1.01M
$884.9K – $1.18M
NOI $70,795 @ 7.0% cap · market cap 10.19%
Zoning and permitted uses should be independently verified with authorities.
How Realmo checks its estimates
Property Analytics
Who owns this building?
See the owner, sales and loan history
Open Analytics
Current Use
Location Intelligence
Trade Area within ½ mile
442
Businesses Nearby
Explore this area
Business Placement
Demographics for 32720, FL
33,568
Population
13,962
Households
2.4
Avg Household Size
45
Median Age
24%
College-Educated
88%
High-School Grad
66.3 sq mi
ZIP Area
506
Density / Sq Mi
$67,512
Median Household Income
$39,159
Median Earnings
$1,177
Median Rent
$280,600
Median Home Value
Check the figures for this property
Cap Rate, Value Estimation, Potential NOI and more
View Realmo Analytics
Market
Vacancy Rate% for Office in South region





Frequently Asked Questions
What type of property is this?
Mixed-use property - Two-building property combines adaptable commercial space with an adjacent residential component.
Where is this mixed-use property located?
The property is located at 1030 CAMPHOR Deland, FL.
What is the asking price?
The asking price for this property is $695,000.
What are key features of this property?
This property features: Approximately 0.65‑acre mixed‑use property with two separate buildings; 2,400 SF heated and cooled commercial building; Commercial layout includes open area, conference room, kitchen, and 5 to 6 potential offices


