Brick Fitness
For Sale
$1,500,000
1030 13th Street E, Tuscaloosa, AL 35404
CommercialSale, Tuscaloosa, AL
Property Size5,200 SF
Lot Size0.69 Acres
Price / SF$288.46
Days on Market358
Property Features for 1030 13th Street E
General Information
Property type
Commercial Sale
Property subtype
Other
Security features
Security
Exterior features
SecurityLighting
Directions
Turn east off McFarland Boulevard onto 13th Street East, property is on 1/4 mile left.
Subdivision
(02) Central Tuscaloosa City
Standard status
Active
APN
30-04-19-3-011-004.000
Size
5,200 SF
Lot size
0.69 Acres
Taxes and HOA fees
Tax Description
Lot 8R Barton Resurvey Of Tuscaloosa Heights
Tax Annual Amount
5623
Legal Description
Lot 8R Barton Resurvey Of Tuscaloosa Heights
Utilities
Heating system
Central, Electric (Heating)
Cooling system
Central Air
Building Details
Year built
2013
Number of units
1
Flooring type
Concrete
Building materials
Brick
Roof type
Metal
Listing Agency:
Keller Williams Tuscaloosa · Keller Williams Realty
(205) 759-3400
Listed By:
Lee Foster · License #118528280
(205) 657-1997
Added: Oct 22, 2025
Changed: Oct 9
Last Checked: Oct 14 at 3:06AM
MLS# 171652
Copyright © 2026 West Alabama Multiple Listing Service. All rights reserved. All information provided by the listing agent/broker is deemed reliable but is not guaranteed and should be independently verified.
Investment Insights
Based on property information with market context.
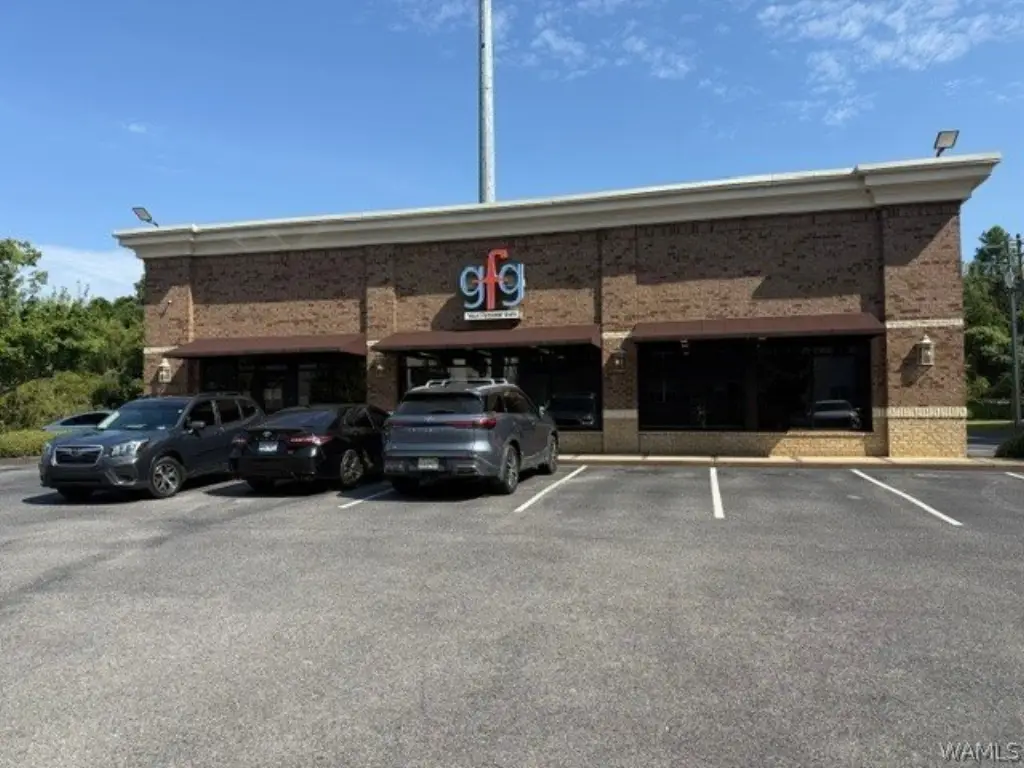
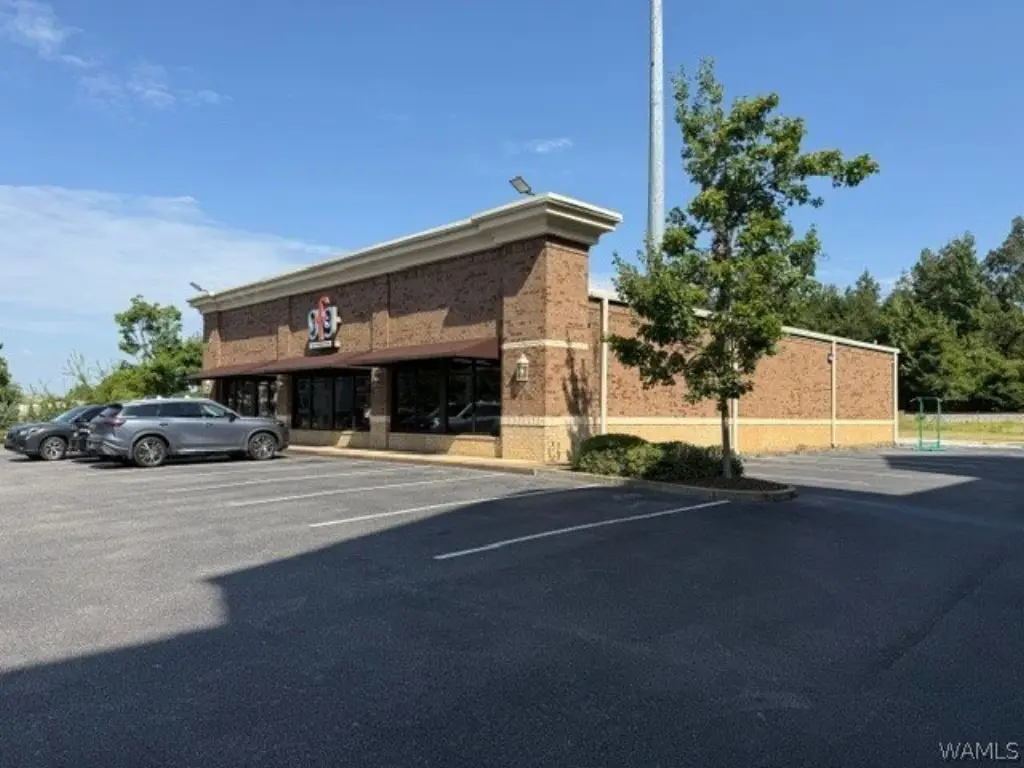
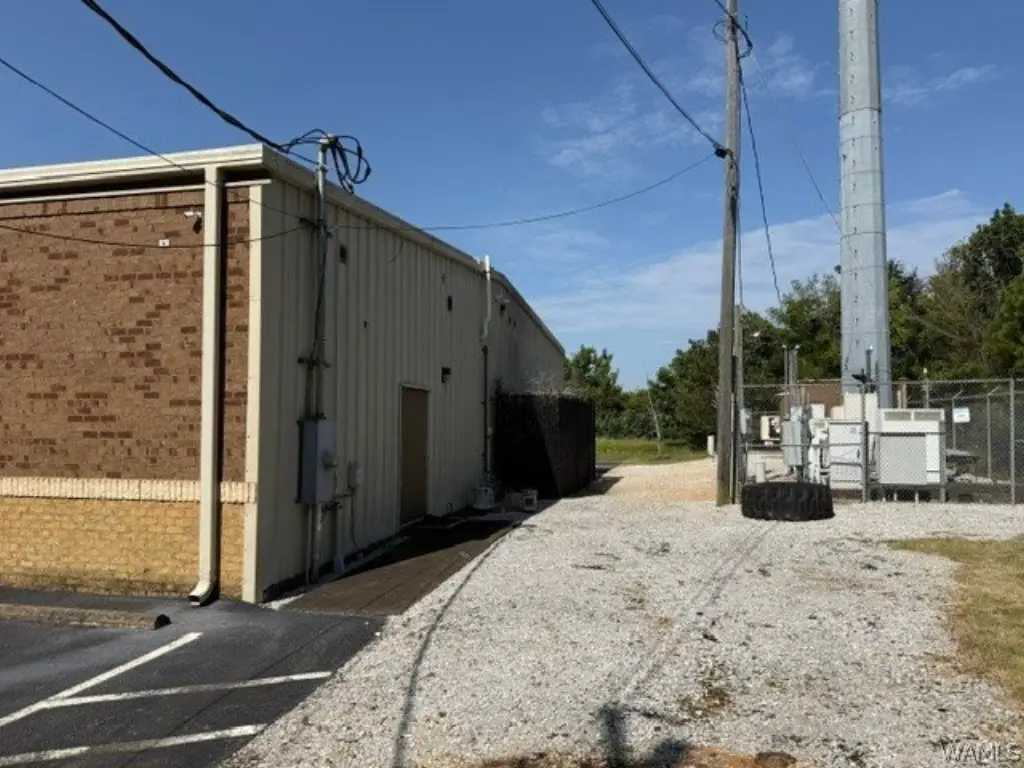
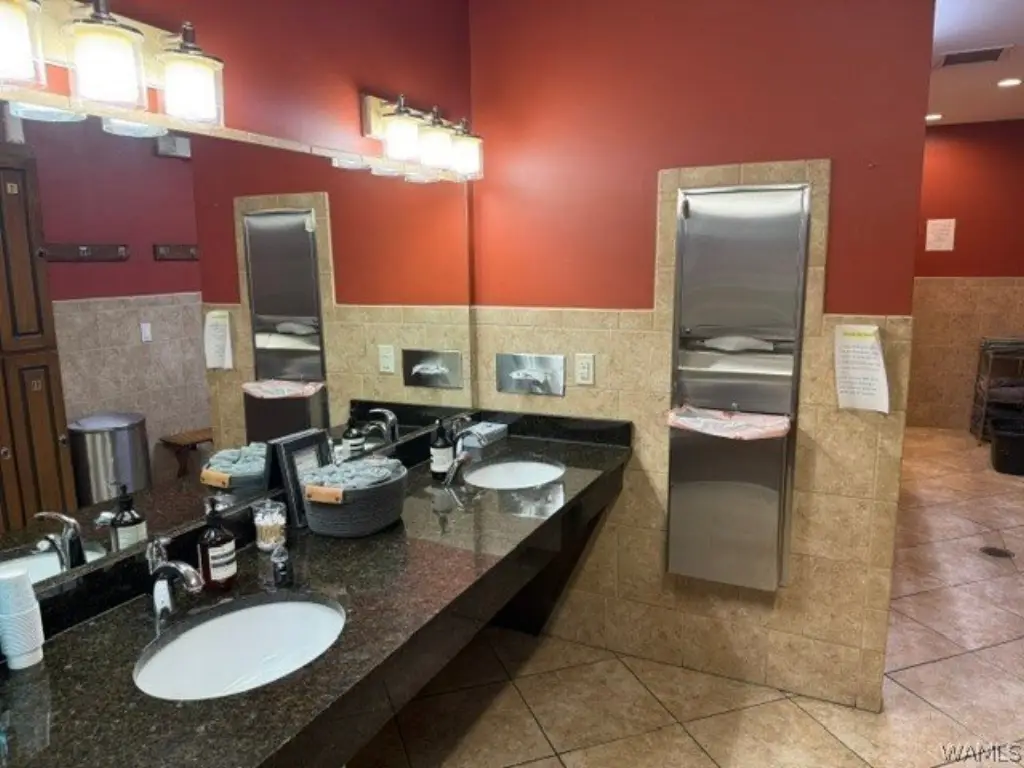
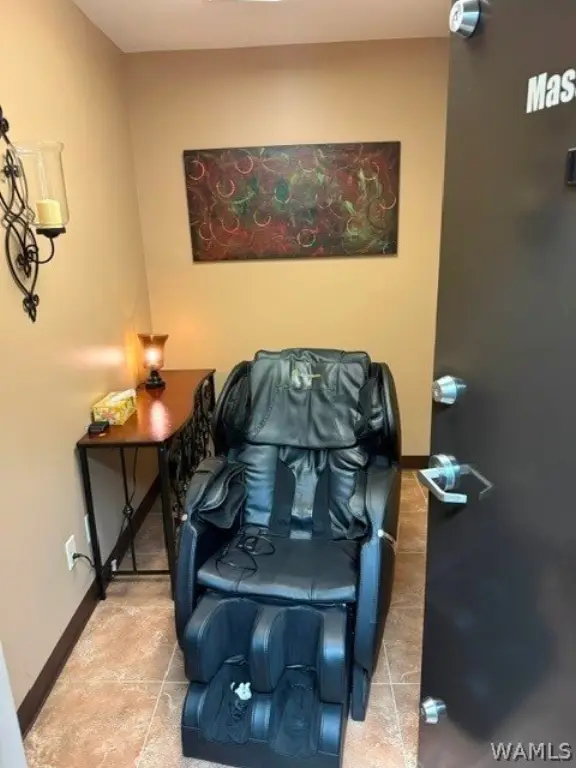
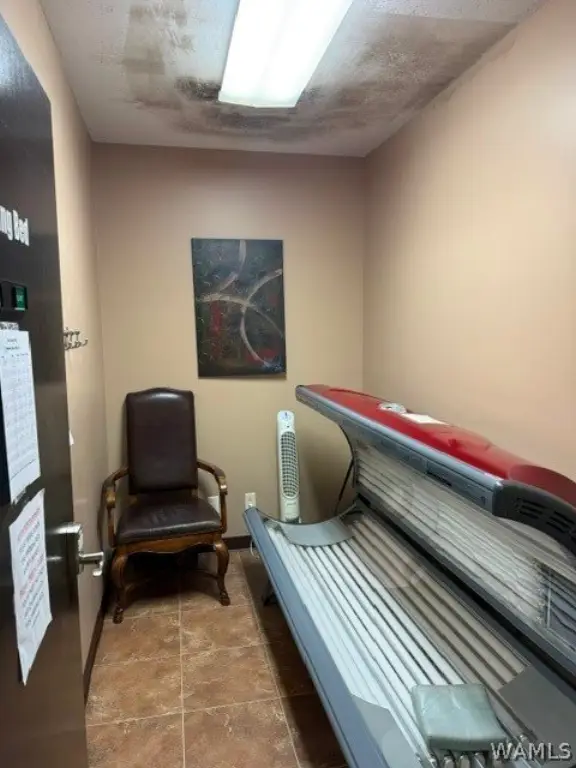
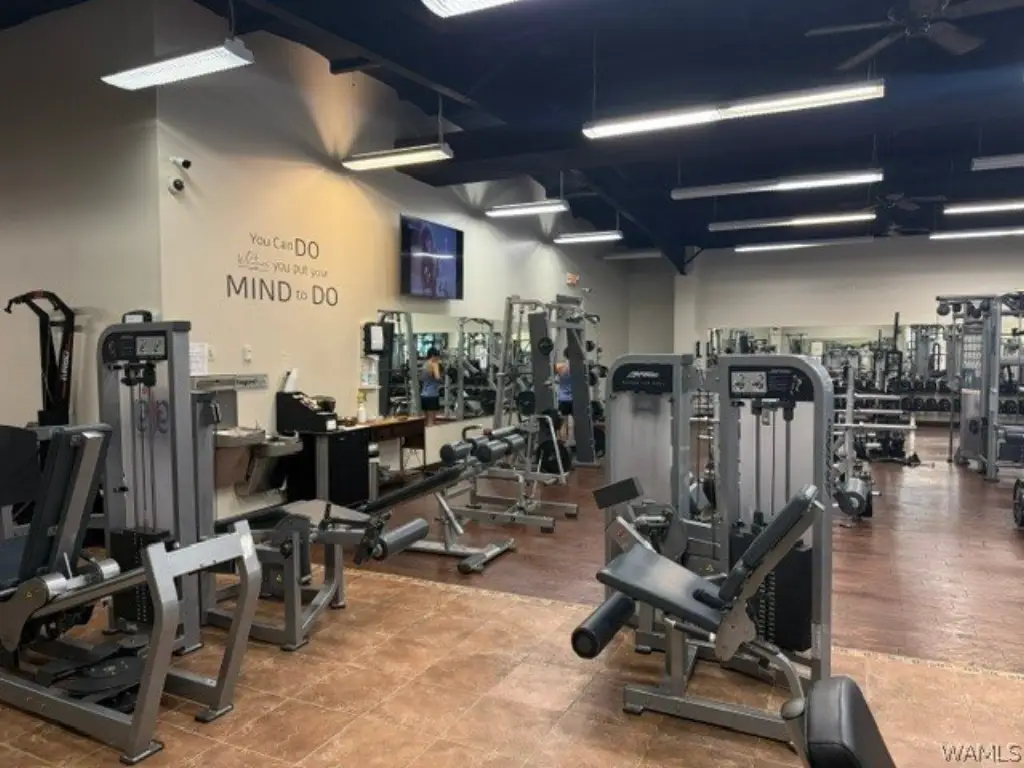
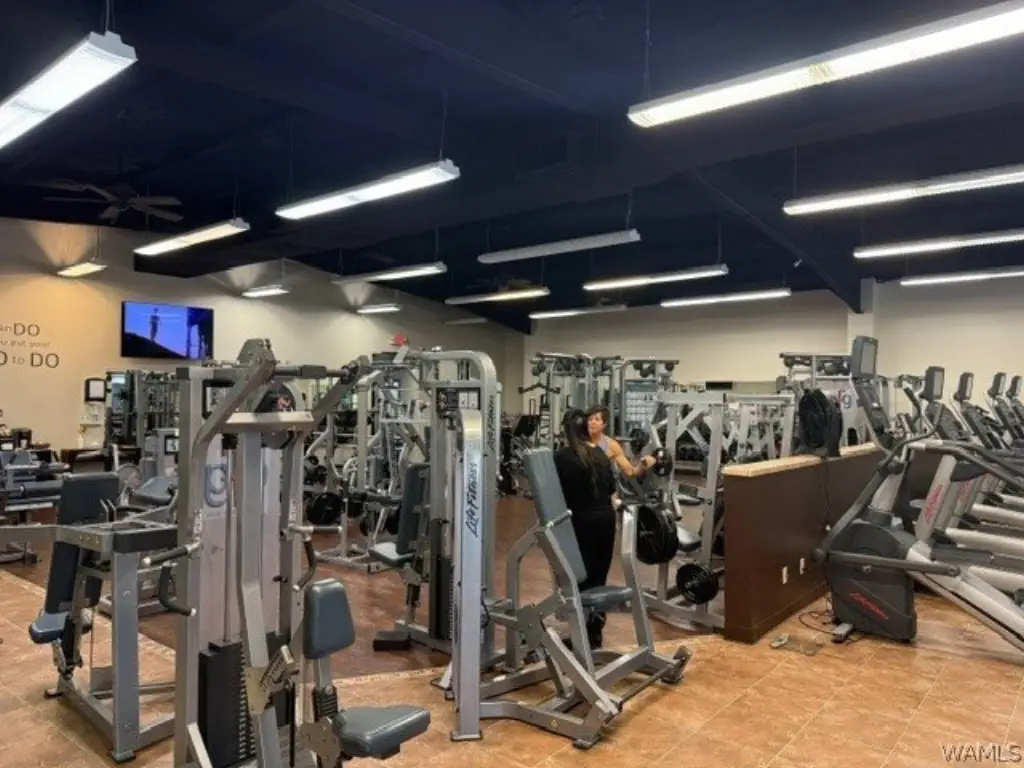
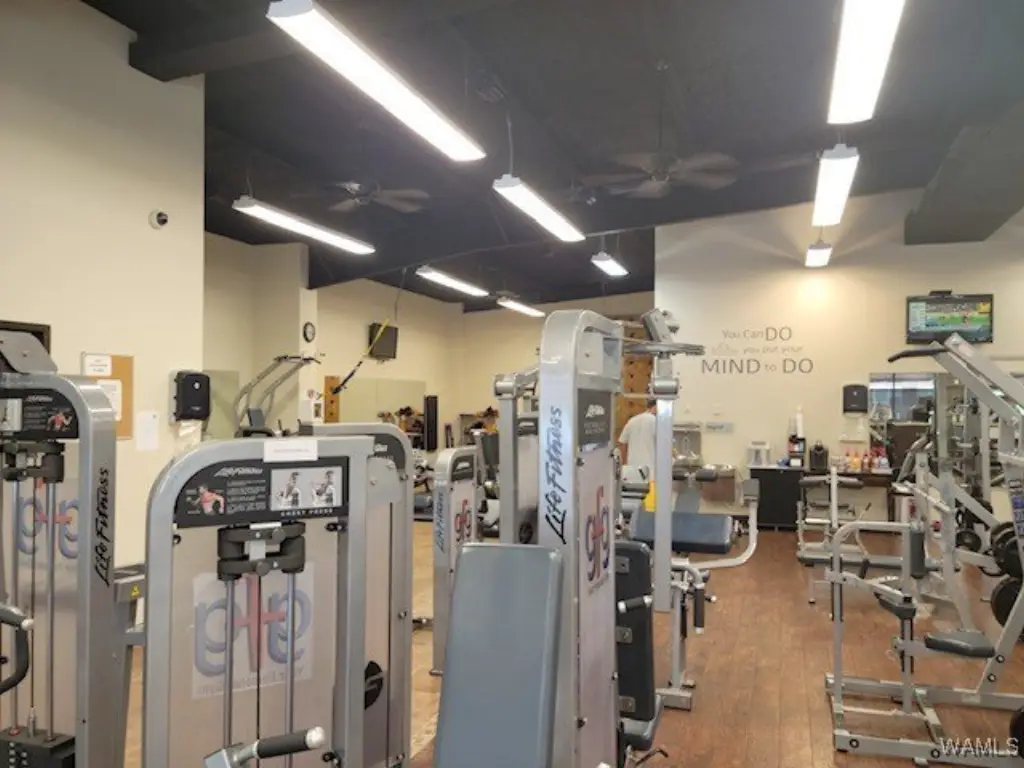
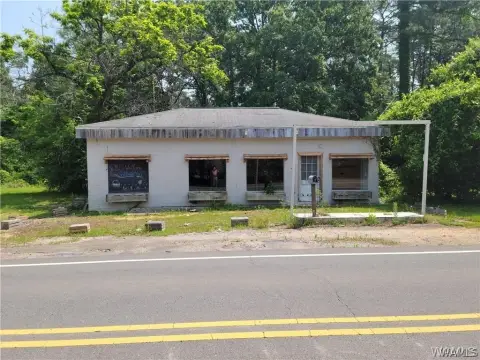
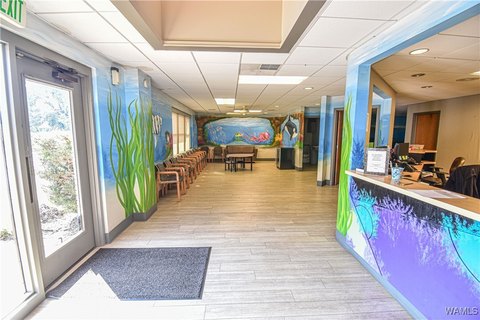
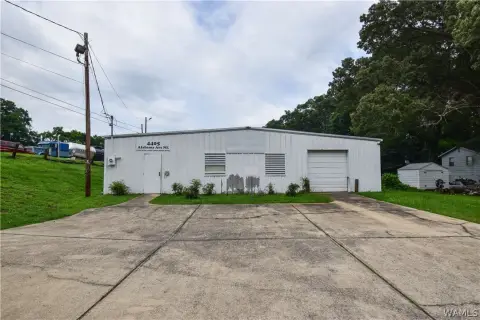
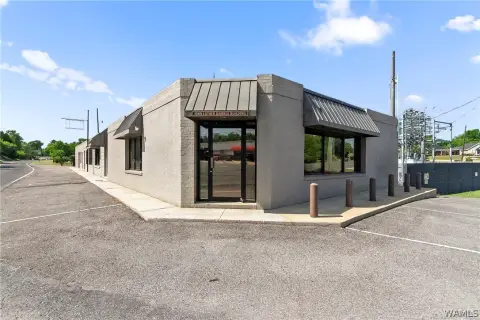
Located at 1030 13th Street E in Tuscaloosa, this 5,200-square-foot fitness facility sits on 0.69 acres and was built in 2013. The building features brick construction, a metal roof, concrete flooring, central heating, central air, and exterior security lighting. An established 24-hour fitness business currently operates at the property.
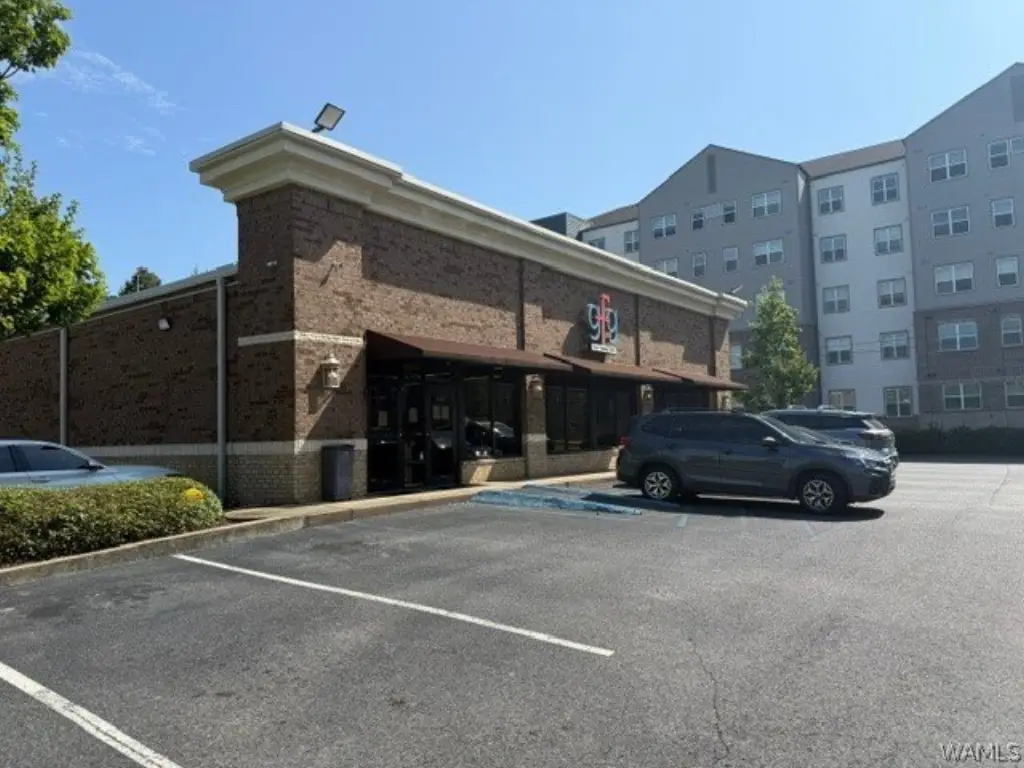
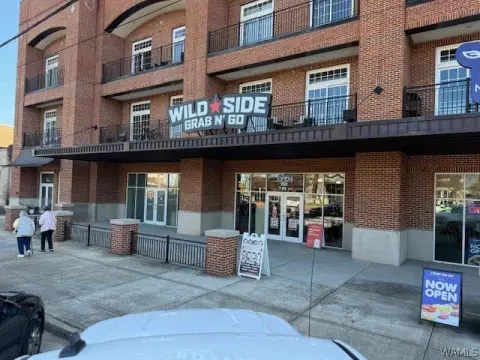
The site is near DCH Regional Medical Center, the University of Alabama, upscale apartment communities, Fresh Market, restaurants, and three major retail developments. The property may accommodate retail, medical office, showroom, restaurant, or office uses identified in the listing. The seller is willing to lease the building back under the existing gross lease, which has 3 1/2 years remaining and includes an additional 5-year option. An adjacent lot is also available for separate purchase.
The site is near DCH Regional Medical Center, the University of Alabama, upscale apartment communities, Fresh Market, restaurants, and three major retail developments. The property may accommodate retail, medical office, showroom, restaurant, or office uses identified in the listing. The seller is willing to lease the building back under the existing gross lease, which has 3 1/2 years remaining and includes an additional 5-year option. An adjacent lot is also available for separate purchase.
Key Highlights
- 5,200‑square‑foot fitness facility on 0.69 acres
- Existing 24‑hour fitness business operates at the property
- Seller leaseback available with 3 1/2 years remaining and an additional 5‑year option
Financial Insights
Estimated NOI and Cap Rate
NOI / Yr
$58,396
Cap Rate
3.89%
Suggested Prices Based on Cap Rates
Cap Rate 5%
$1,167,920
$1.2M
Cap Rate 7%
$834,229
$834.2K
Cap Rate 9%
$648,844
$648.8K
Market Conditions
NOI Build-Up for 5,200 SF
Gross rent
$90.5K $17.40/SF
− Vacancy
−$7.1K −$1.36/SF
EGI
$83.4K $16.04/SF
− OpEx
−$25.0K −$4.81/SF
NOI
$58.4K $11.23/SF
Area
Tuscaloosa, AL
Vacancy
7.80%
Lease Rate
$17.40 /SF/Yr
Expense Ratio
30.00%
Simulate Cap Rate and NOI
Suggested Prices Based on Cap Rates
Cap Rate 5%
$1,167,920
Cap Rate 7%
$834,229
Cap Rate 9%
$648,844
Alternative Uses
Best Use
Retail
$834.2K
$730.0K – $973.3K
NOI $58,396 @ 7.0% cap · market cap 3.89%
Second Best
—
—
no second resolved use
Theoretical Best
Office A
$1.25M
$1.09M – $1.46M
NOI $87,472 @ 7.0% cap · market cap 5.83%
Zoning and permitted uses should be independently verified with authorities.
How Realmo checks its estimates
Property Analytics
Unlock full access to Insights
Subscribe to Realmo Intelligence
Open Analytics
Current Use
Lease Details
Single-tenant
Tenancy
Location Intelligence
Trade Area within ½ mile
1,324
Businesses Nearby
497k
Monthly Visits Nearby
Well-served
Demand for This Use
Explore this area
Business Placement
Foot Traffic Nearby
Dining 31%
Apparel 22%
Shops & Services 16%
Home Improvements & Furnishings 13%
The Home Depot
Home Improvements & Furnishings
48,118 visits/mo
0.4 miles
Five Below
Shops & Services
47,962 visits/mo
0.3 miles
DICK'S Sporting Goods
Apparel
42,375 visits/mo
0.3 miles
Aldi
Groceries
37,015 visits/mo
0.1 miles
Krispy Kreme Doughnuts
Dining
31,486 visits/mo
0.2 miles
Demographics for 35404, AL
20,982
Population
11,427
Households
1.8
Avg Household Size
30
Median Age
27%
College-Educated
89%
High-School Grad
16.6 sq mi
ZIP Area
1,264
Density / Sq Mi
$45,521
Median Household Income
$25,035
Median Earnings
$986
Median Rent
$175,700
Median Home Value
Check the figures for this property
Cap Rate, Value Estimation, Potential NOI and more
View Realmo Analytics
Market
Vacancy Rate% for Retail in South region

Questions? Ask Rey
Realmo’s AI knows this listing — price, zoning, demand, history. Ask anything.



Similar Off Market Nearby
- Club Pilates — 1800 McFarland Blvd E #424, Tuscaloosa, AL 35404
- The Home Depot — 1301 Veterans Memorial Pkwy, Tuscaloosa, AL 35404
- Orangetheory Fitness — 1451 Dr Edward Hillard Dr, Tuscaloosa, AL 35401
- Life Fusions — 1718 Veterans Memorial Pkwy STE C, Tuscaloosa, AL 35404
- Future Prospects Training Center — 922 13th St E, Tuscaloosa, AL 35404
Frequently Asked Questions
What type of property is this?
Fitness center & gym - The facility includes central heating and cooling, concrete flooring, a metal roof, and security lighting.
Where is this fitness center & gym located?
The property is located at 1030 13th Street E Tuscaloosa, AL.
What is the asking price?
The asking price for this property is $1,500,000.
What are key features of this property?
This property features: 5,200‑square‑foot fitness facility on 0.69 acres; Existing 24‑hour fitness business operates at the property; Seller leaseback available with 3 1/2 years remaining and an additional 5‑year option


