Renovated Building with
For Sale
$1,900,000
Pending
1029 Us 9, Howell, NJ 07731
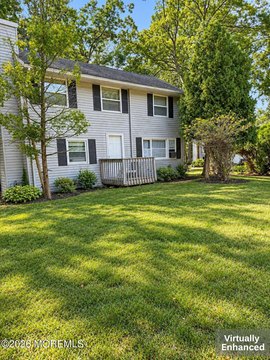
Renovated building with showroom, offices, and warehouse space.
Property Size5,990 SF
Lot Size0.80 Acres
Days on Market296
Property Features for 1029 Us 9
General Information
Standard status
Pending
Size
5,990 SF
Lot size
0.80 Acres
Property subtype
Commercial
Taxes and HOA fees
Annual Taxes
$22,590
Amenities
Central air
Central Air Cooling
Forced Air Heating
Unpaved
Listing Agency:
RE/MAX CENTRAL
(732) 972-1000
Listed By:
NANCY COVIELLO
Source:
Corcoran
Added: Dec 18, 2025
Changed: Oct 7
Last Checked: Oct 9 at 8:17PM
Displayed information is deemed reliable but is not guaranteed and should be independently verified. All listing content including descriptions, pricing, images are the copyrighted material of RE/MAX CENTRAL
Investment Insights
Based on property information with market context.
This completely renovated building, situated in a great location on Route 9 North, features a showroom with displays, customer sales desks, and a reception area, along with three private offices on the first floor. A loading area provides access to a large warehouse for materials. The property includes an ample unpaved lot for parking, as well as a paved parking area for clients. The second floor office space includes an open work area, a private office with French doors that open to a spacious conference room, a new kitchenette with bead board and tile backsplash, and a new full bath. The property has leased solar panels and is connected to public water and sewer. The building's total size is 5990 square feet and is suitable for flex space, industrial, warehouse, showroom, retail, and office use.
Key Highlights
- Completely renovated building with warehouse and showroom
- Great location on Route 9 North
- Large warehouse with loading area and ample parking (paved and unpaved)
Financial Insights
Estimated NOI and Cap Rate
NOI / Yr
$98,254
Cap Rate
5.17%
Suggested Prices Based on Cap Rates
Cap Rate 5%
$1,965,080
$2.0M
Cap Rate 7%
$1,403,629
$1.4M
Cap Rate 9%
$1,091,711
$1.1M
Market Conditions
NOI Build-Up for 5,990 SF
Gross rent
$194.8K $32.52/SF
− Vacancy
−$43.6K −$7.28/SF
EGI
$151.2K $25.24/SF
− OpEx
−$52.9K −$8.83/SF
NOI
$98.3K $16.40/SF
Area
Monmouth County, NJ
Vacancy
22.40%
Lease Rate
$32.52 /SF/Yr
Expense Ratio
35.00%
Simulate Cap Rate and NOI
Suggested Prices Based on Cap Rates
Cap Rate 5%
$1,965,080
Cap Rate 7%
$1,403,629
Cap Rate 9%
$1,091,711
Alternative Uses
Best Use
Flex RnD
$1.40M
$1.23M – $1.64M
NOI $98,254 @ 7.0% cap · market cap 5.17%
Second Best
Retail
$1.22M
$1.07M – $1.42M
NOI $85,497 @ 7.0% cap · market cap 4.50%
Theoretical Best
Office A
$1.56M
$1.37M – $1.82M
NOI $109,488 @ 7.0% cap · market cap 5.76%
Zoning and permitted uses should be independently verified with authorities.
Property Analytics
Unlock full access to Insights
Subscribe to Realmo Intelligence
Open Analytics
Current Use
Location Intelligence
Trade Area within ½ mile
225
Businesses Nearby
Under-served
Demand for This Use
Explore this area
Business Placement
Demographics for 07731, NJ
39,677
Population
14,102
Households
2.8
Avg Household Size
40
Median Age
42%
College-Educated
94%
High-School Grad
31.8 sq mi
ZIP Area
1,248
Density / Sq Mi
$130,064
Median Household Income
$57,228
Median Earnings
$2,619
Median Rent
$454,900
Median Home Value
Check the figures for this property
Cap Rate, Value Estimation, Potential NOI and more
View Realmo Analytics
Market
Vacancy Rate% for Industrial in Northeast region

Questions? Ask Rey
Realmo’s AI knows this listing — price, zoning, demand, history. Ask anything.


Frequently Asked Questions
What type of property is this?
Flex space - Renovated building with showroom, offices, and warehouse space.
Where is this flex space located?
The property is located at 1029 Us 9 Howell, NJ.
What is the asking price?
The asking price for this property is $1,900,000.
What are key features of this property?
This property features: Completely renovated building with warehouse and showroom; Great location on Route 9 North; Large warehouse with loading area and ample parking (paved and unpaved)


