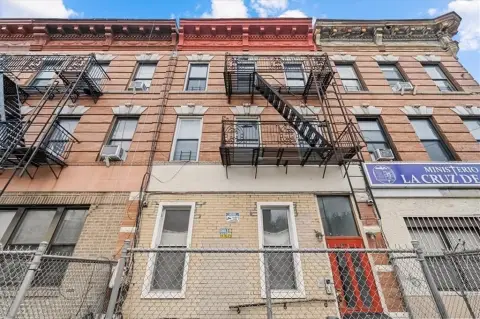
Oversized 2-Family Brick
For Sale
$1,400,000
1026 39th St, Brooklyn, NY 11219
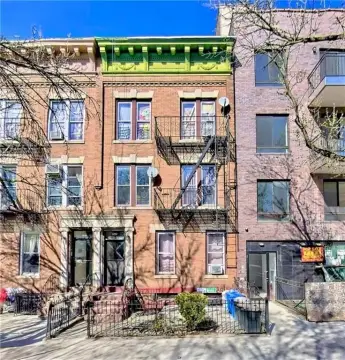
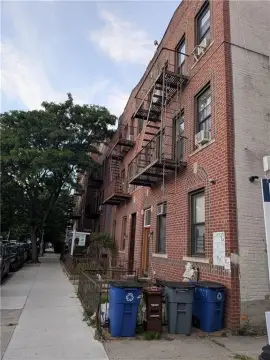
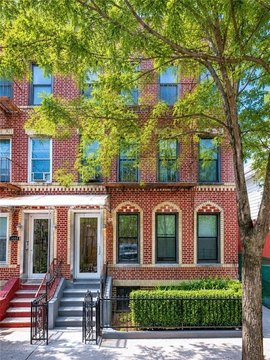
Spacious 8-bedroom home in Sunset Park/Borough Park with buildable potential.
Property Size2,616 SF
Days on Market312
Property Features for 1026 39th St
General Information
Standard status
Active
Size
2,616 SF
Property subtype
Multi Family
Taxes and HOA fees
Annual Taxes
$5,181
Building Details
Building Size
2,616 SF
Year Built
1920
Stories
2
Listing Agency:
Womcore LLC dba Remax Edge
Listed By:
Jason Zhou · License #JZ1320
(718) 612-3088
Source:
Elliman
Added: Nov 28, 2025
Changed: Oct 4
Last Checked: Oct 5 at 6:56PM
Displayed information is deemed reliable but is not guaranteed and should be independently verified. All listing content including descriptions, pricing, images are the copyrighted material of Womcore LLC dba Remax Edge
Investment Insights
Based on property information with market context.
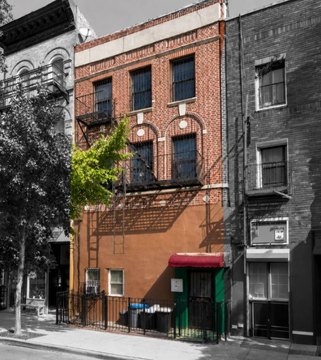
This is an oversized 2-family brick home featuring a total of 8 bedrooms and 5 full bathrooms. The property benefits from M1-2 zoning, offering approximately 1,200 square feet of additional buildable potential. Situated in the Sunset Park/Borough Park area, the building has dimensions of 20 feet by 70 feet and sits on a 20 feet by 95 feet lot. The first floor includes 4 bedrooms, with a master suite featuring a private full bathroom, plus 3 additional bedrooms and a shared bathroom. The second floor also has 4 bedrooms and 2 full bathrooms. The property includes a finished basement with a full bathroom and a separate front entrance. The annual property tax is $5,491.
Key Highlights
- Oversized 2‑family brick home with 8 bedrooms and 5 full bathrooms.
- M1‑2 zoning with approximately 1,200 SF of additional buildable potential.
- Prime location in Sunset Park/Borough Park.
Financial Insights
Estimated NOI and Cap Rate
NOI / Yr
$67,816
Cap Rate
4.84%
Suggested Prices Based on Cap Rates
Cap Rate 5%
$1,356,320
$1.4M
Cap Rate 7%
$968,800
$968.8K
Cap Rate 9%
$753,511
$753.5K
Market Conditions
NOI Build-Up for 2,616 SF
Gross rent
$128.7K $49.20/SF
− Vacancy
−$5.4K −$2.07/SF
EGI
$123.3K $47.13/SF
− OpEx
−$55.5K −$21.21/SF
NOI
$67.8K $25.92/SF
Area
ZIP 11219
Vacancy
4.20%
Lease Rate
$49.20 /SF/Yr
Expense Ratio
45.00%
Simulate Cap Rate and NOI
Suggested Prices Based on Cap Rates
Cap Rate 5%
$1,356,320
Cap Rate 7%
$968,800
Cap Rate 9%
$753,511
Alternative Uses
Best Use
Apartment 5plus
$968.8K
$847.7K – $1.13M
NOI $67,816 @ 7.0% cap · market cap 4.84%
Second Best
—
—
no second resolved use
Theoretical Best
Office A
$1.70M
$1.48M – $1.98M
NOI $118,712 @ 7.0% cap · market cap 8.48%
Zoning and permitted uses should be independently verified with authorities.
Property Analytics
Unlock full access to Insights
Subscribe to Realmo Intelligence
Open Analytics
Current Use
Location Intelligence
Trade Area within ½ mile
5,061
Businesses Nearby
Explore this area
Business Placement
Demographics for 11219, NY
103,447
Population
27,973
Households
3.7
Avg Household Size
27
Median Age
21%
College-Educated
70%
High-School Grad
1.5 sq mi
ZIP Area
68,965
Density / Sq Mi
$55,685
Median Household Income
$30,647
Median Earnings
$1,678
Median Rent
$1,086,000
Median Home Value
Check the figures for this property
Cap Rate, Value Estimation, Potential NOI and more
View Realmo Analytics
Market
Vacancy Rate% for Multifamily in Northeast region

Questions? Ask Rey
Realmo’s AI knows this listing — price, zoning, demand, history. Ask anything.



Frequently Asked Questions
What type of property is this?
Apartment building - Spacious 8-bedroom home in Sunset Park/Borough Park with buildable potential.
Where is this apartment building located?
The property is located at 1026 39th St Brooklyn, NY.
What is the asking price?
The asking price for this property is $1,400,000.
What are key features of this property?
This property features: Oversized 2‑family brick home with **8 bedrooms and 5 full bathrooms**.; M1‑2 zoning with approximately 1,200 SF of additional buildable potential.; Prime location in Sunset Park/Borough Park.



