Three-Story Office
For Sale
$2,950,000
Pending
1020 Monarch St, Lexington, KY 40513
Elevator-served professional property with leased first-floor space and flexible upper-floor office configurations.
Property Size22,536 SF
Days on Market377
Property Features for 1020 Monarch St
General Information
Standard status
Pending
Size
22,536 SF
Elevators
Yes
Property subtype
Office
Zoning
P-1
Additional Details
Asking Price
$3,100,000
Amenities
Power
Water
Sewer
Building Details
Year Built
2004
Buildings
1
Stories
3
Tenancy
Multi
Listing Agency:
The Gibson Company
Listed By:
Kevin Verhoven · License #58263
(859) 224-8833
Source:
Kcrea.resimplifi
Added: Oct 6, 2025
Changed: Oct 10
Last Checked: Oct 16 at 5:41AM
Displayed information is deemed reliable but is not guaranteed and should be independently verified. All listing content including descriptions, pricing, images are the copyrighted material of The Gibson Company

Ask AI about this property
Review the available facts, identify missing information and prepare questions for the agent.
Investment Insights
Based on property information with market context.
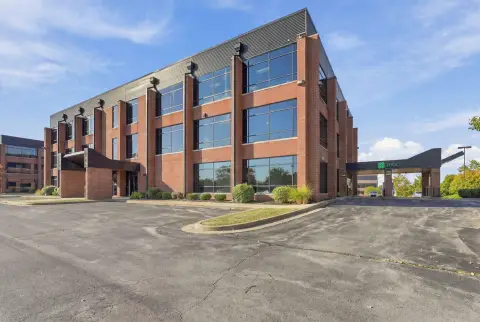
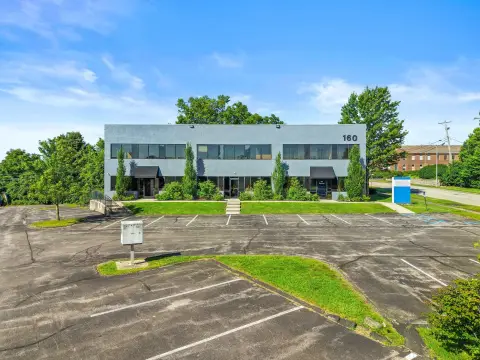
Built in 2004, this three-story professional office building includes elevator service and surface parking. The first floor is leased to two professional tenants, while the upper levels provide a range of existing office, meeting, training, break, and storage areas.
The second floor includes a training room, open workstation area, three private offices, a conference room, and a break room. The 7,632 RSF third floor adds 22 private offices, large and small conference rooms, two public restrooms, one private restroom, a break room, and dedicated storage. The property is near Harrodsburg Road, New Circle Road, and Man O’ War Boulevard, with restaurants, retail, and professional services in the surrounding Beaumont Centre area. Zoning is P-1.
The second floor includes a training room, open workstation area, three private offices, a conference room, and a break room. The 7,632 RSF third floor adds 22 private offices, large and small conference rooms, two public restrooms, one private restroom, a break room, and dedicated storage. The property is near Harrodsburg Road, New Circle Road, and Man O’ War Boulevard, with restaurants, retail, and professional services in the surrounding Beaumont Centre area. Zoning is P-1.
Key Highlights
- 7,632 RSF third floor with 22 private offices and multiple conference rooms
- First floor leased to two professional tenants
- Three‑story office building constructed in 2004
Financial Insights
Estimated NOI and Cap Rate
NOI / Yr
$251,907
Cap Rate
8.54%
Suggested Prices Based on Cap Rates
Cap Rate 5%
$5,038,140
$5.0M
Cap Rate 7%
$3,598,671
$3.6M
Cap Rate 9%
$2,798,967
$2.8M
Market Conditions
NOI Build-Up for 22,536 SF
Gross rent
$405.6K $18.00/SF
− Vacancy
−$69.8K −$3.10/SF
EGI
$335.9K $14.90/SF
− OpEx
−$84.0K −$3.73/SF
NOI
$251.9K $11.18/SF
Area
Lexington, KY
Vacancy
17.20%
Lease Rate
$18.00 /SF/Yr
Expense Ratio
25.00%
Simulate Cap Rate and NOI
Suggested Prices Based on Cap Rates
Cap Rate 5%
$5,038,140
Cap Rate 7%
$3,598,671
Cap Rate 9%
$2,798,967
Alternative Uses
Best Use
Office B
$3.60M
$3.15M – $4.20M
NOI $251,907 @ 7.0% cap · market cap 8.54%
Second Best
—
—
no second resolved use
Theoretical Best
Office A
$4.70M
$4.11M – $5.48M
NOI $328,672 @ 7.0% cap · market cap 11.14%
Zoning and permitted uses should be independently verified with authorities.
How Realmo checks its estimates
Property Analytics
Unlock full access to Insights
Subscribe to Realmo Intelligence
Open Analytics
Current Use
Lease Details
Multi-tenant
Tenancy
Location Intelligence
Trade Area within ½ mile
1,468
Businesses Nearby
Explore this area
Business Placement
Demographics for 40513, KY
11,244
Population
4,734
Households
2.4
Avg Household Size
45
Median Age
71%
College-Educated
98%
High-School Grad
14.7 sq mi
ZIP Area
765
Density / Sq Mi
$126,642
Median Household Income
$76,503
Median Earnings
$1,413
Median Rent
$448,100
Median Home Value
Check the figures for this property
Cap Rate, Value Estimation, Potential NOI and more
View Realmo Analytics
Market
Vacancy Rate% for Office in South region




Frequently Asked Questions
What type of property is this?
Office building - Elevator-served professional property with leased first-floor space and flexible upper-floor office configurations.
Where is this office building located?
The property is located at 1020 Monarch St Lexington, KY.
What is the asking price?
The asking price for this property is $2,950,000.
What are key features of this property?
This property features: 7,632 RSF third floor with 22 private offices and multiple conference rooms; First floor leased to two professional tenants; Three‑story office building constructed in 2004


