Renovated Three-Story Mixed-Use


For Sale
$1,825,000
161 N Limestone, Lexington, KY 40507
Commercial Sale, Lexington, KY
Property Size7,343 SF
Lot Size0.05 Acres
Price / SF$248.54
Days on Market209
Property Features for 161 N Limestone
General Information
Property type
Commercial Sale
Property subtype
Retail
Zoning description
B-2B
Rooms
Basement
Subdivision
Commercial
Directions
N. Limestone on the left on the corner of Church Street across from the Courthouses.
Standard status
Active
APN
10940300
Size
7,343 SF
Lot size
0.05 Acres
Amenities
elevator
handicap accessible ramp
lobby with mail room
kitchenettes
Building Details
Year built
1930
Floors in Building
3
Building materials
Brick
Listing Agency:
Block + Lot Homes
(859) 309-0099
Listed By:
Gregory Leveridge · License #215416
(859) 421-8959
Added: Mar 12
Changed: Oct 2
Last Checked: Oct 6 at 4:06AM
MLS# 26004750
Copyright © 2026 ImagineMLS. All rights reserved. All information provided by the listing agent/broker is deemed reliable but is not guaranteed and should be independently verified.
Investment Insights
Based on property information with market context.
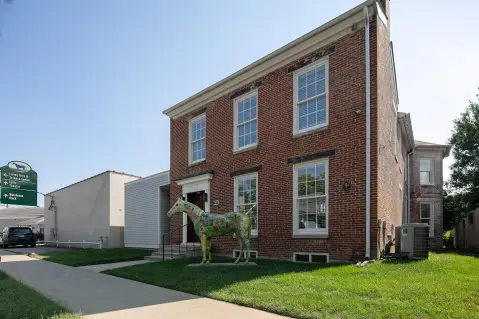
Built in 1930, this three-story brick mixed-use building contains 7,343 square feet and underwent comprehensive renovations in 2020. Improvements included a new roof, hardwood flooring, updated HVAC systems, interior and exterior paint, a new lobby with mail room, an elevator coded for private access, and a handicap-accessible ramp. Floors 2 and 3 feature exposed brick and open ceilings, while each floor includes two kitchenettes and two restrooms.
The first floor is occupied by Georgie's Social House, with a leaseback preference or potential for a new five-year term at closing. The second floor is leased to Relix Bridal, Inc. through October 2030. The third floor is currently vacant and configured with individual office suites, with the option to retain that layout or convert the floor to a single office space.
The property occupies the corner of N Limestone Street and Church Street in downtown Lexington, directly across from the Courthouse and near multiple established restaurants and coffee shops.
The first floor is occupied by Georgie's Social House, with a leaseback preference or potential for a new five-year term at closing. The second floor is leased to Relix Bridal, Inc. through October 2030. The third floor is currently vacant and configured with individual office suites, with the option to retain that layout or convert the floor to a single office space.
The property occupies the corner of N Limestone Street and Church Street in downtown Lexington, directly across from the Courthouse and near multiple established restaurants and coffee shops.
Key Highlights
- 7,343‑square‑foot mixed‑use building on 0.0517 acres
- Three‑story brick construction completed in 1930
- 2020 renovations included roof, HVAC, elevator, flooring, paint, lobby, and accessibility improvements
Financial Insights
Estimated NOI and Cap Rate
NOI / Yr
$82,080
Cap Rate
4.50%
Suggested Prices Based on Cap Rates
Cap Rate 5%
$1,641,600
$1.6M
Cap Rate 7%
$1,172,571
$1.2M
Cap Rate 9%
$912,000
$912.0K
Market Conditions
NOI Build-Up for 7,343 SF
Gross rent
$132.2K $18.00/SF
− Vacancy
−$22.7K −$3.10/SF
EGI
$109.4K $14.90/SF
− OpEx
−$27.4K −$3.73/SF
NOI
$82.1K $11.18/SF
Area
Lexington, KY
Vacancy
17.20%
Lease Rate
$18.00 /SF/Yr
Expense Ratio
25.00%
Simulate Cap Rate and NOI
Suggested Prices Based on Cap Rates
Cap Rate 5%
$1,641,600
Cap Rate 7%
$1,172,571
Cap Rate 9%
$912,000
Alternative Uses
Best Use
Office B
$1.17M
$1.03M – $1.37M
NOI $82,080 @ 7.0% cap · market cap 4.50%
Second Best
Retail
$998.2K
$873.4K – $1.16M
NOI $69,872 @ 7.0% cap · market cap 3.83%
Theoretical Best
Office A
$1.53M
$1.34M – $1.78M
NOI $107,093 @ 7.0% cap · market cap 5.87%
Zoning and permitted uses should be independently verified with authorities.
Property Analytics
Unlock full access to Insights
Subscribe to Realmo Intelligence
Open Analytics
Current Use
Lease Details
Multi-tenant
Tenancy
Location Intelligence
Trade Area within ½ mile
3,854
Businesses Nearby
Explore this area
Business Placement
Demographics for 40507, KY
2,043
Population
1,765
Households
1.2
Avg Household Size
44
Median Age
54%
College-Educated
93%
High-School Grad
0.4 sq mi
ZIP Area
5,108
Density / Sq Mi
$34,543
Median Household Income
$40,826
Median Earnings
$642
Median Rent
$391,000
Median Home Value
Check the figures for this property
Cap Rate, Value Estimation, Potential NOI and more
View Realmo Analytics
Market
Vacancy Rate% for Office in South region

Questions? Ask Rey
Realmo’s AI knows this listing — price, zoning, demand, history. Ask anything.



Frequently Asked Questions
What type of property is this?
Mixed-use property - Brick downtown building with leased second-floor space and adaptable third-floor offices.
Where is this mixed-use property located?
The property is located at 161 N Limestone Lexington, KY.
What is the asking price?
The asking price for this property is $1,825,000.
What are key features of this property?
This property features: 7,343‑square‑foot mixed‑use building on 0.0517 acres; Three‑story brick construction completed in 1930; 2020 renovations included roof, HVAC, elevator, flooring, paint, lobby, and accessibility improvements



