Flex Industrial
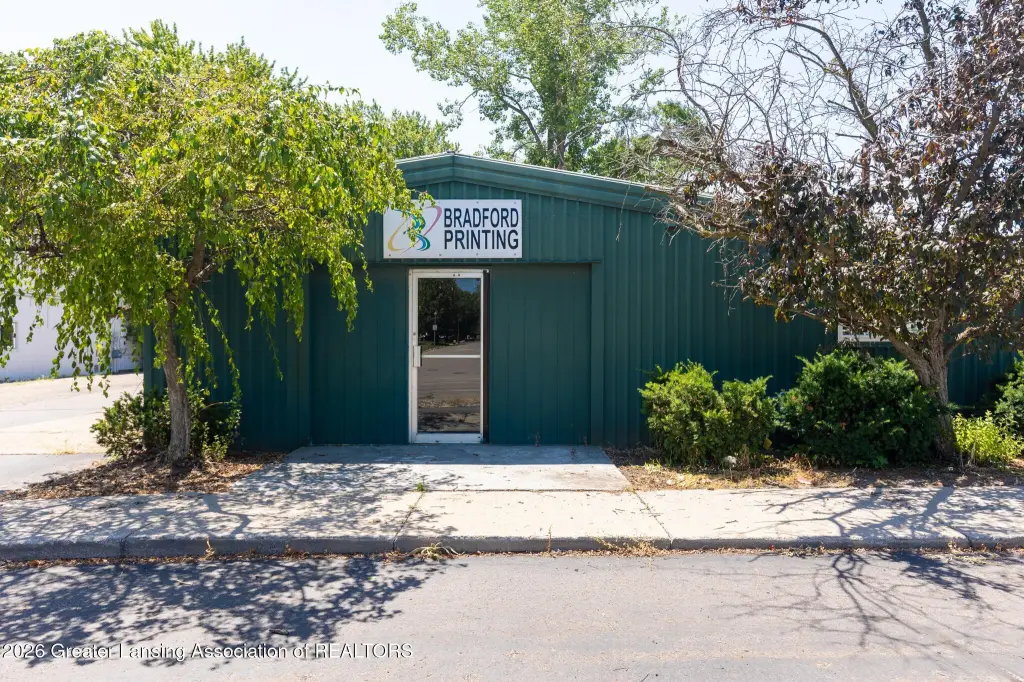
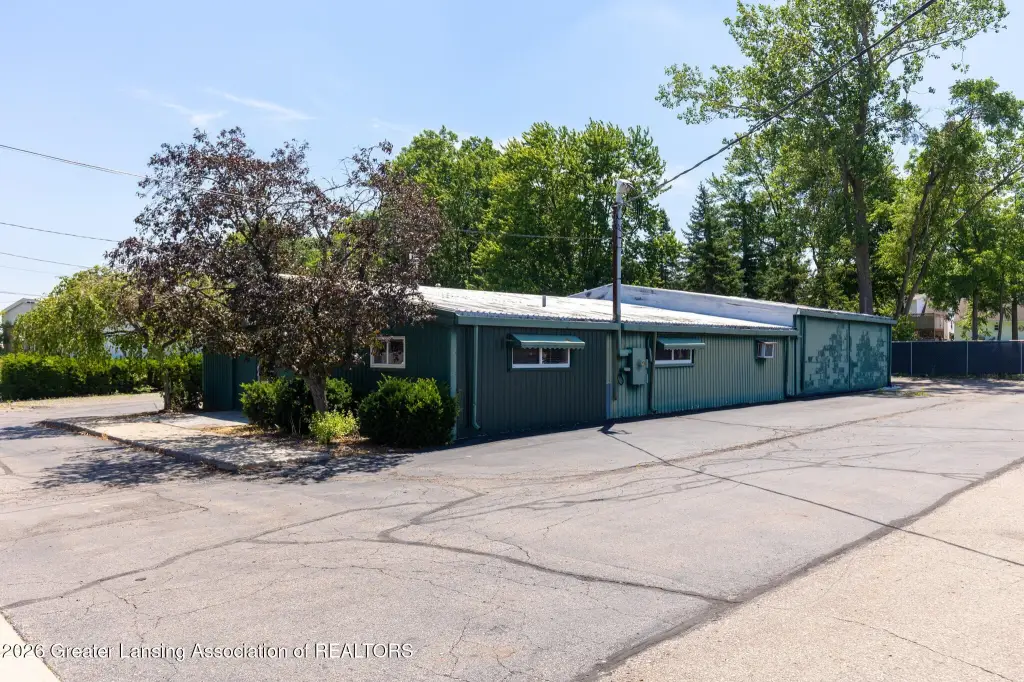
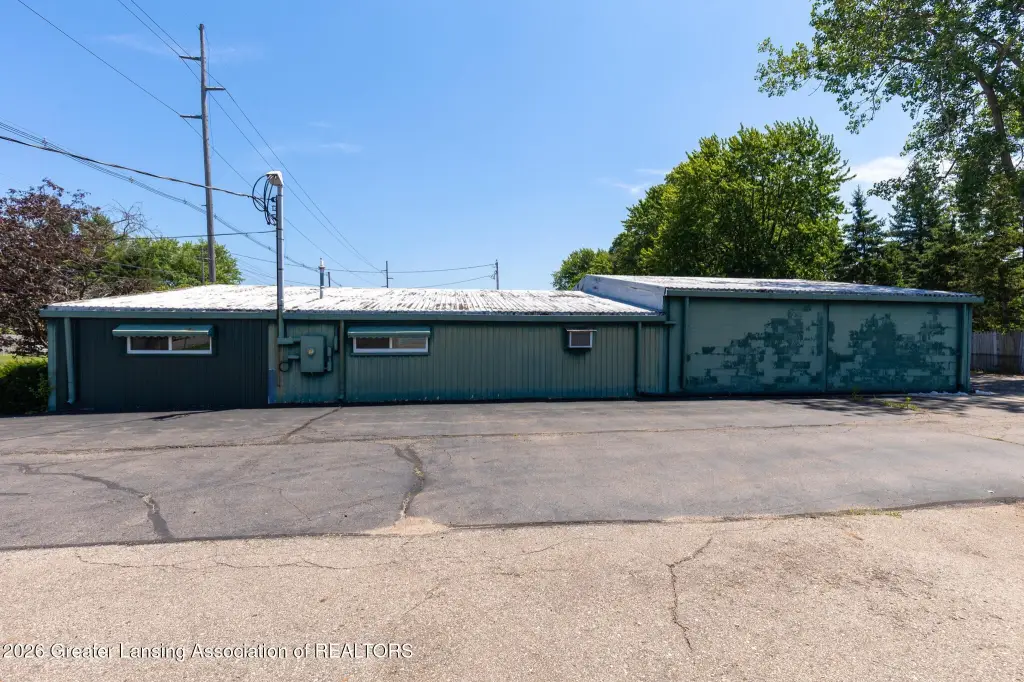
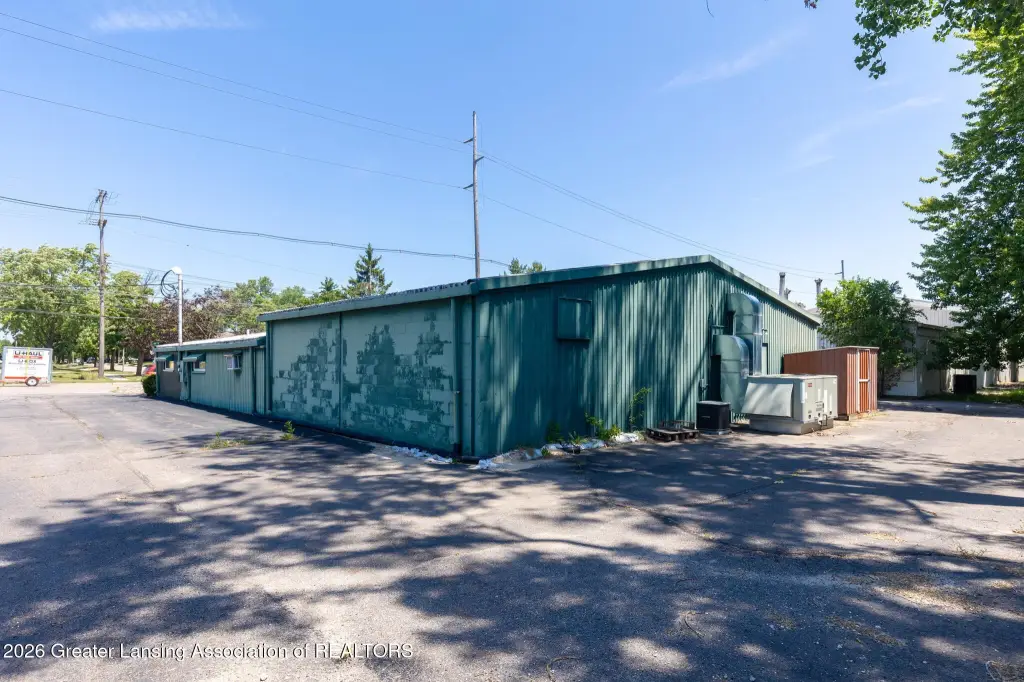
For Sale
$239,900
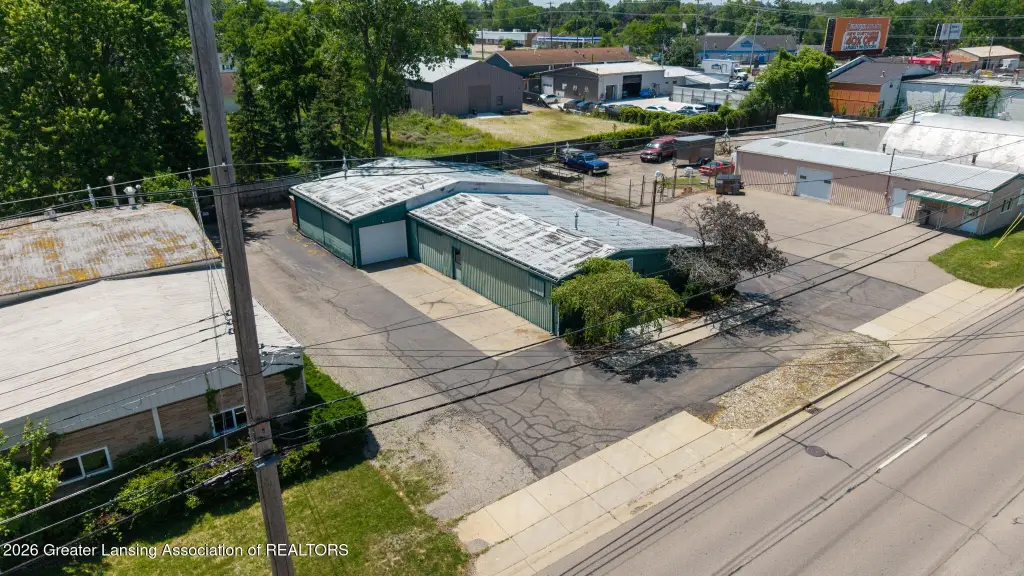
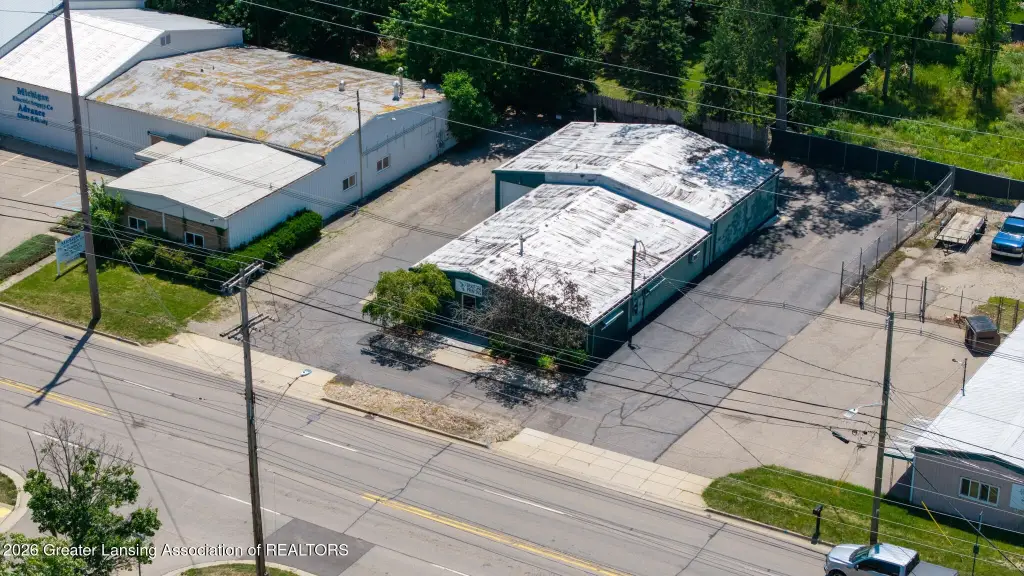
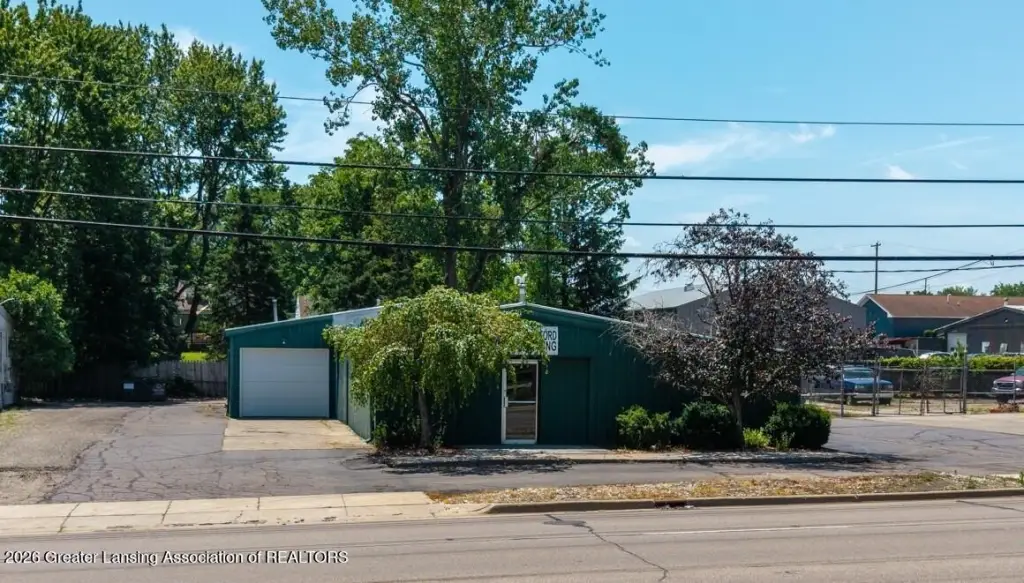
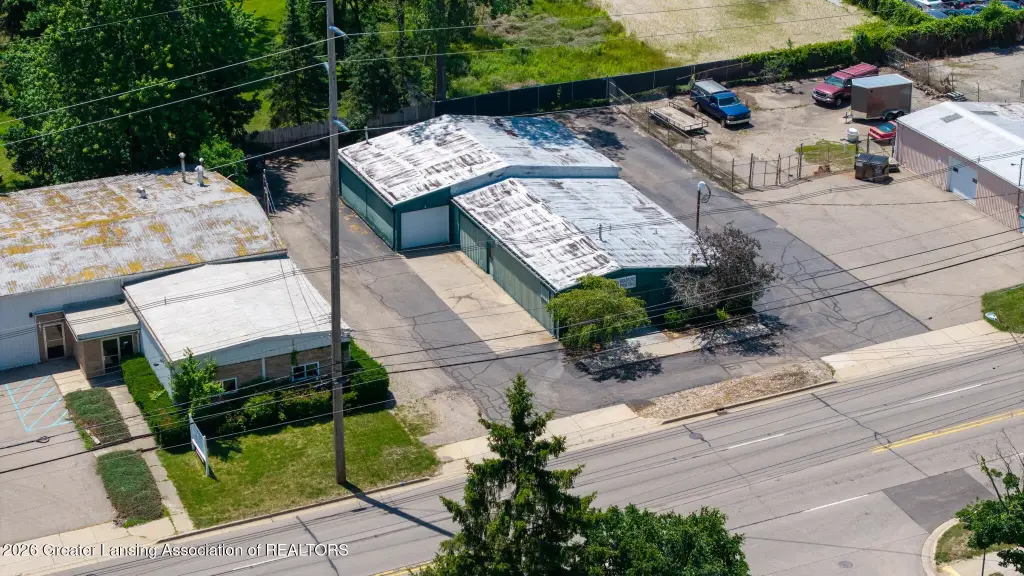
1020 E Jolly Road, Lansing, MI 48910
Commercial Sale, Lansing, MI
Property Size3,315 SF
Lot Size0.24 Acres
Price / SF$72.37
Days on Market95
Property Features for 1020 E Jolly Road
General Information
Property type
Commercial Sale
Property subtype
Other
Zoning description
Zoning
Bathrooms
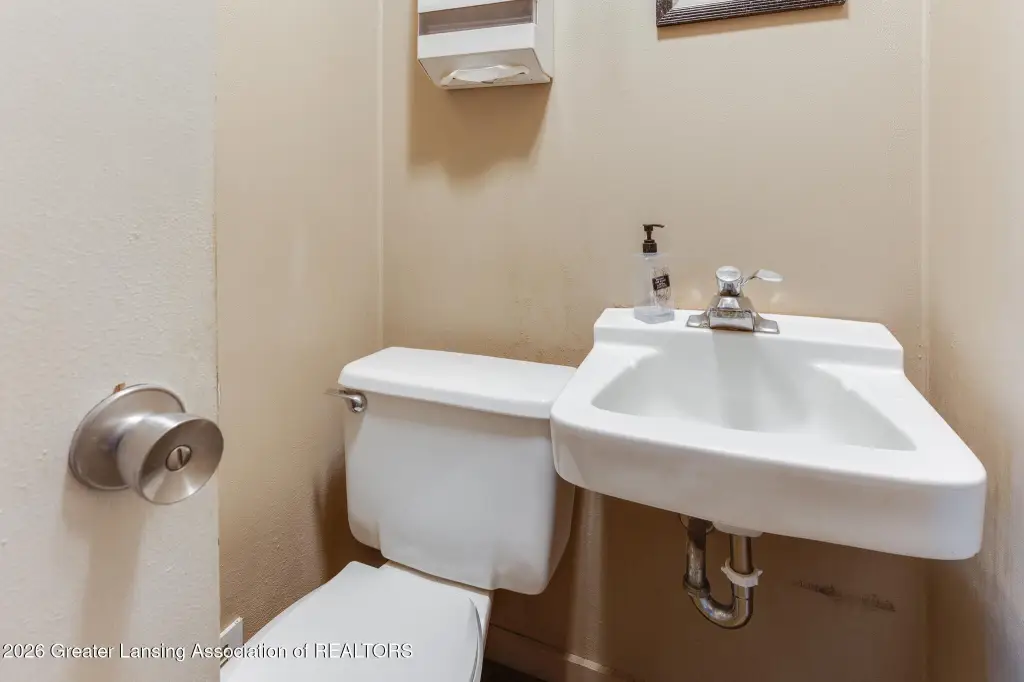
1
Full bathrooms
1
Rooms
Bathroom 1
Exterior features
Lighting
Lot features
City Lot
Elementary school district
Lansing
Middle school district
Lansing
High school district
Lansing
Directions
North on Pennsylvania, East on Jolly, property is on the right.
Standard status
Active
APN
33-01-05-03-126-092
Size
3,315 SF
Lot size
0.24 Acres
Taxes and HOA fees
Tax Year
25
Tax Description
COM ON SEC LINE 317.75 FT E OF N 1/8 POST OF NW 1/4 SEC 3, TH E 80 FT, S 165 FT W 80 FT, N 165 FT TO BEG; SEC 3 T3N R2W
Tax Annual Amount
4532
Legal Description
COM ON SEC LINE 317.75 FT E OF N 1/8 POST OF NW 1/4 SEC 3, TH E 80 FT, S 165 FT W 80 FT, N 165 FT TO BEG; SEC 3 T3N R2W
Utilities
Sewer type
Public Sewer
Heating system
Natural Gas, Forced Air
Cooling system
Multi Units, Central Air
Water source
Public
Building Details
Year built
1960
Floors in Building
1
Flooring type
Concrete, Carpet
Building materials
Aluminum Siding, Block
Roof type
Metal
Listing Agency:
Keller Williams Realty Lansing
(517) 853-1200
Listed By:
Max A Billinghurst · License #6501416838
(269) 339-1431
Added: Jul 8
Changed: Oct 6
Last Checked: Oct 10 at 2:06AM
MLS# 297378
Copyright © 2026 Greater Lansing Association of Realtors. All rights reserved. All information provided by the listing agent/broker is deemed reliable but is not guaranteed and should be independently verified.
Investment Insights
Based on property information with market context.
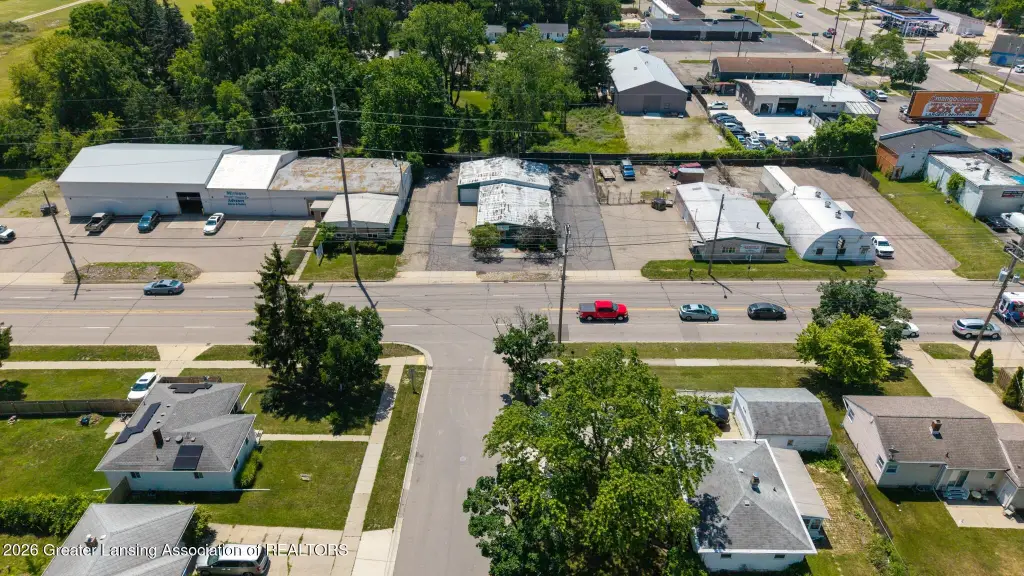
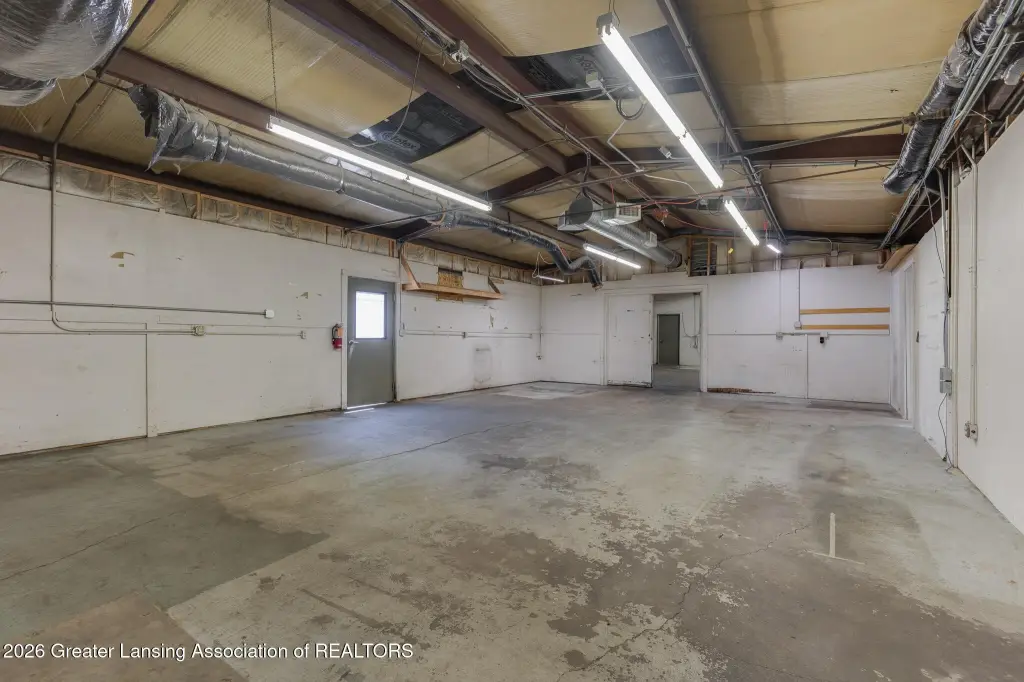
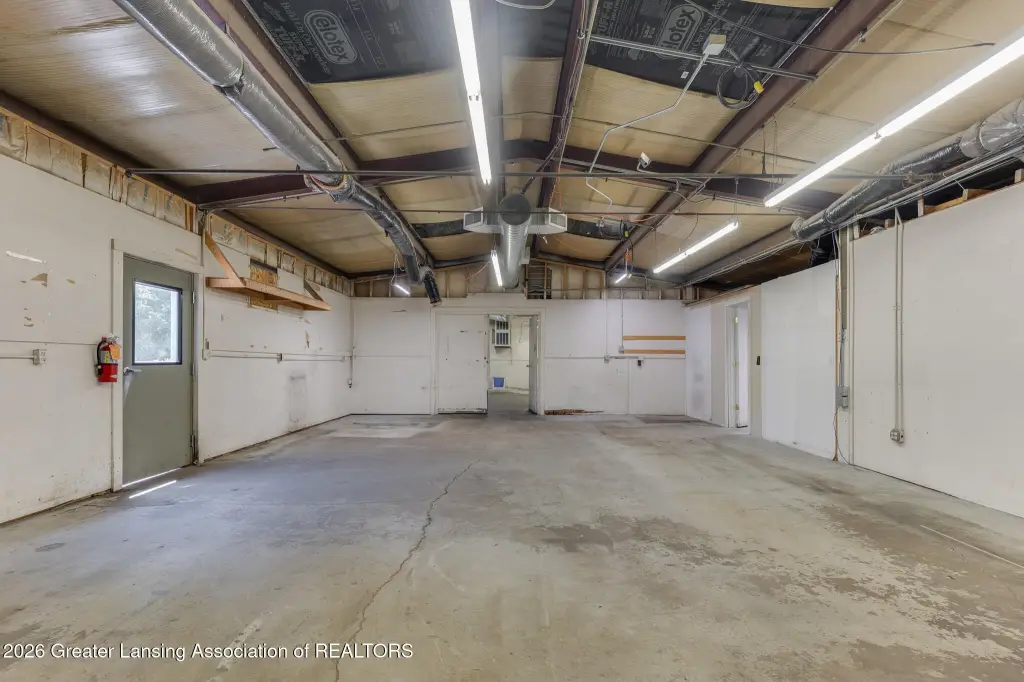
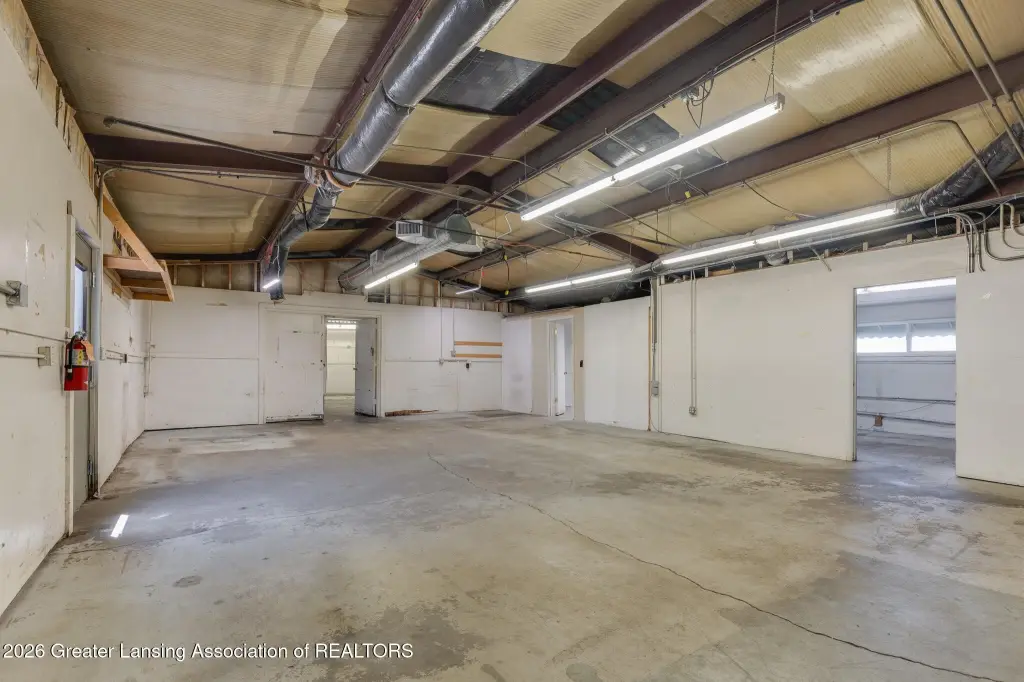
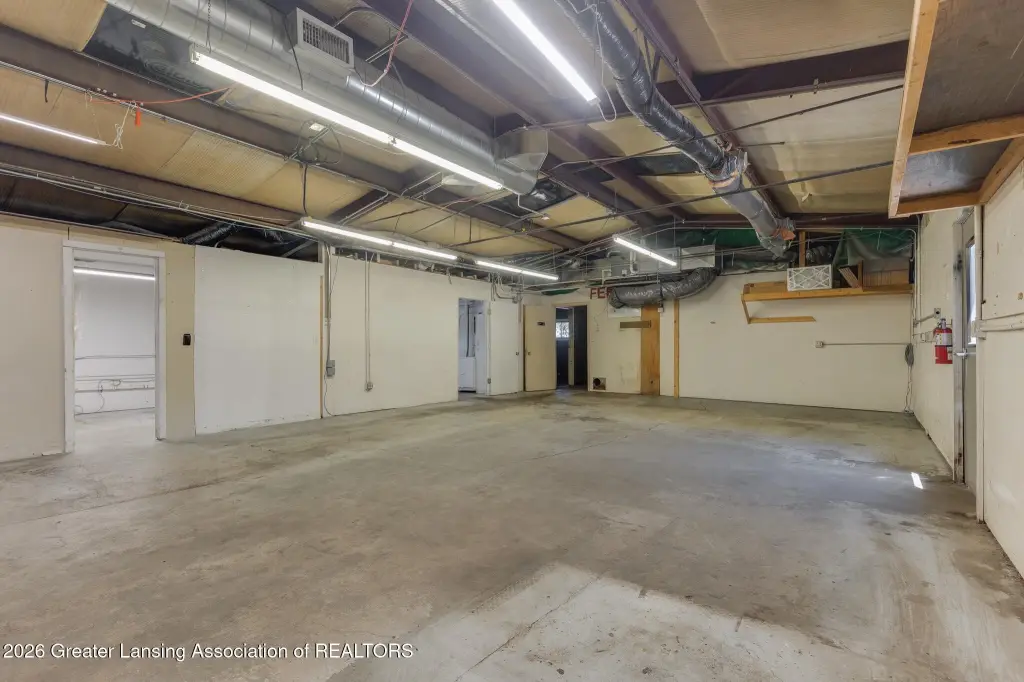
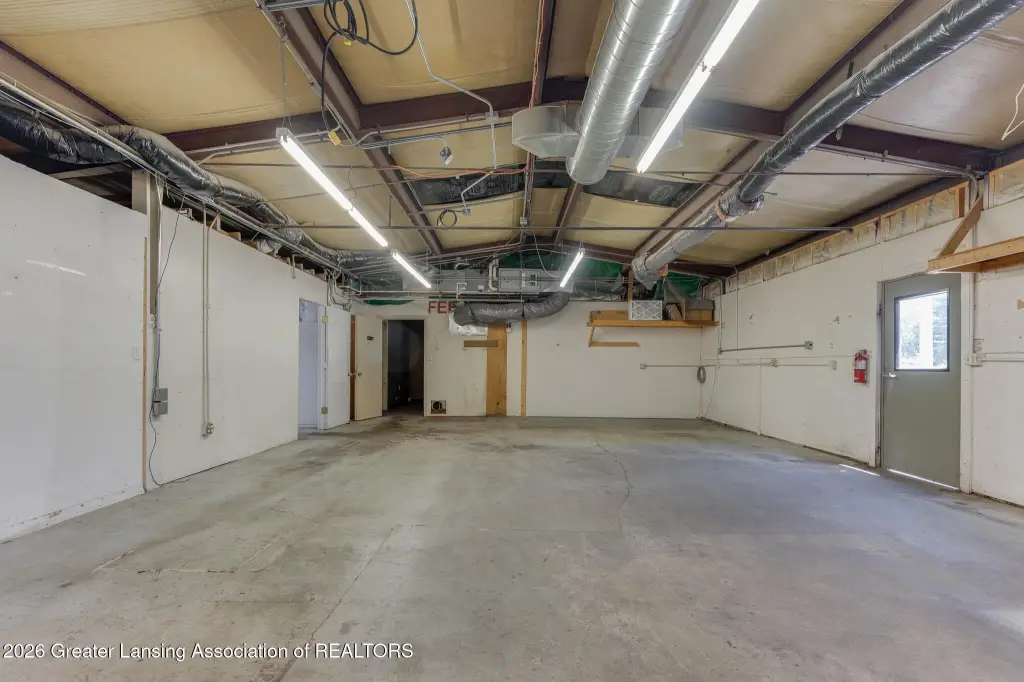
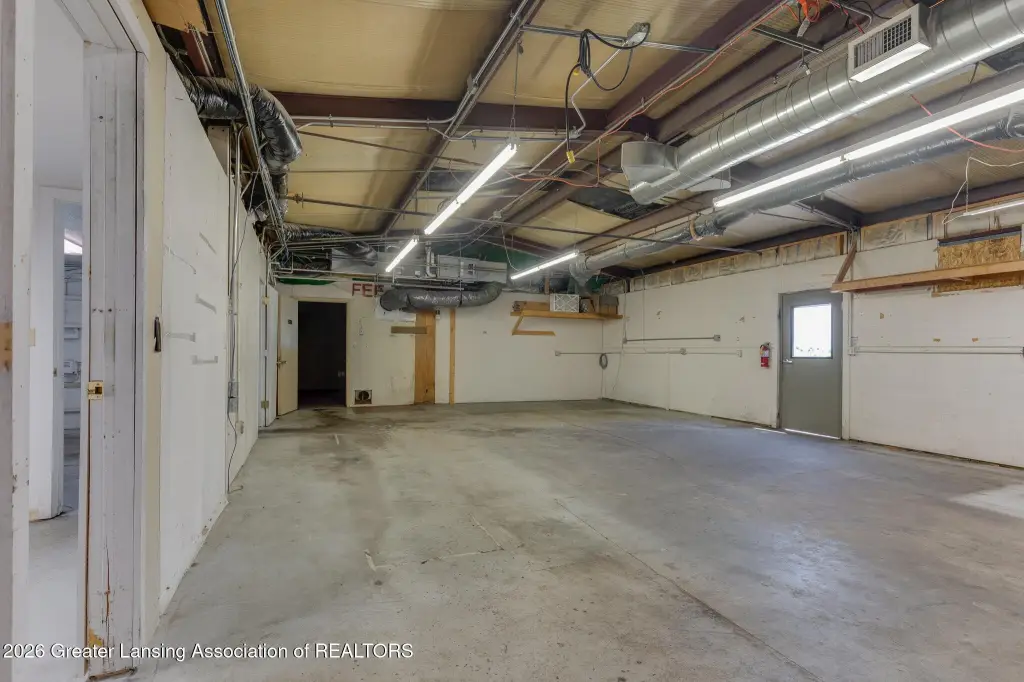
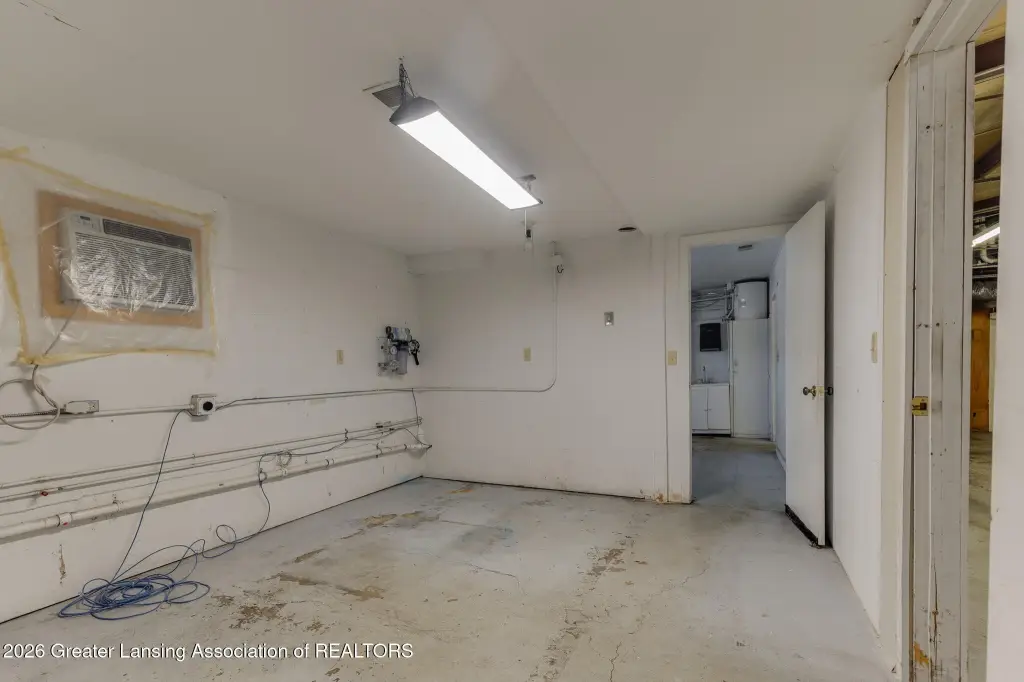
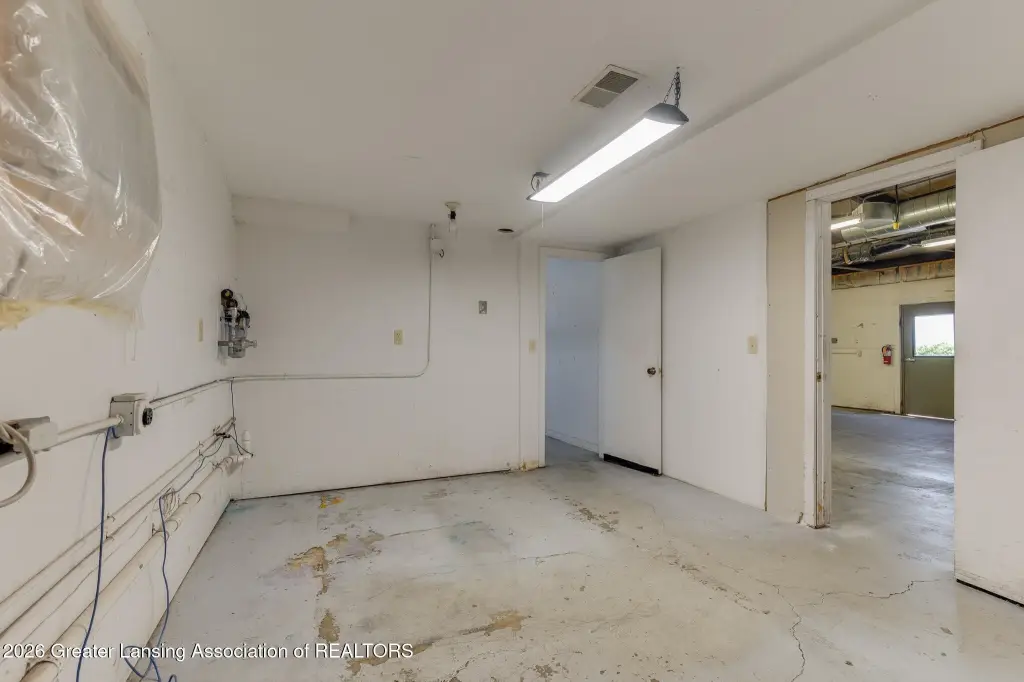
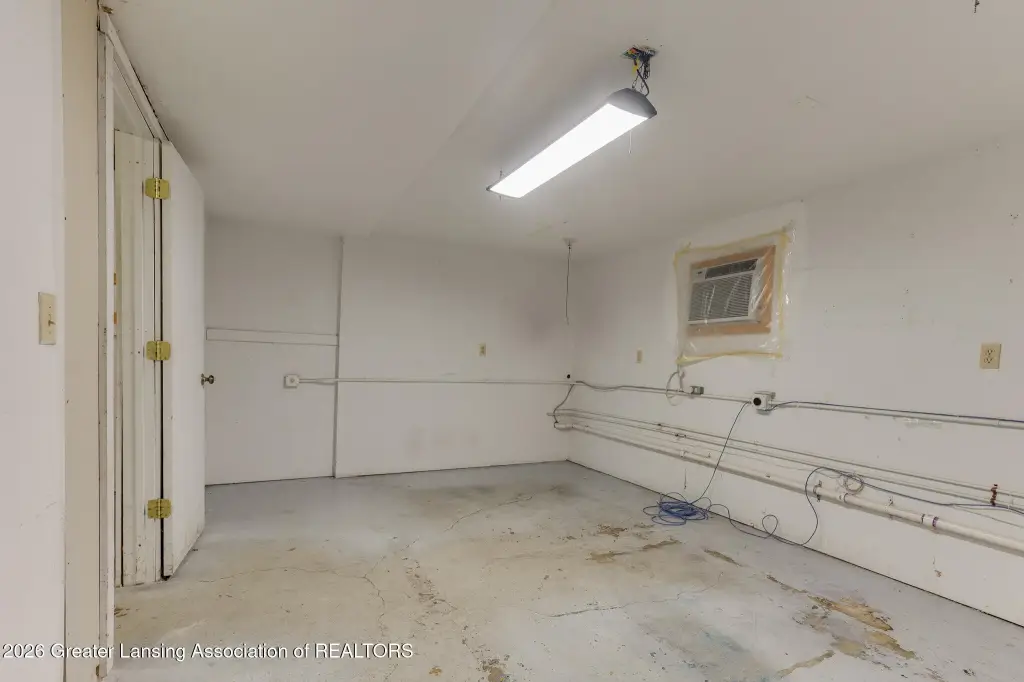
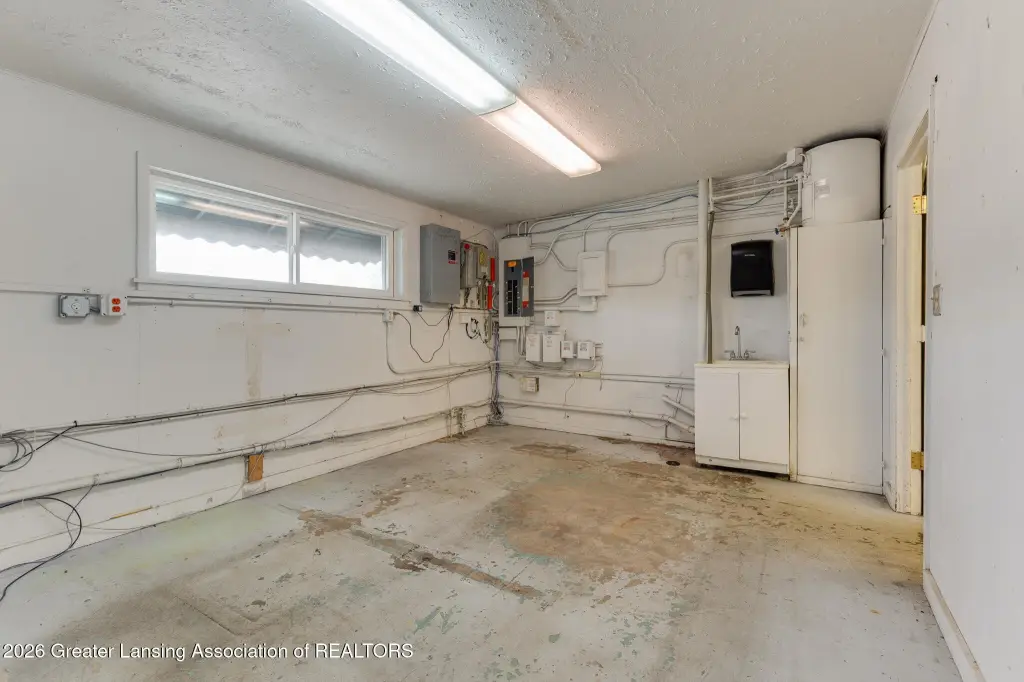
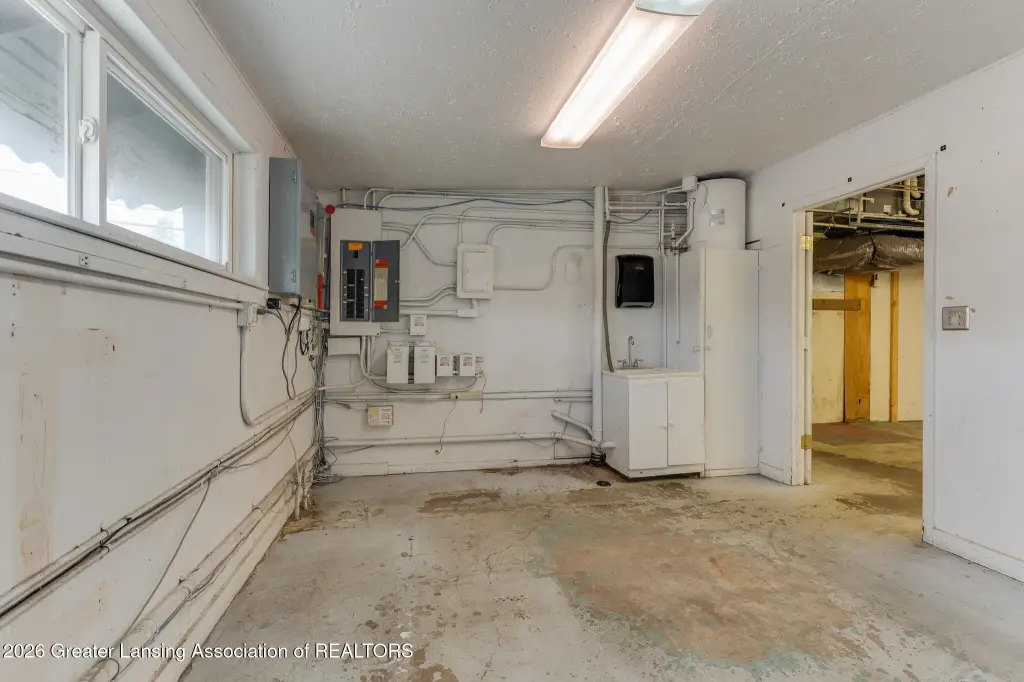
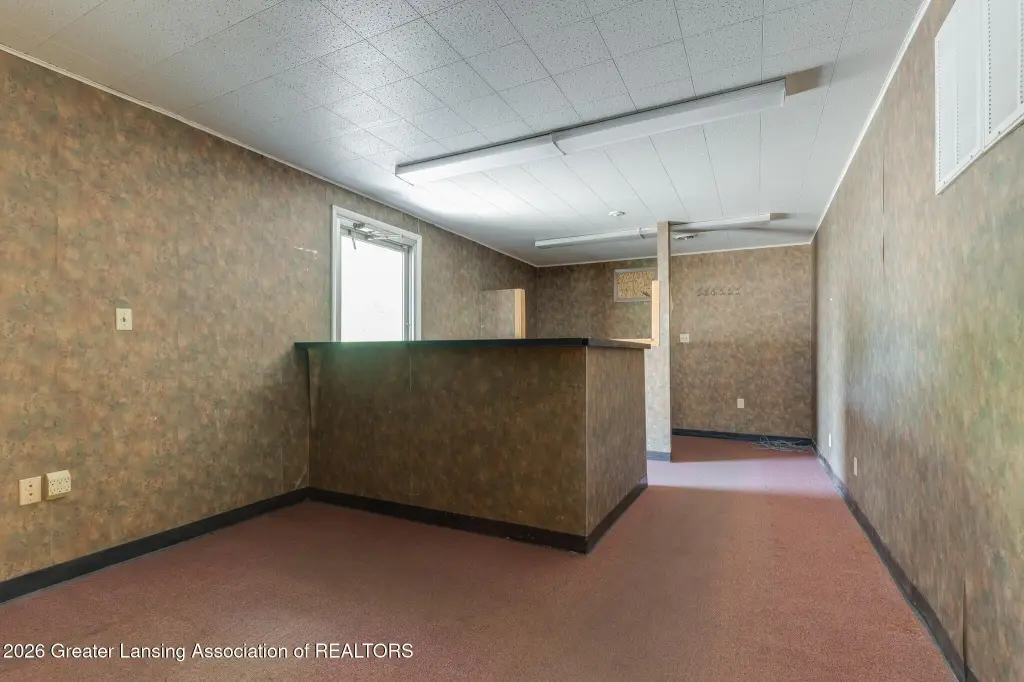
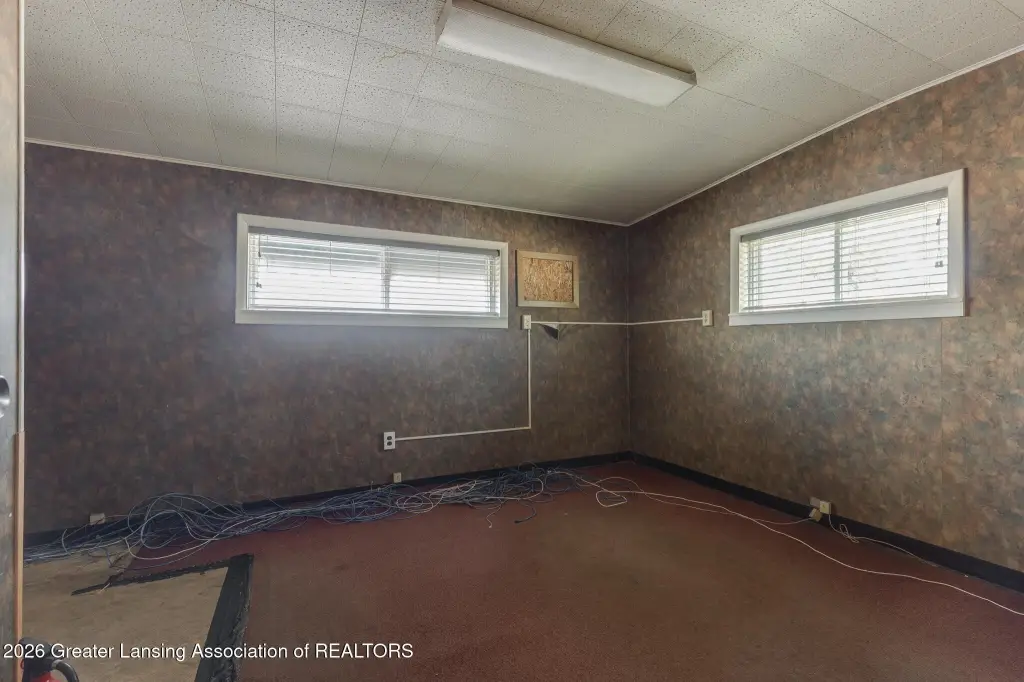
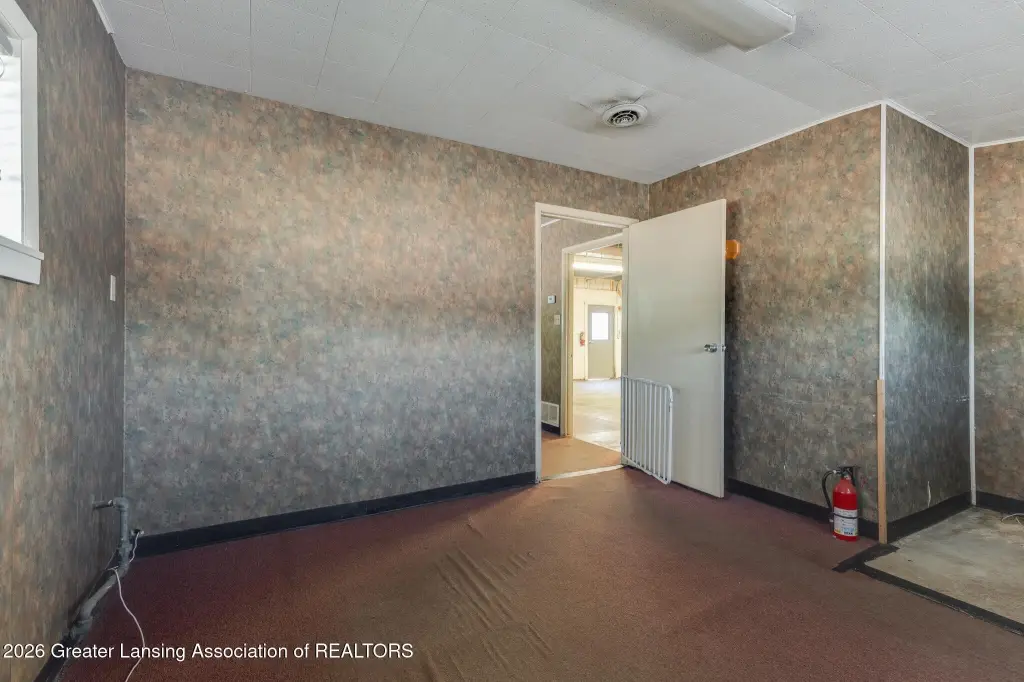
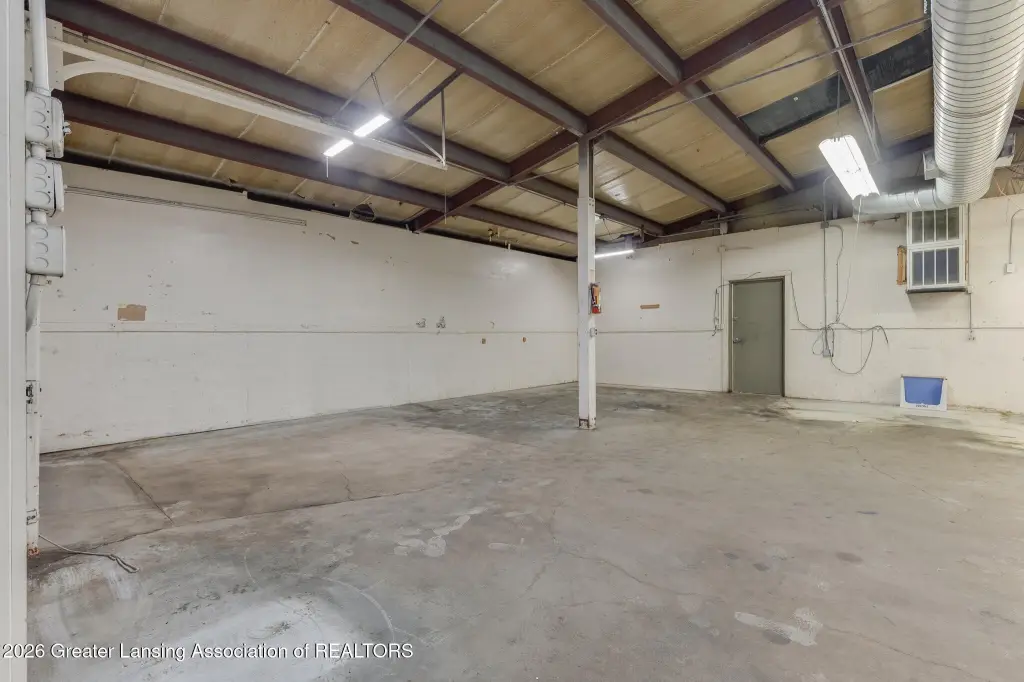
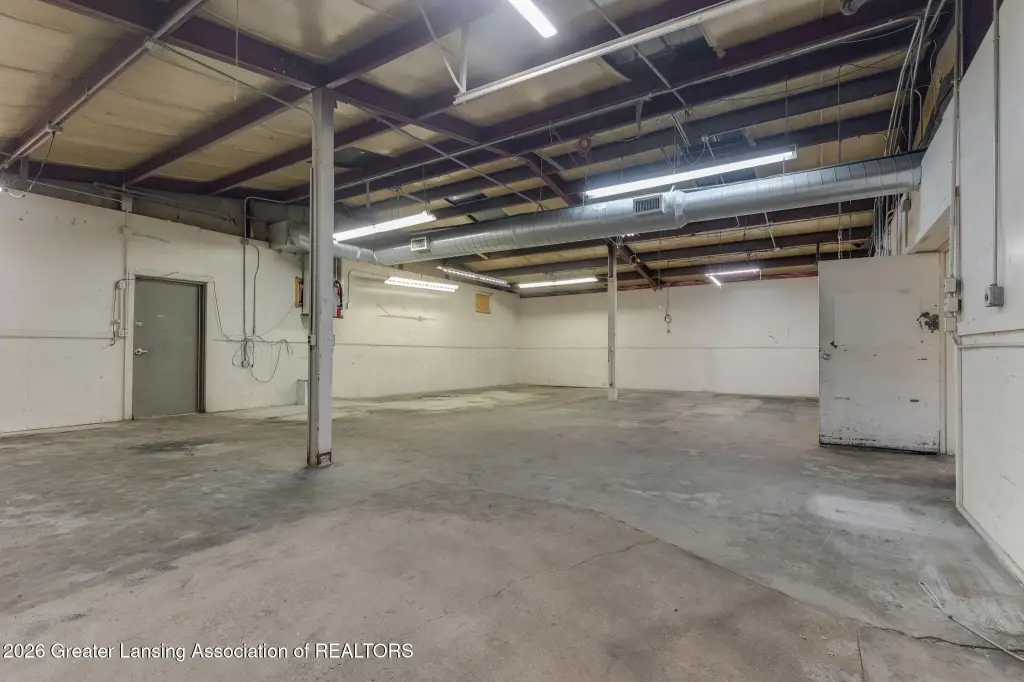
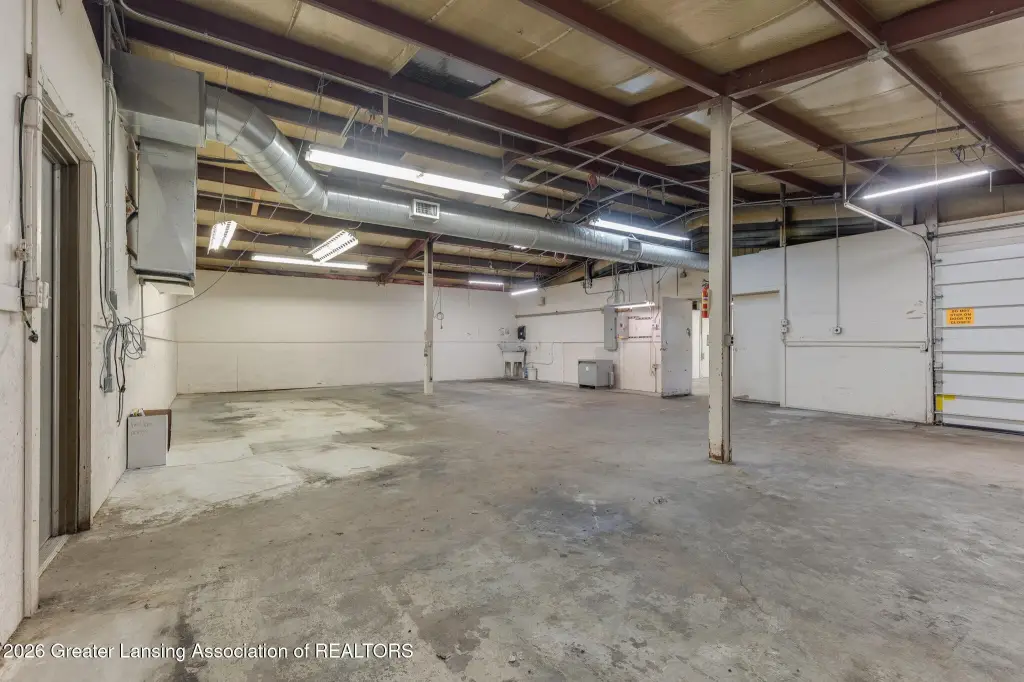
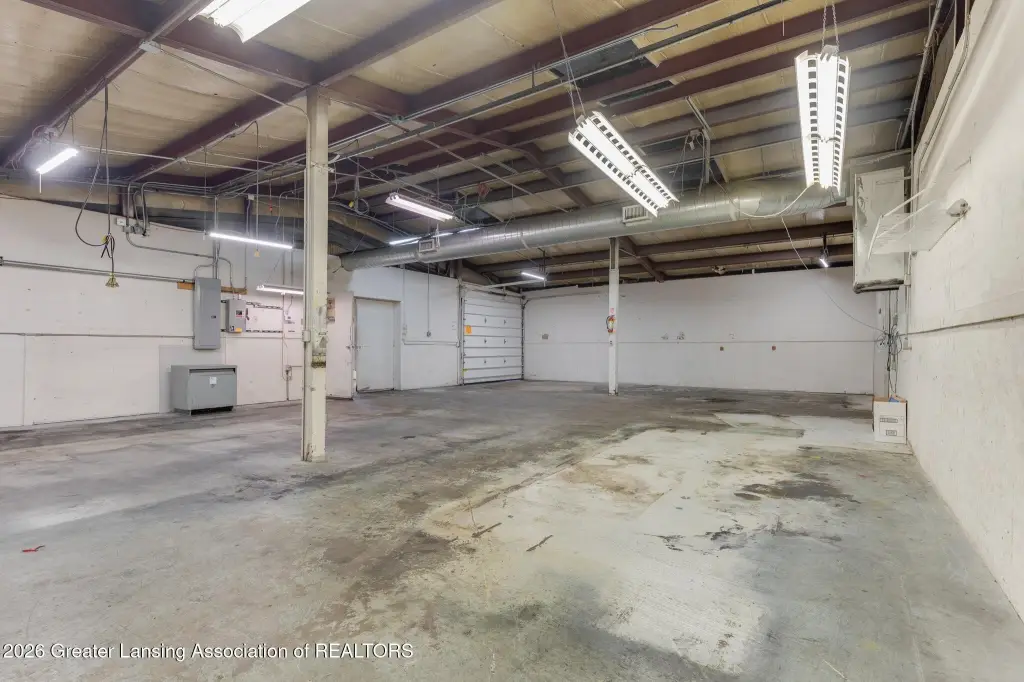
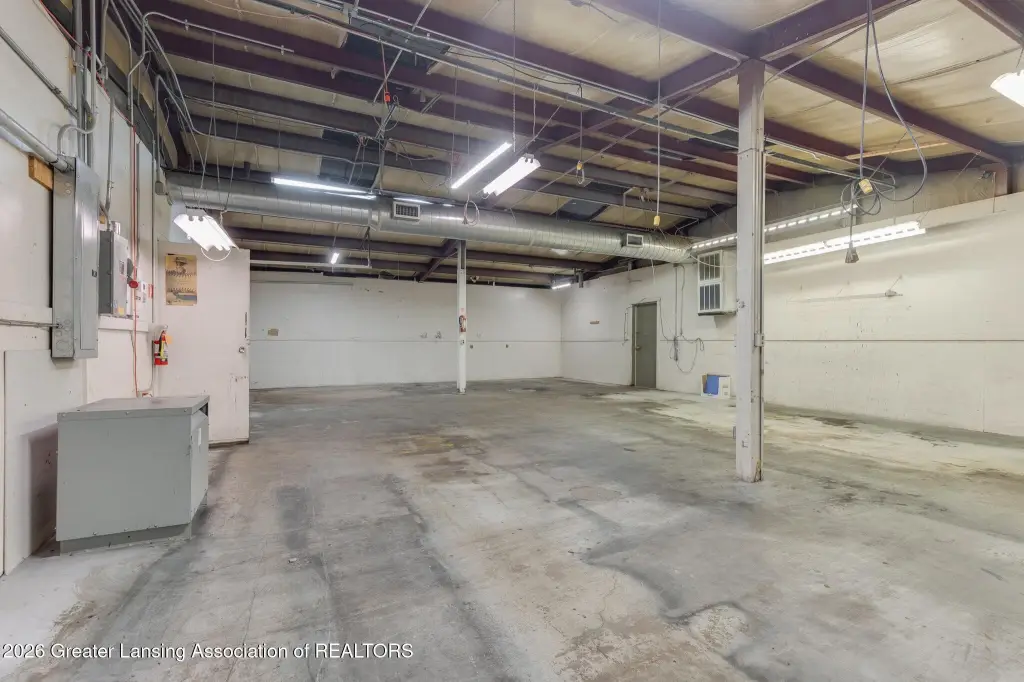
The property combines warehouse, office, and light industrial areas within a 3,315-square-foot building constructed in 1960. Interior features include ceilings ranging from 8 to 13 feet, an 8-foot overhead door, concrete and carpet flooring, and several private offices with reception and supporting workspace. Three-phase power supports industrial equipment, while updated HVAC, forced-air heating, and central air provide building systems suited to year-round occupancy.
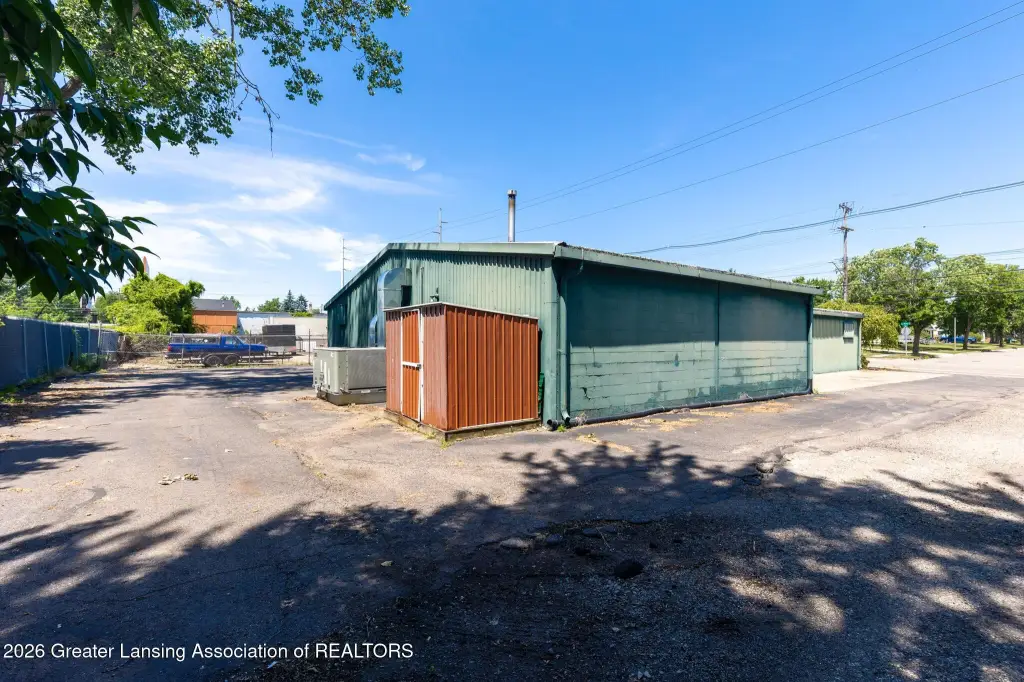
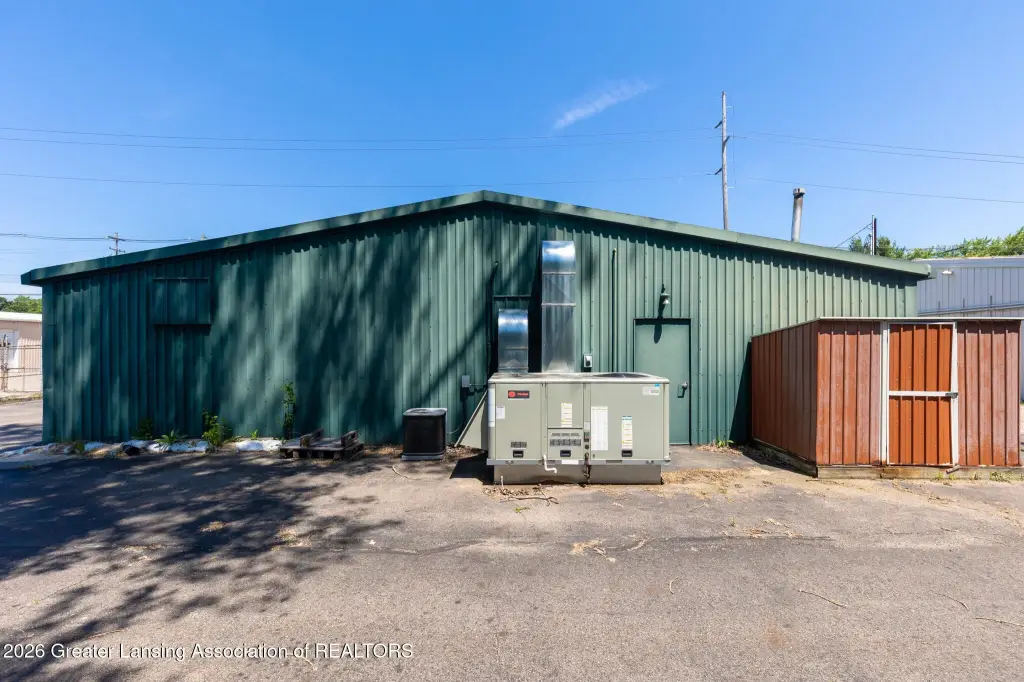
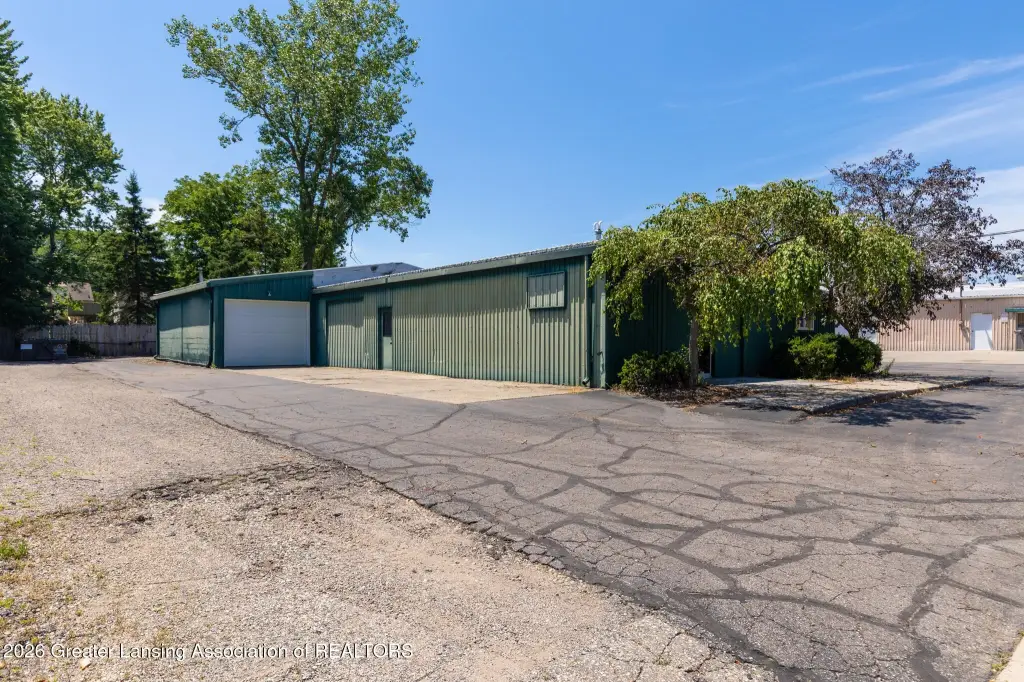
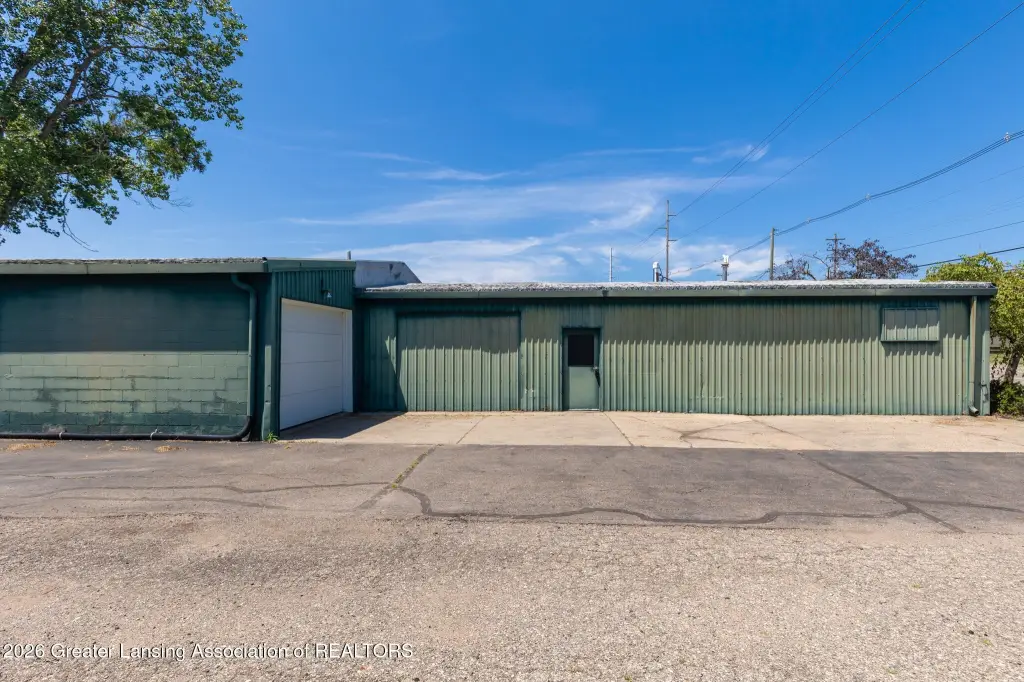
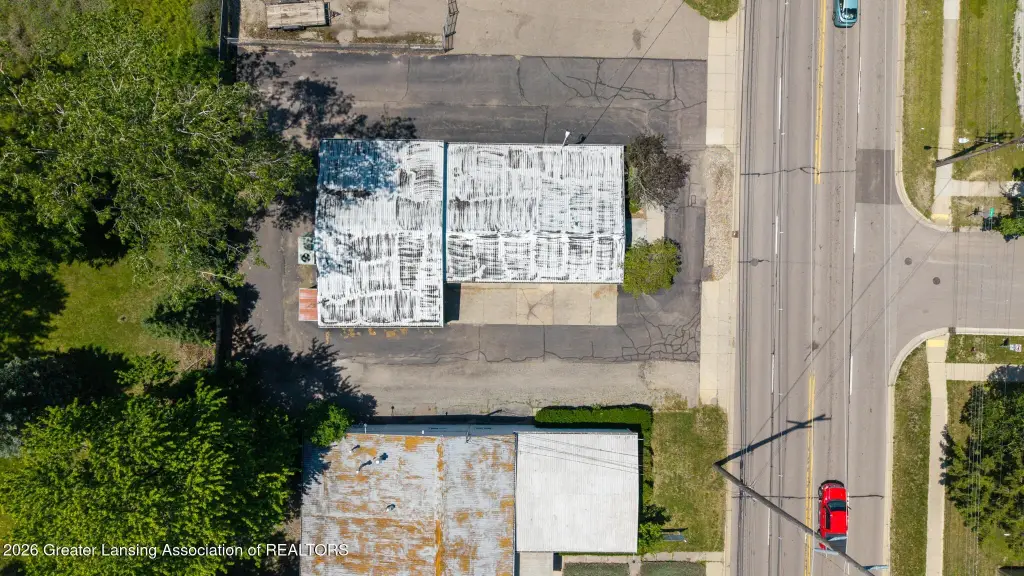
Located at 1020 E Jolly Road in Lansing, the property occupies 0.24 acres and is served by public water and public sewer. The building has aluminum siding and block construction, a metal roof, exterior lighting, and a bathroom. The layout brings together operational, storage, and administrative areas in one commercial facility.
Located at 1020 E Jolly Road in Lansing, the property occupies 0.24 acres and is served by public water and public sewer. The building has aluminum siding and block construction, a metal roof, exterior lighting, and a bathroom. The layout brings together operational, storage, and administrative areas in one commercial facility.
Key Highlights
- 3,315‑square‑foot flex property on 0.24 acres
- Three‑phase power for industrial equipment
- 8- to 13‑foot interior ceilings
Financial Insights
Estimated NOI and Cap Rate
NOI / Yr
$21,539
Cap Rate
8.98%
Suggested Prices Based on Cap Rates
Cap Rate 5%
$430,780
$430.8K
Cap Rate 7%
$307,700
$307.7K
Cap Rate 9%
$239,322
$239.3K
Market Conditions
NOI Build-Up for 3,315 SF
Gross rent
$33.8K $10.20/SF
− Vacancy
−$3.0K −$0.92/SF
EGI
$30.8K $9.28/SF
− OpEx
−$9.2K −$2.78/SF
NOI
$21.5K $6.50/SF
Area
Lansing, MI
Vacancy
9.00%
Lease Rate
$10.20 /SF/Yr
Expense Ratio
30.00%
Simulate Cap Rate and NOI
Suggested Prices Based on Cap Rates
Cap Rate 5%
$430,780
Cap Rate 7%
$307,700
Cap Rate 9%
$239,322
Alternative Uses
Best Use
Warehouse
$382.1K
$334.4K – $445.8K
NOI $26,750 @ 7.0% cap · market cap 11.15%
Second Best
Flex RnD
$365.7K
$320.0K – $426.6K
NOI $25,598 @ 7.0% cap · market cap 10.67%
Theoretical Best
Office A
$682.4K
$597.1K – $796.1K
NOI $47,766 @ 7.0% cap · market cap 19.91%
Zoning and permitted uses should be independently verified with authorities.
Property Analytics
Unlock full access to Insights
Subscribe to Realmo Intelligence
Open Analytics
Current Use
Lease Details
13 ft
Clear height
Location Intelligence
Trade Area within ½ mile
622
Businesses Nearby
Under-served
Demand for This Use
Explore this area
Business Placement
Demographics for 48910, MI
33,702
Population
17,119
Households
2
Avg Household Size
35
Median Age
32%
College-Educated
91%
High-School Grad
14.2 sq mi
ZIP Area
2,373
Density / Sq Mi
$52,154
Median Household Income
$36,643
Median Earnings
$1,003
Median Rent
$117,600
Median Home Value
Check the figures for this property
Cap Rate, Value Estimation, Potential NOI and more
View Realmo Analytics
Market
Vacancy Rate% for Industrial in Midwest region

Questions? Ask Rey
Realmo’s AI knows this listing — price, zoning, demand, history. Ask anything.




Similar Off Market Nearby
- As Good As It Gets — 4130 Chickory Ln, Lansing, MI 48910
Frequently Asked Questions
What type of property is this?
Flex space - Warehouse and office configuration with three-phase power, updated HVAC, and an overhead loading door.
Where is this flex space located?
The property is located at 1020 E Jolly Road Lansing, MI.
What is the asking price?
The asking price for this property is $239,900.
What are key features of this property?
This property features: 3,315‑square‑foot flex property on 0.24 acres; Three‑phase power for industrial equipment; 8- to 13‑foot interior ceilings


