Multi-Building Entertainment Retail
For Sale
Contact for pricing
Pending
102 Bishop Rd., Rockport, TX 78382
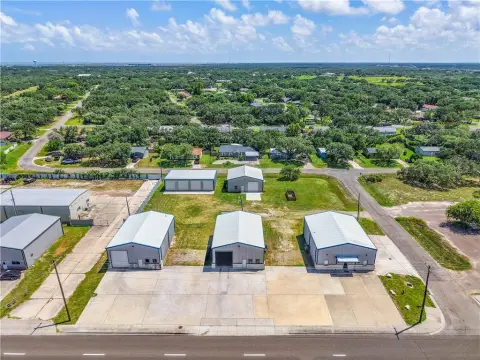
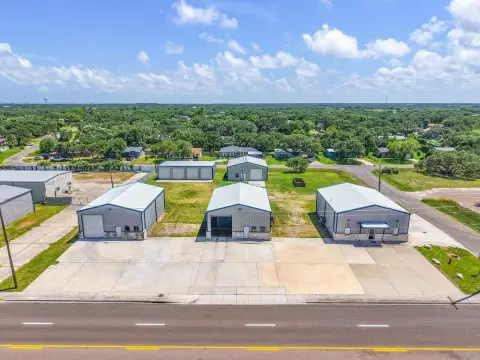
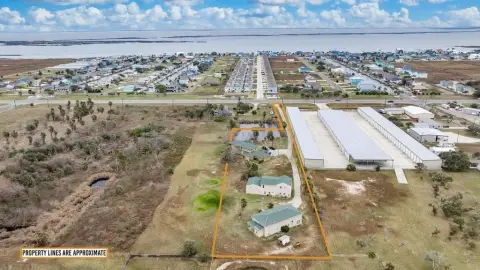
Three separate buildings offer flexible uses for entertainment, retail, or a water vending kiosk.
Property Size6,302 SF
Days on Market117
Property Features for 102 Bishop Rd.
General Information
Standard status
Pending
Size
6,302 SF
Property subtype
Special Purpose
Additional Details
Business Included
Yes
Building Details
Year Built
2005
Year Renovated
2023
Buildings
3
Tenancy
Multi
Listing Agency:
Real Broker, LLC
Listed By:
Oraya Fernandez · License #TX 718576
(254) 833-3379
Source:
Crexi
Added: Jun 2
Changed: Aug 15
Last Checked: Aug 14 at 6:20AM
Displayed information is deemed reliable but is not guaranteed and should be independently verified. All listing content including descriptions, pricing, images are the copyrighted material of Real Broker, LLC
Investment Insights
Based on property information with market context.
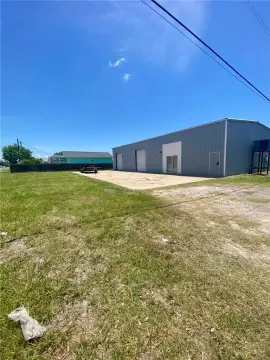
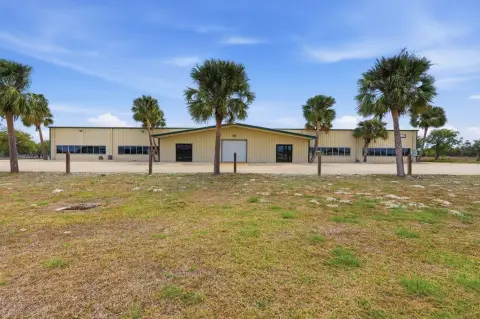
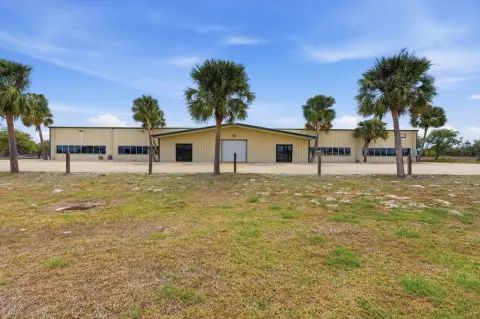
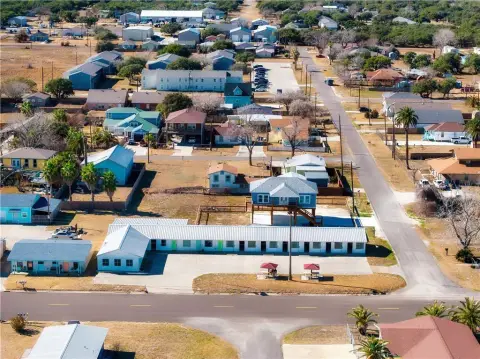
This offering includes three separate commercial buildings designed for flexible use. The large building is a brand new metal structure outfitted for a golf simulation lounge and a multi-age entertainment center. The medium building is currently an active mixed-use space with entertainment and retail operations in place. The small building is a water vending kiosk with a commercial water dispenser system, ready to operate for additional income.
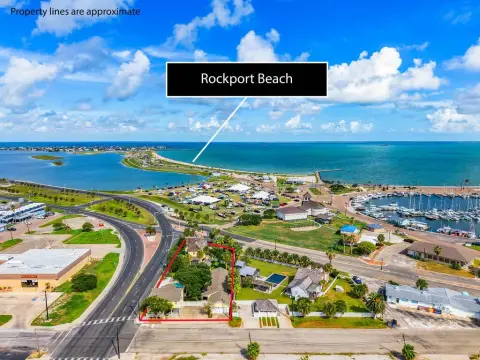
The property is located in a coastal setting with water views across the street. The site can be operated as a unified entertainment destination or configured as individual leased spaces.
For buyers or operators, the layout supports two practical approaches: use the entire site as a single entertainment complex to bring multiple concepts under one roof, or lease the buildings individually to create a collaborative merchant environment with shared traffic. With entertainment-focused space already set up in the large building and operating components in the medium and small buildings, this property is suited for an owner-operator or a tenant group looking to coordinate compatible uses across multiple structures at the same site. Owner operating.
The property is located in a coastal setting with water views across the street. The site can be operated as a unified entertainment destination or configured as individual leased spaces.
For buyers or operators, the layout supports two practical approaches: use the entire site as a single entertainment complex to bring multiple concepts under one roof, or lease the buildings individually to create a collaborative merchant environment with shared traffic. With entertainment-focused space already set up in the large building and operating components in the medium and small buildings, this property is suited for an owner-operator or a tenant group looking to coordinate compatible uses across multiple structures at the same site. Owner operating.
Key Highlights
- Three separate commercial buildings with flexible use options for entertainment, retail, or a water vending kiosk (3 structures on one site).
- Large building (built 2005) is a brand new metal structure outfitted for a golf simulation lounge and multi‑age entertainment center.
- Medium building has active mixed‑use space with entertainment and retail operations already in place.
Property Analytics
Unlock full access to Insights
Subscribe to Realmo Intelligence
Open Analytics
Current Use
Lease Details
Turnkey business
Opportunity
Location Intelligence
Trade Area within ½ mile
101
Businesses Nearby
Explore this area
Business Placement
Demographics for 78382, TX
19,432
Population
13,048
Households
1.5
Avg Household Size
53
Median Age
30%
College-Educated
92%
High-School Grad
79.9 sq mi
ZIP Area
243
Density / Sq Mi
$63,434
Median Household Income
$38,741
Median Earnings
$1,147
Median Rent
$238,200
Median Home Value
Check the figures for this property
Cap Rate, Value Estimation, Potential NOI and more
View Realmo Analytics

Questions? Ask Rey
Realmo’s AI knows this listing — price, zoning, demand, history. Ask anything.



Frequently Asked Questions
What type of property is this?
Golf course & driving range - Three separate buildings offer flexible uses for entertainment, retail, or a water vending kiosk.
Where is this golf course & driving range located?
The property is located at 102 Bishop Rd. Rockport, TX.
What is the asking price?
The asking price for this property is $999,000.
What are key features of this property?
This property features: Three separate commercial buildings with flexible use options for entertainment, retail, or a water vending kiosk (3 structures on one site).; Large building (built 2005) is a brand new metal structure outfitted for a golf simulation lounge and multi‑age entertainment center.; Medium building has active mixed‑use space with entertainment and retail operations already in place.



