Ozone Park Two-Family
For Sale
$945,000
10152 102nd Street Ozone, Ozone Park, NY 11416
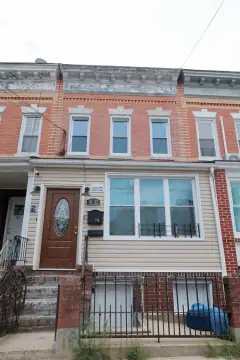
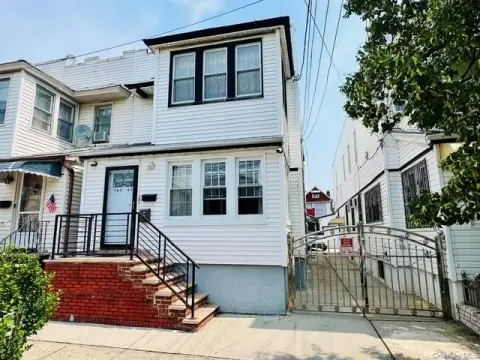
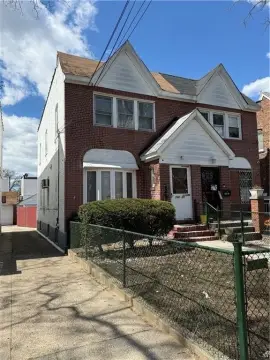
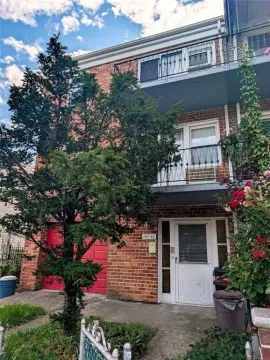
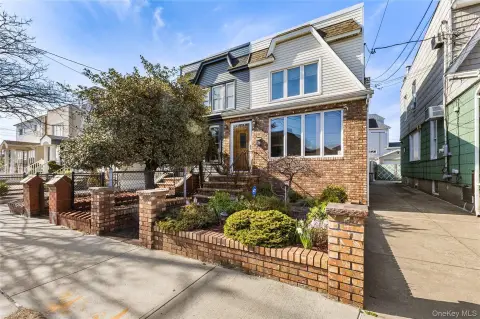
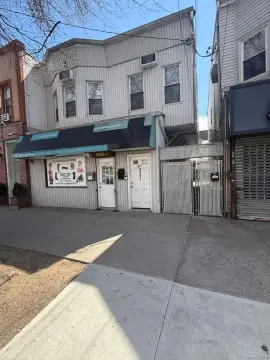
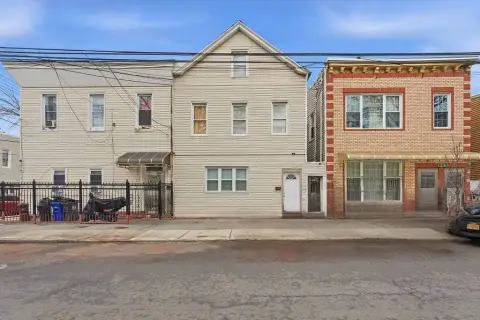
Two-family home with parking, garage, and finished basement.
Property Size1,926 SF
Days on Market240
Property Features for 10152 102nd Street Ozone
General Information
Standard status
Active
Size
1,926 SF
Property subtype
Multi-Family
Amenities
A/C Unit
A/C Unit - Wall
A/C Unit - Window
Steam/Radiator
Gas
microwave
refrigerator
stove
Pool, Porch, Asphalt/Tar, Flat
Building Details
Building Size
1,926 SF
Year Built
1920
Stories
2
Listing Agency:
NYC - Queens/Bayside
Listed By:
Carl Franklyn Jr · License #10401358447
(929) 479-4791
Source:
Kw
Added: Feb 12
Changed: Oct 10
Last Checked: Oct 9 at 6:10PM
Displayed information is deemed reliable but is not guaranteed and should be independently verified. All listing content including descriptions, pricing, images are the copyrighted material of NYC - Queens/Bayside
Investment Insights
Based on property information with market context.
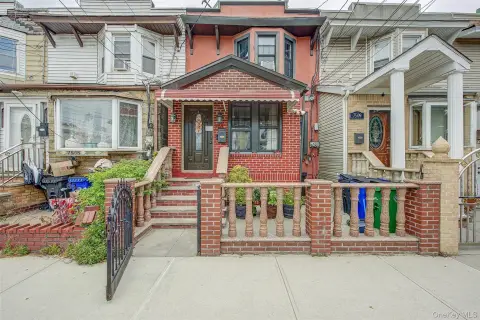
This fully detached two-family home is located in Ozone Park. Each unit features 2 bedrooms and 1 full bathroom, providing comfortable living spaces. The first-floor unit includes laundry hookups. The second-floor unit offers a bonus room suitable for a home office, nursery, guest room, or extra storage. The property includes a front porch, private parking, and a garage. The fully finished basement has separate entrances from both inside and outside. The property can be delivered vacant, offering flexibility for various living arrangements.
Key Highlights
- Fully detached two‑family home delivered vacant, offering flexibility for owner‑occupancy or rental income.
- Private parking and garage provide rare convenience in Ozone Park.
- Finished basement with separate entrances offers potential for additional living space or rental income.
Financial Insights
Estimated NOI and Cap Rate
NOI / Yr
$47,080
Cap Rate
4.98%
Suggested Prices Based on Cap Rates
Cap Rate 5%
$941,600
$941.6K
Cap Rate 7%
$672,571
$672.6K
Cap Rate 9%
$523,111
$523.1K
Market Conditions
NOI Build-Up for 1,926 SF
Gross rent
$89.0K $46.20/SF
− Vacancy
−$3.4K −$1.76/SF
EGI
$85.6K $44.44/SF
− OpEx
−$38.5K −$20.00/SF
NOI
$47.1K $24.44/SF
Area
Queens County, NY
Vacancy
3.80%
Lease Rate
$46.20 /SF/Yr
Expense Ratio
45.00%
Simulate Cap Rate and NOI
Suggested Prices Based on Cap Rates
Cap Rate 5%
$941,600
Cap Rate 7%
$672,571
Cap Rate 9%
$523,111
Alternative Uses
Best Use
Apartment 5plus
$672.6K
$588.5K – $784.7K
NOI $47,080 @ 7.0% cap · market cap 4.98%
Second Best
Multifamily LT 5
$455.4K
$398.5K – $531.3K
NOI $31,878 @ 7.0% cap · market cap 3.37%
Theoretical Best
Office A
$1.42M
$1.24M – $1.66M
NOI $99,391 @ 7.0% cap · market cap 10.52%
Zoning and permitted uses should be independently verified with authorities.
Property Analytics
Unlock full access to Insights
Subscribe to Realmo Intelligence
Open Analytics
Current Use
Location Intelligence
Trade Area within ½ mile
3,179
Businesses Nearby
Explore this area
Business Placement
Demographics for 11416, NY
28,381
Population
8,047
Households
3.5
Avg Household Size
35
Median Age
25%
College-Educated
78%
High-School Grad
0.7 sq mi
ZIP Area
40,544
Density / Sq Mi
$85,544
Median Household Income
$43,899
Median Earnings
$1,964
Median Rent
$733,500
Median Home Value
Check the figures for this property
Cap Rate, Value Estimation, Potential NOI and more
View Realmo Analytics
Market
Vacancy Rate% for Multifamily in Northeast region

Questions? Ask Rey
Realmo’s AI knows this listing — price, zoning, demand, history. Ask anything.


Frequently Asked Questions
What type of property is this?
Duplex - Two-family home with parking, garage, and finished basement.
Where is this duplex located?
The property is located at 10152 102nd Street Ozone Ozone Park, NY.
What is the asking price?
The asking price for this property is $945,000.
What are key features of this property?
This property features: Fully detached two‑family home delivered vacant, offering flexibility for owner‑occupancy or rental income.; Private parking and garage provide rare convenience in Ozone Park.; Finished basement with separate entrances offers potential for additional living space or rental income.


