Single-Tenant Net-Leased
For Sale
$3,993,600
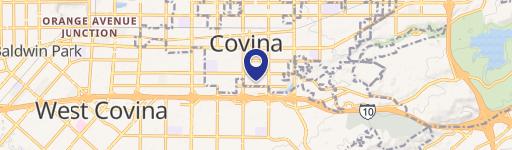
1010 E Arrow Hwy, Covina, CA 91724
Freestanding pharmacy building on a C-4 zoned site with 45 surface parking spaces.
Property Size9,590 SF
Lot Size0.88 Acres
Price / SF$416.43
Days on Market126
Property Features for 1010 E Arrow Hwy
General Information
Standard status
Active
Size
9,590 SF
Total Parking Spaces
45
Lot size
0.88 Acres
Property subtype
Drug Store
Zoning
C-4
Lease Type
NNN
Site & Location
Highway Access
Yes
Road Access
Yes
Amenities
Single Tenant Net Leased Polaris Pharmacy – 2+ Years Remaining – 4% Annual Increases – Ease of management limited landlord responsibilities
Zoned Retail C-4 – General Commercial – Versatile & Desirable Zoning
Freestanding 9,590 SF building on 0.88 AC with ample parking (45 surface, 30 reserved; 75 total spaces)
Polaris Pharmacy Services is a rapidly growing healthcare operator with more than 20 pharmacy locations nationwide, serving long-term care, specialty pharmacy, and post-acute healthcare markets across the United States
Recession-Resistant Asset Class – Healthcare and pharmacy-related real estate is generally considered defensive due to long-term demand drivers tied to aging demographics and ongoing healthcare needs.
Strategic San Gabriel Valley Location – Located along the Arrow Highway corridor with access to the I-10, SR-57, and I-210 freeways, the property benefits from strong connectivity throughout Los Angeles County and the Inland Empire.
Building Details
Building Size
9,590 SF
Tenancy
Single
Listing Agency:
Encino Office
Listed By:
Jason Anguiano · License #License(s): CA: 01979811
(213) 943-1882
Source:
Marcusmillichap
Added: Jun 17
Changed: Oct 8
Last Checked: Oct 19 at 3:13AM
Displayed information is deemed reliable but is not guaranteed and should be independently verified. All listing content including descriptions, pricing, images are the copyrighted material of Encino Office

Ask AI about this property
Review the available facts, identify missing information and prepare questions for the agent.
Investment Insights
Based on property information with market context.
This single-tenant, net-leased Polaris Pharmacy property includes a freestanding 9,590-square-foot building on approximately 0.88 acres. The site offers 45 surface parking spaces to support employee and operational needs. The asset has more than two years remaining on the lease term, with 4% annual rental increases.
The property is located on Arrow Highway in Covina within the San Gabriel Valley. It is described as having strong connectivity to major freeways, including I-10, SR-57, and I-210.
Zoned C-4 General Commercial, the property is positioned for long-term flexibility under a broadly utilized commercial zoning designation.
The property is located on Arrow Highway in Covina within the San Gabriel Valley. It is described as having strong connectivity to major freeways, including I-10, SR-57, and I-210.
Zoned C-4 General Commercial, the property is positioned for long-term flexibility under a broadly utilized commercial zoning designation.
Key Highlights
- Single‑tenant net‑leased Polaris Pharmacy property with over two years of remaining lease term
- Freestanding 9,590 SF building on approximately 0.88 acres with 45 surface parking spaces
- 4% annual rental increases as part of the existing lease
Financial Insights
Estimated NOI and Cap Rate
NOI / Yr
$227,330
Cap Rate
5.69%
Suggested Prices Based on Cap Rates
Cap Rate 5%
$4,546,600
$4.5M
Cap Rate 7%
$3,247,571
$3.2M
Cap Rate 9%
$2,525,889
$2.5M
Market Conditions
NOI Build-Up for 9,590 SF
Gross rent
$324.5K $33.84/SF
− Vacancy
−$21.4K −$2.23/SF
EGI
$303.1K $31.61/SF
− OpEx
−$75.8K −$7.90/SF
NOI
$227.3K $23.70/SF
Area
Los Angeles County, CA
Vacancy
6.60%
Lease Rate
$33.84 /SF/Yr
Expense Ratio
25.00%
Simulate Cap Rate and NOI
Suggested Prices Based on Cap Rates
Cap Rate 5%
$4,546,600
Cap Rate 7%
$3,247,571
Cap Rate 9%
$2,525,889
Alternative Uses
Best Use
Specialty Retail
$3.25M
$2.84M – $3.79M
NOI $227,330 @ 7.0% cap · market cap 5.69%
Second Best
Retail
$3.03M
$2.65M – $3.54M
NOI $212,175 @ 7.0% cap · market cap 5.31%
Theoretical Best
Office A
$5.13M
$4.49M – $5.99M
NOI $359,411 @ 7.0% cap · market cap 9.00%
Zoning and permitted uses should be independently verified with authorities.
How Realmo checks its estimates
Property Analytics
Unlock full access to Insights
Subscribe to Realmo Intelligence
Open Analytics
Current Use
Lease Details
Single-tenant
Tenancy
Yes
Highway access
Yes
Paved road access
Location Intelligence
Trade Area within ½ mile
812
Businesses Nearby
126k
Monthly Visits Nearby
Balanced
Demand for This Use
Explore this area
Business Placement
Foot Traffic Nearby
Dining 81%
Shops & Services 18%
Home Improvements & Furnishings 1%
In-N-Out Burger
Dining
39,675 visits/mo
0.2 miles
McDonald's
Dining
28,270 visits/mo
0.4 miles
Taco Bell
Dining
12,706 visits/mo
0.4 miles
Yum Yum Donuts
Dining
9,990 visits/mo
0.1 miles
7-Eleven
Shops & Services
8,208 visits/mo
0.4 miles
Demographics for 91724, CA
27,180
Population
9,372
Households
2.9
Avg Household Size
41
Median Age
36%
College-Educated
91%
High-School Grad
6.2 sq mi
ZIP Area
4,384
Density / Sq Mi
$102,129
Median Household Income
$49,276
Median Earnings
$2,056
Median Rent
$722,600
Median Home Value
Check the figures for this property
Cap Rate, Value Estimation, Potential NOI and more
View Realmo Analytics
Market
Vacancy Rate% for Retail in West region




Similar Off Market Nearby
- Calix Drugs Pharmacy Inc. — 944 N Grand Ave, Covina, CA 91724
- Konfident Kurves — 970 N Grand Ave, Covina, CA 91724
- Unik beauty salon nails and spa — Grand Ave, Covina, CA 91724
- Hai Au H. Luu, Pharm — 1161 E Covina Blvd, Covina, CA 91724
- Natural Amor — 740C Arrow Hwy, Covina, CA 91722
Frequently Asked Questions
What type of property is this?
Drug store - Freestanding pharmacy building on a C-4 zoned site with 45 surface parking spaces.
Where is this drug store located?
The property is located at 1010 E Arrow Hwy Covina, CA.
What is the asking price?
The asking price for this property is $3,993,600.
What are key features of this property?
This property features: Single‑tenant net‑leased Polaris Pharmacy property with over two years of remaining lease term; Freestanding 9,590 SF building on approximately 0.88 acres with 45 surface parking spaces; 4% annual rental increases as part of the existing lease


