Five-Unit Apartment
For Sale
$675,000
1007 W 9th Street, Medford, OR 97501
Residential Income, Medford, OR
Property Size5,220 SF
Lot Size0.24 Acres
Price / SF$129.31
Days on Market50
Property Features for 1007 W 9th Street
General Information
Property type
Residential Multi Family
Property subtype
Other
Zoning description
Mfr-20
Parking features
On Street, Alley, Garage, Open, Assigned
Window features
Double Pane Windows
Interior features
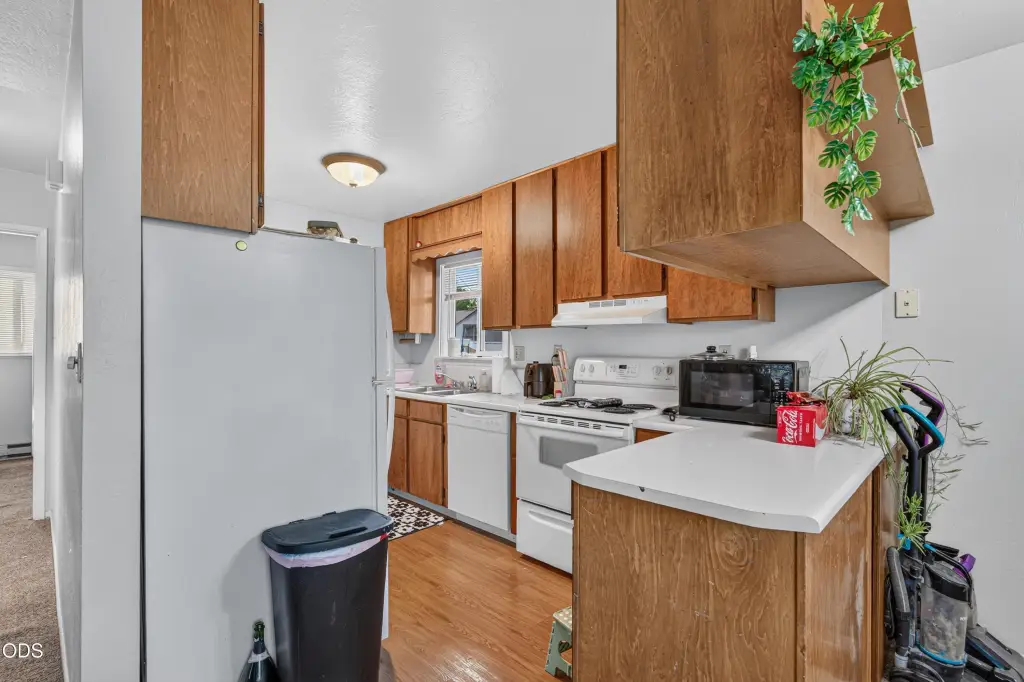
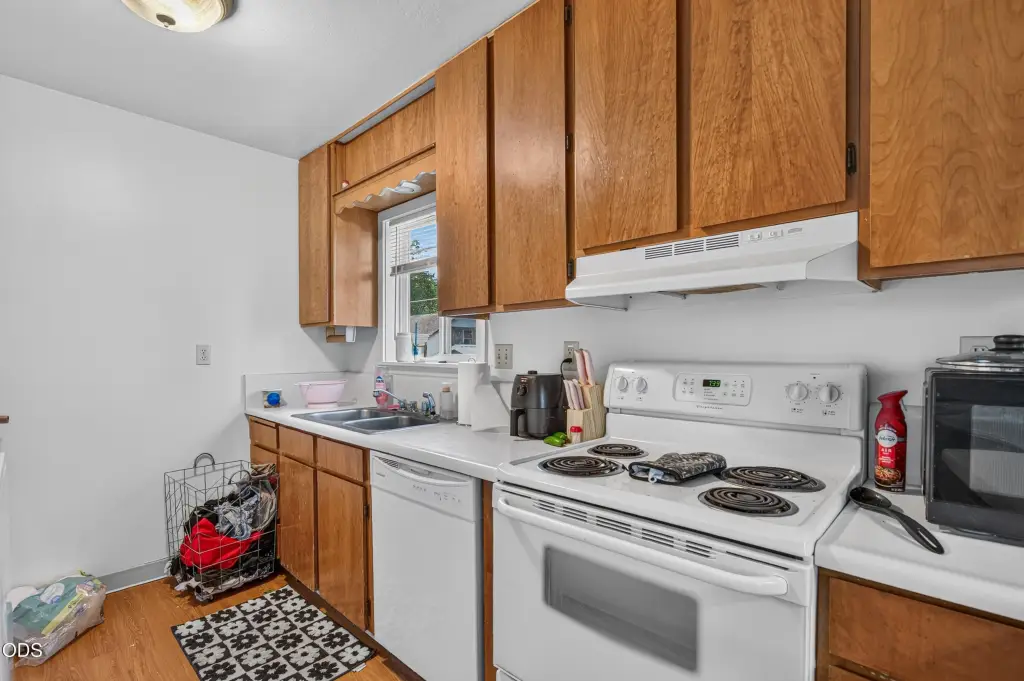
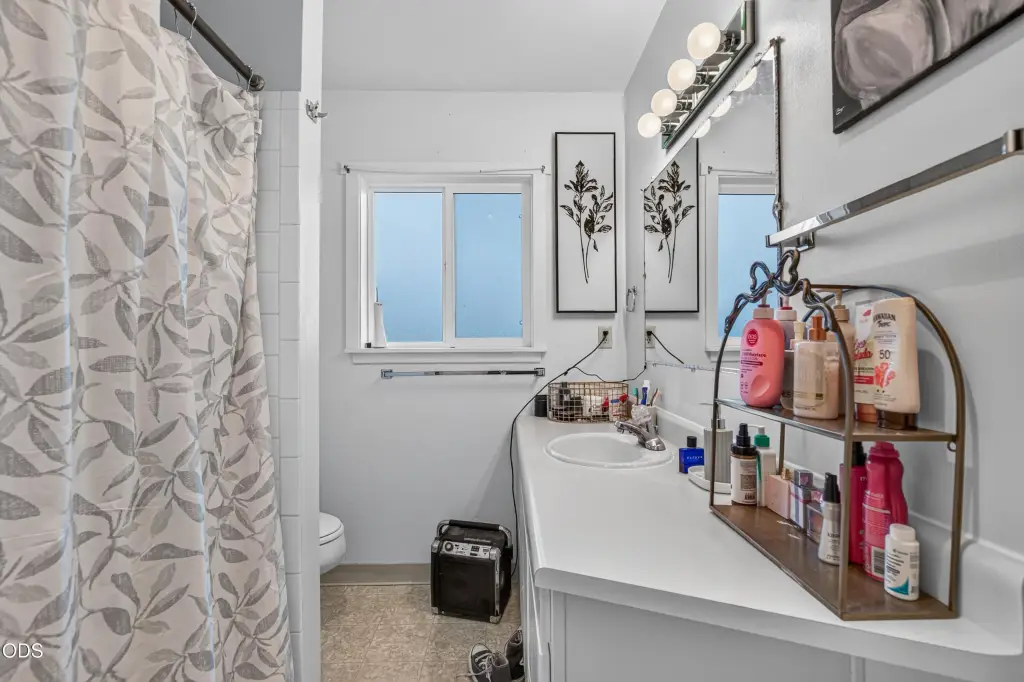
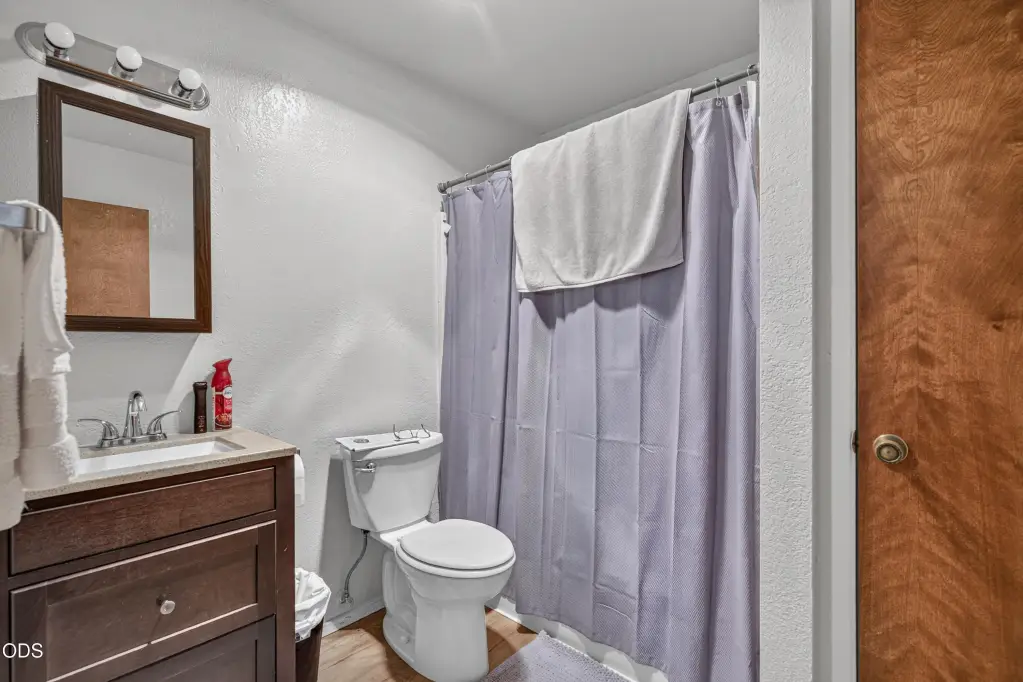
Laminate Counters, Linen Closet, Shower/Tub Combo
Appliances
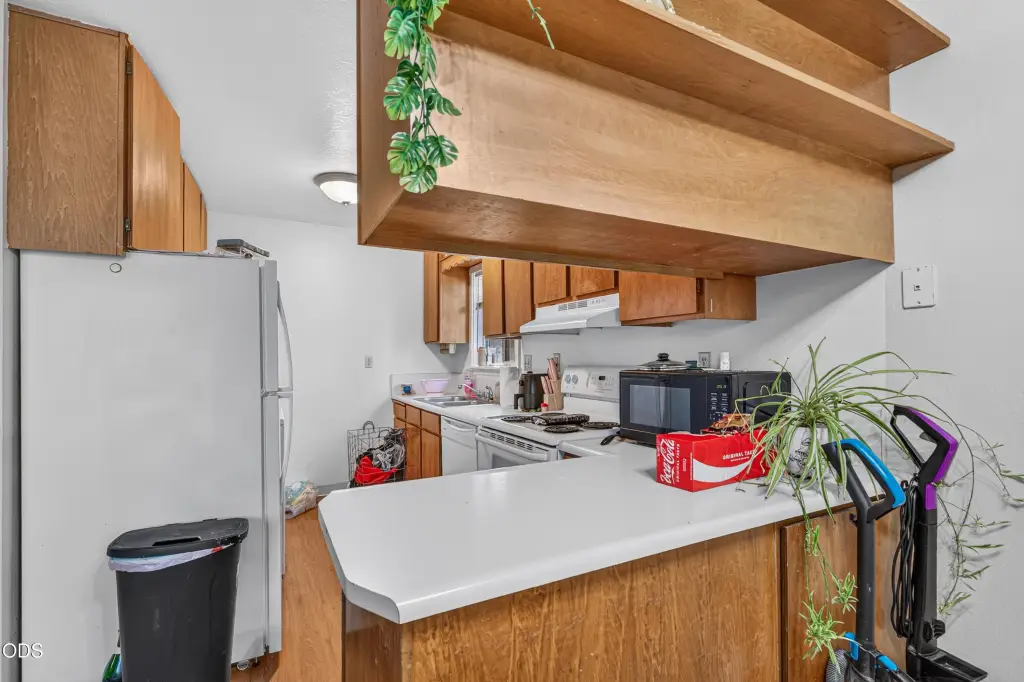
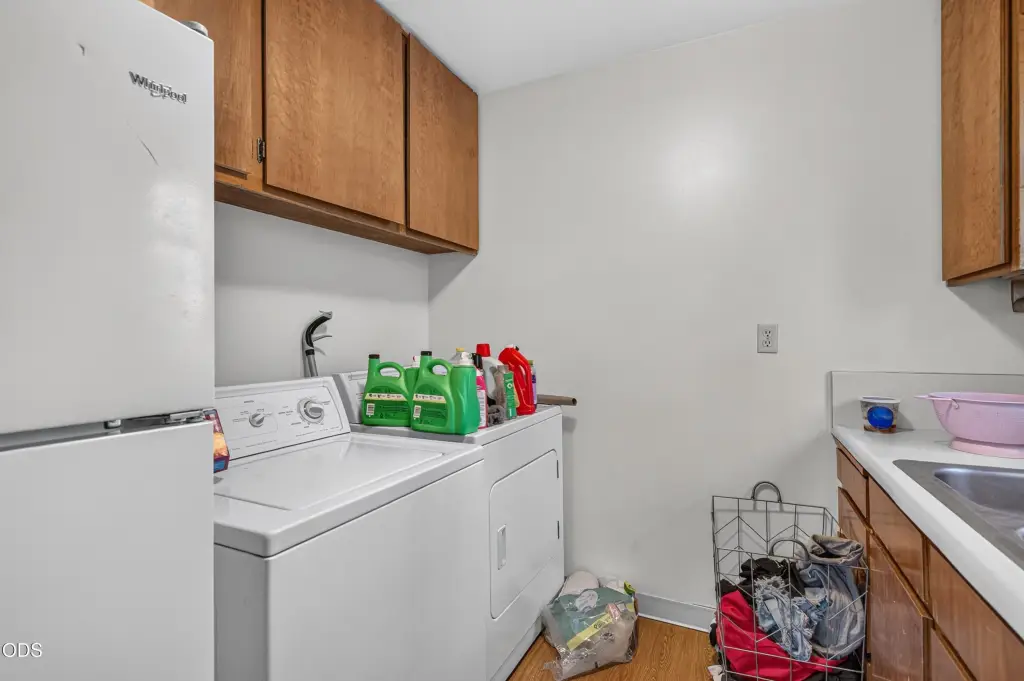
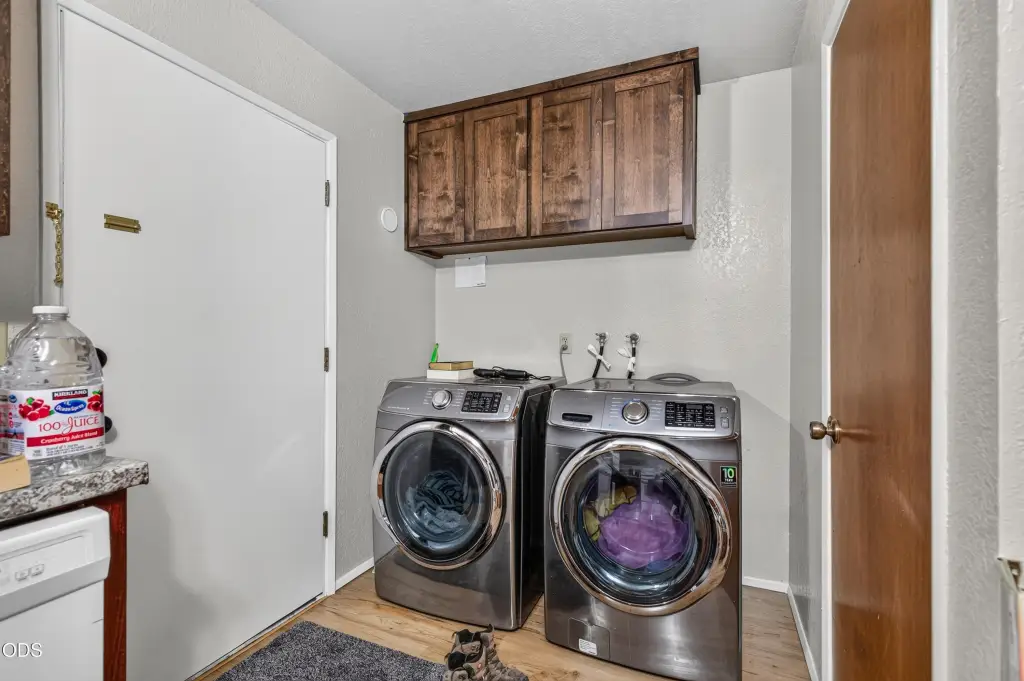
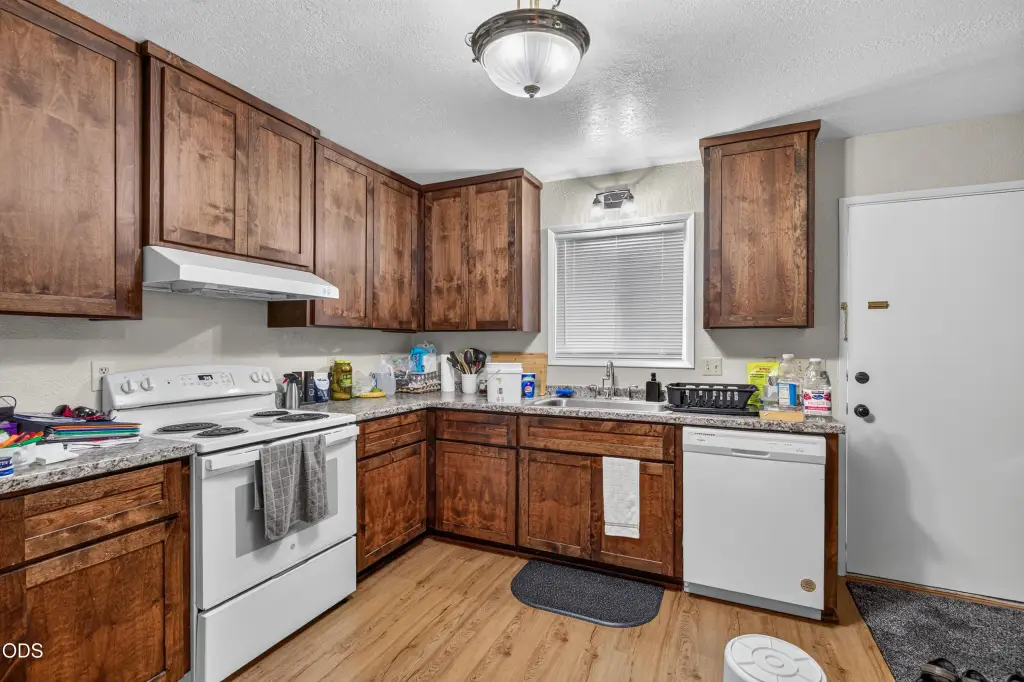
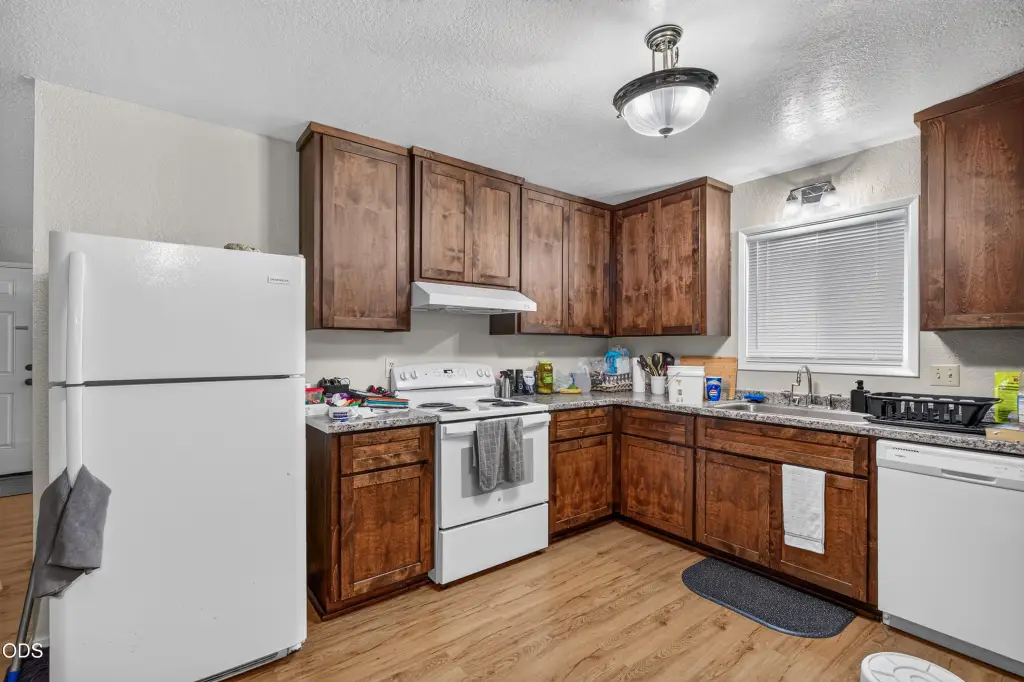
Dishwasher, Disposal, Dryer, Oven, Range, Range Hood, Refrigerator, Washer, Water Heater
Subdivision
Ross Addition
Lot features
Landscaped, Level
Elementary school
Washington Elem
Middle school
Oakdale Middle
High school
South Medford High
Directions
From I-5N, take exit 27 and turn left. Turn right onto Hwy 99N and left onto 10th St. Take a right on TBD. S Orange St and a left onto W 9th St. The homes will be on your left.
Standard status
Active
APN
10410032
Size
5,220 SF
Lot size
0.24 Acres
Taxes and HOA fees
Tax Year
2026
Tax Annual Amount
6360
Utilities
Sewer type
Public Sewer
Heating system
Energy Star Qualified Equipment (Heating), Forced Air
Cooling system
Heat Pump, ENERGY STAR Qualified Equipment
Water source
Public
Building Details
Year built
1968
Floors in Building
1
Number of units
5
Flooring type
Laminate, Carpet
Building materials
Frame
Roof type
Asphalt
Architectural style
Other
Additional Structures
Workshop
Listing Agency:
John L Scott Ashland · John L. Scott
(541) 488-1311
Listed By:
Carrie Dahle
(541) 821-8284
Added: Sep 7
Changed: Oct 22
Last Checked: Oct 26 at 3:06AM
MLS# 220228305
Copyright © 2026 Oregon Data Share. All rights reserved. All information provided by the listing agent/broker is deemed reliable but is not guaranteed and should be independently verified.

Ask AI about this property
Review the available facts, identify missing information and prepare questions for the agent.
Investment Insights
Based on property information with market context.
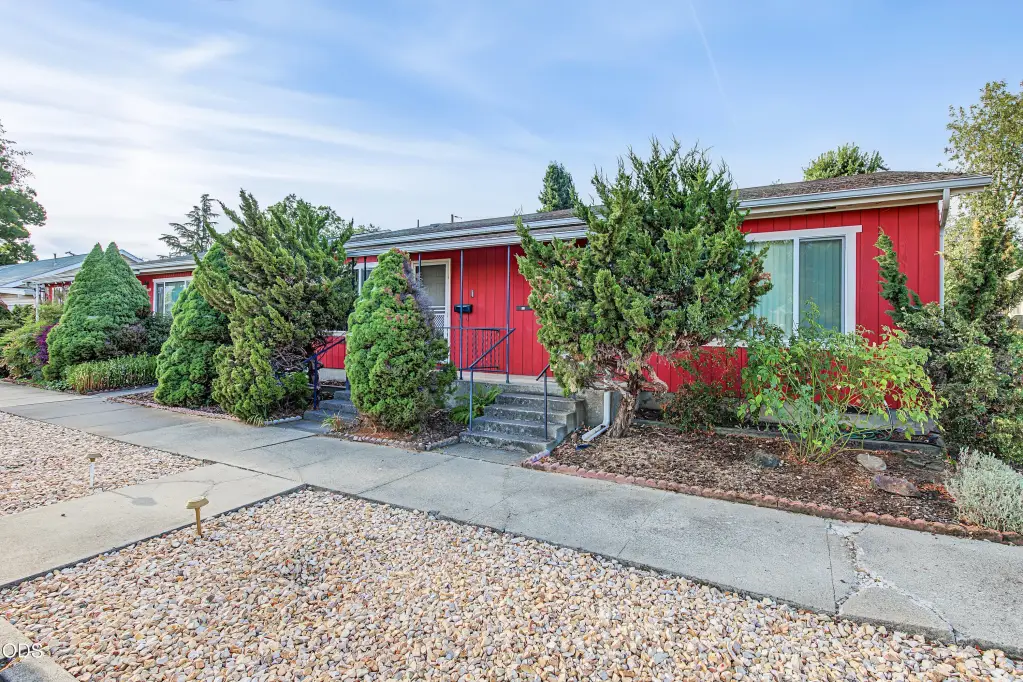
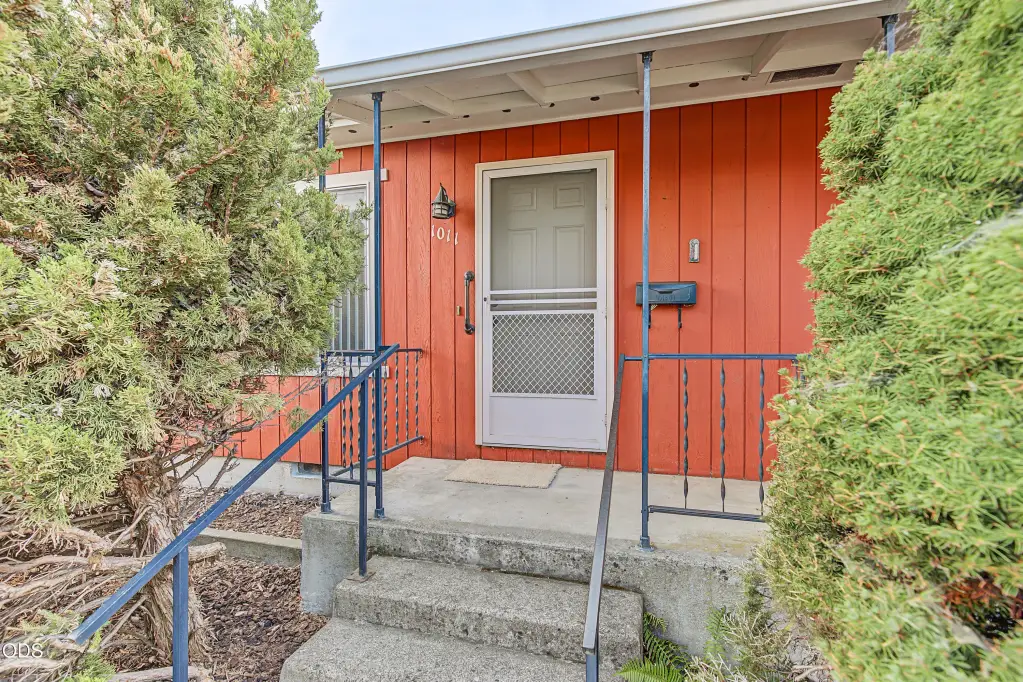
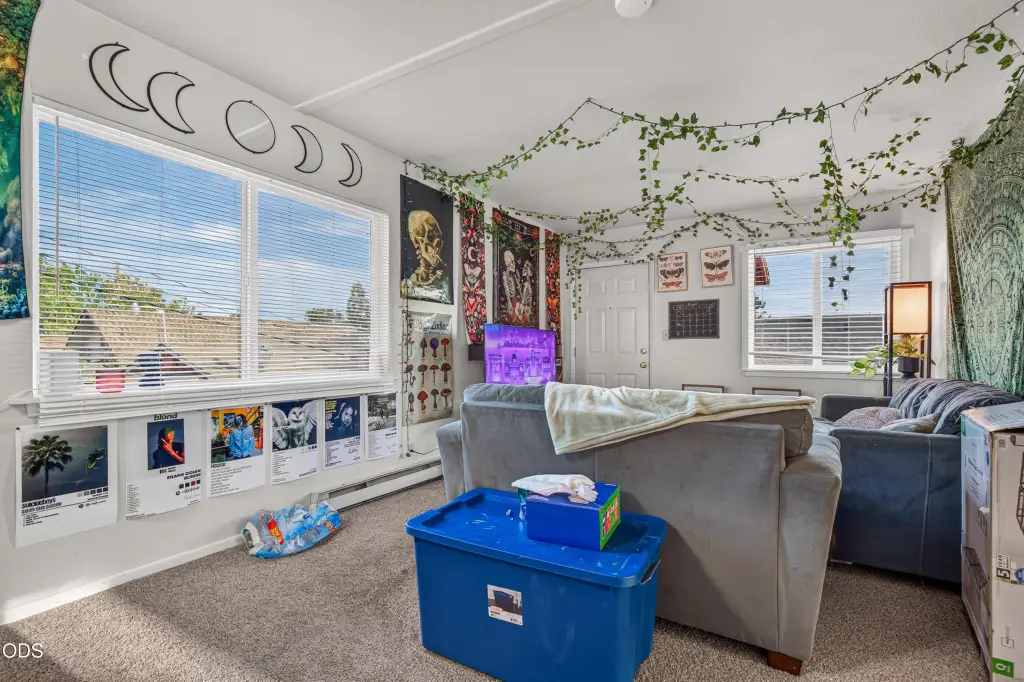
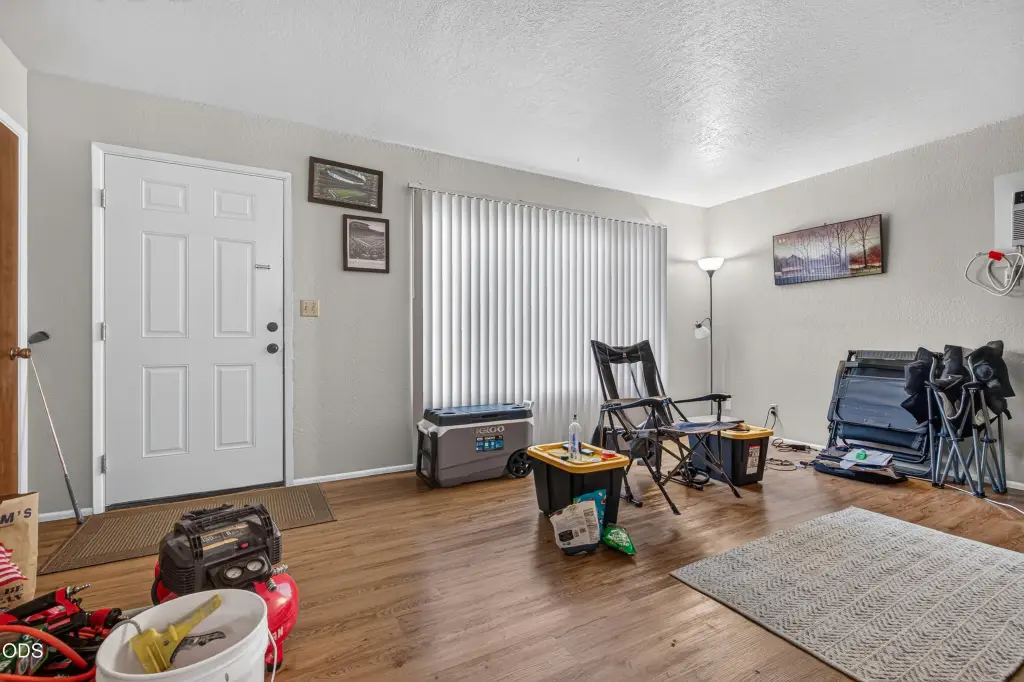
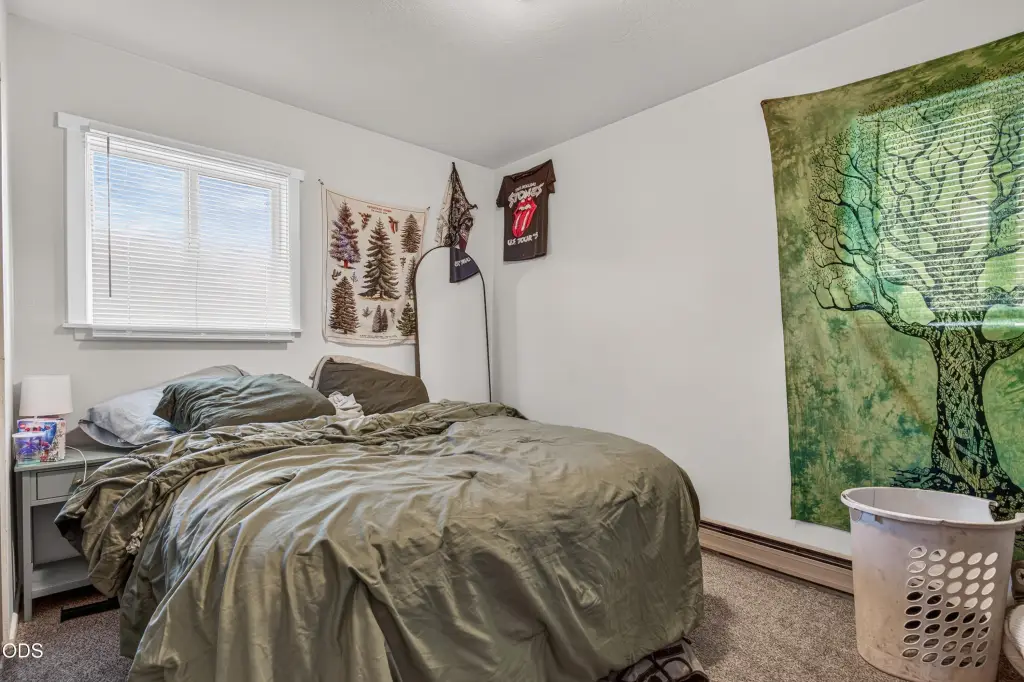
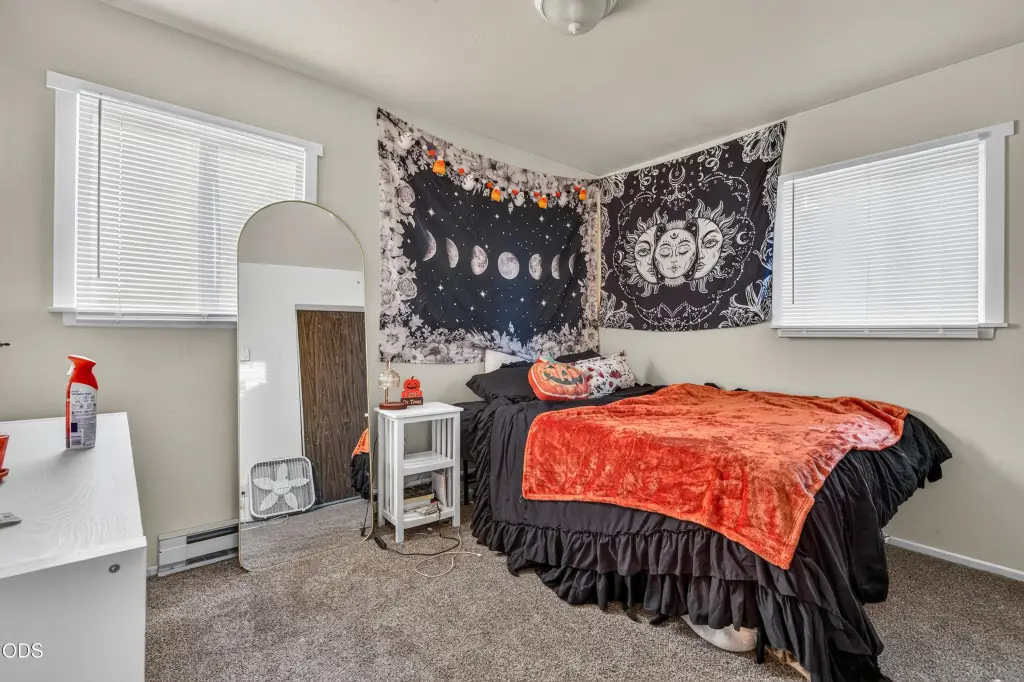
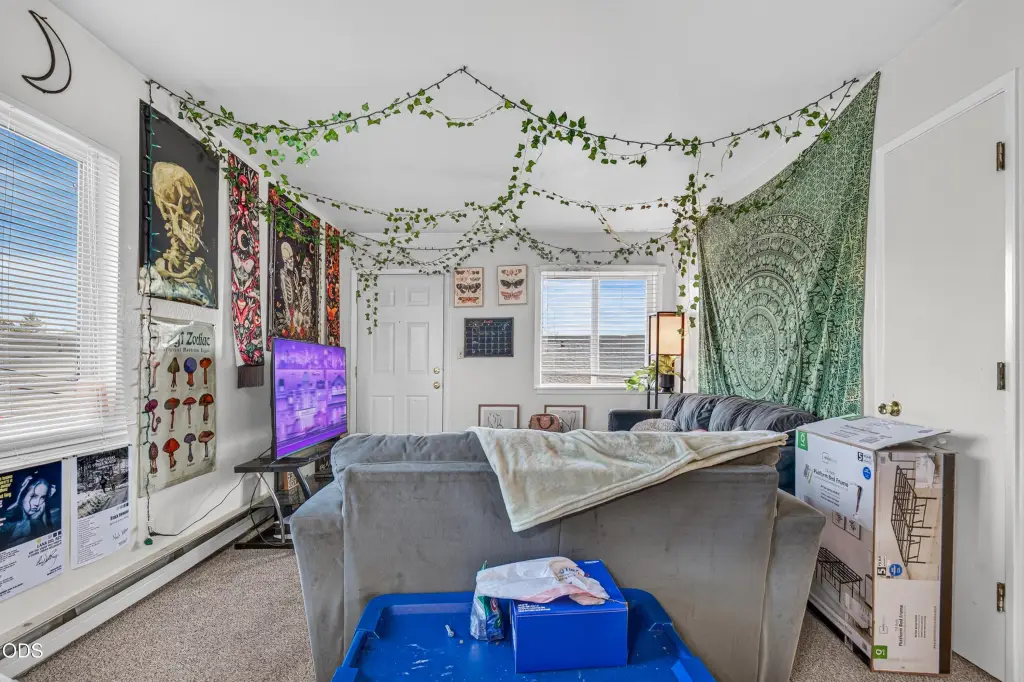
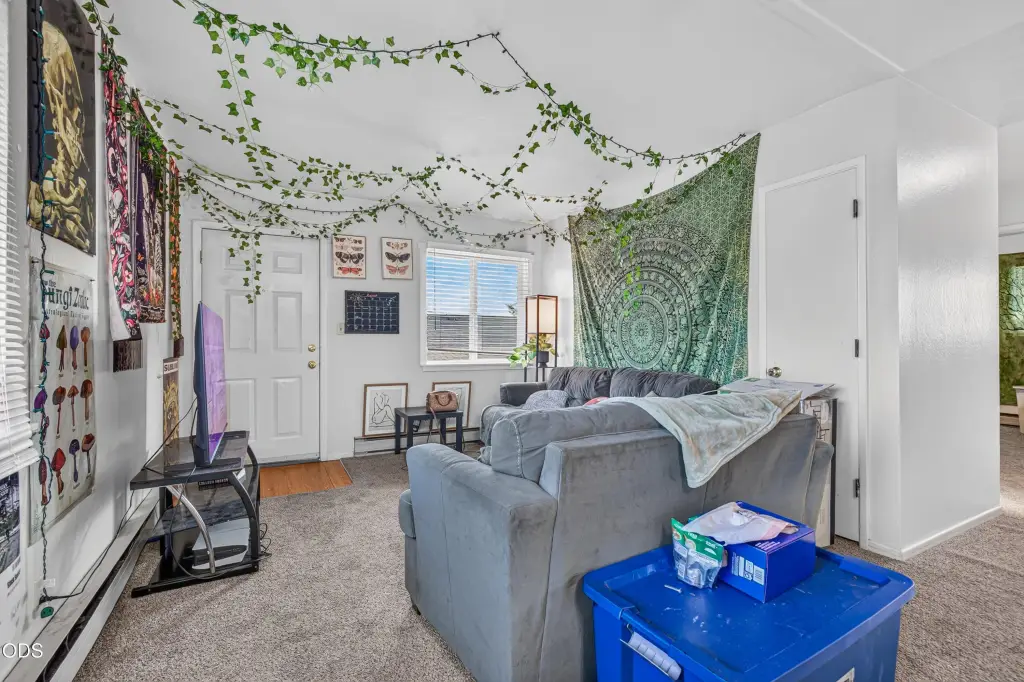
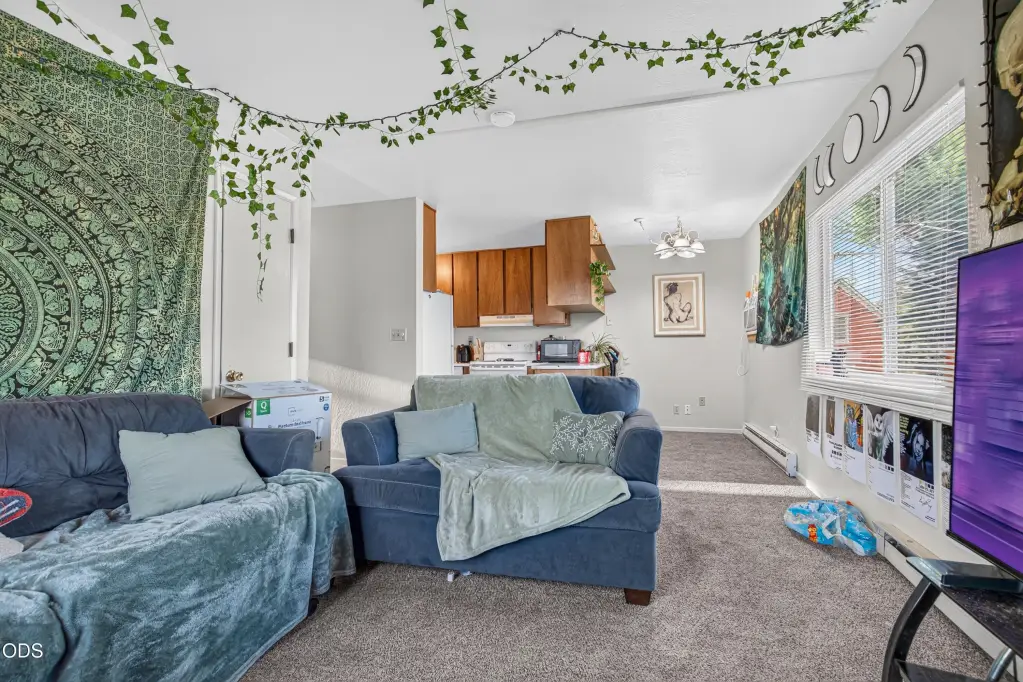
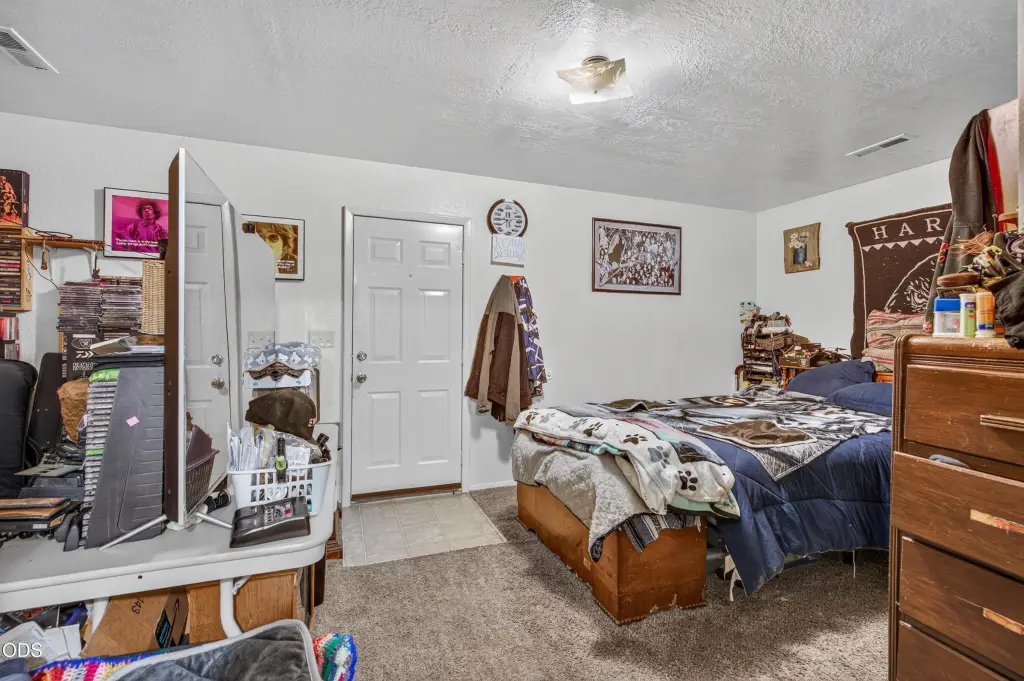
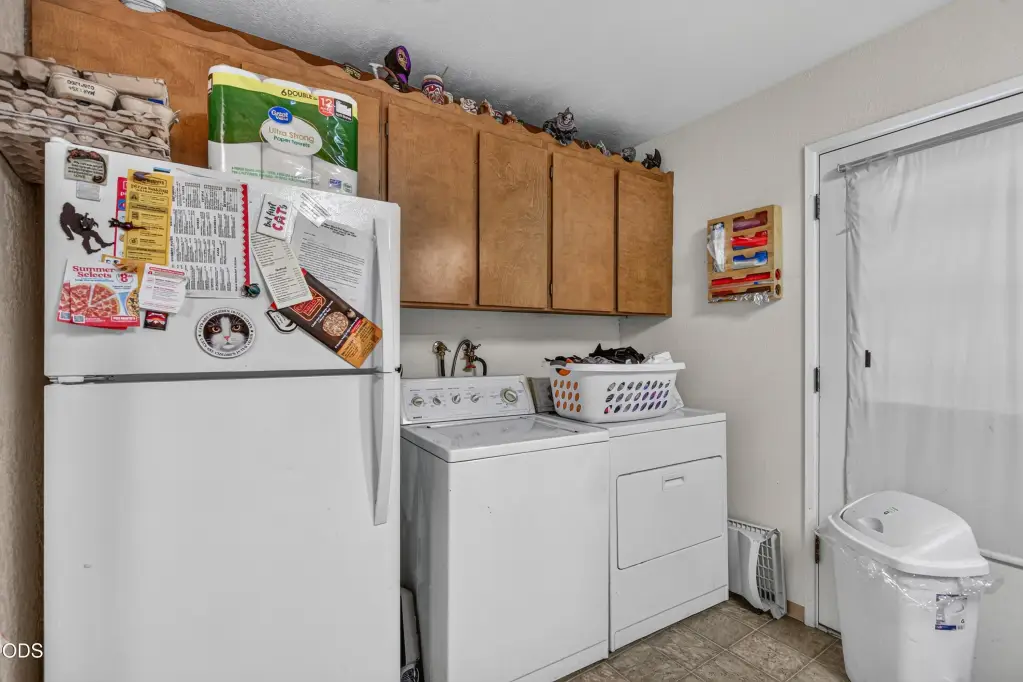
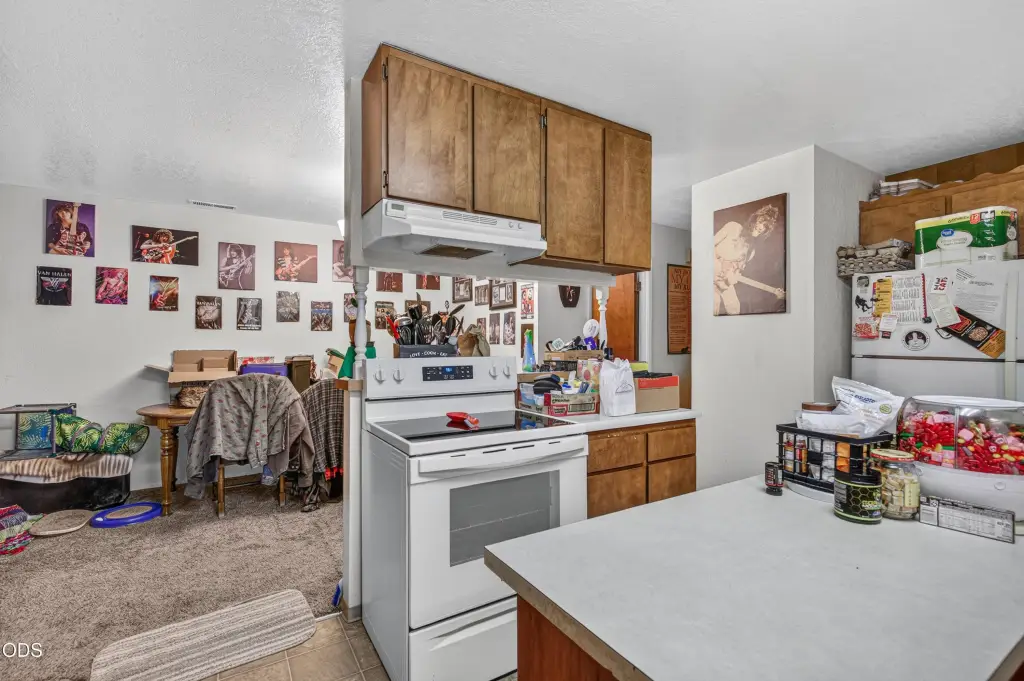
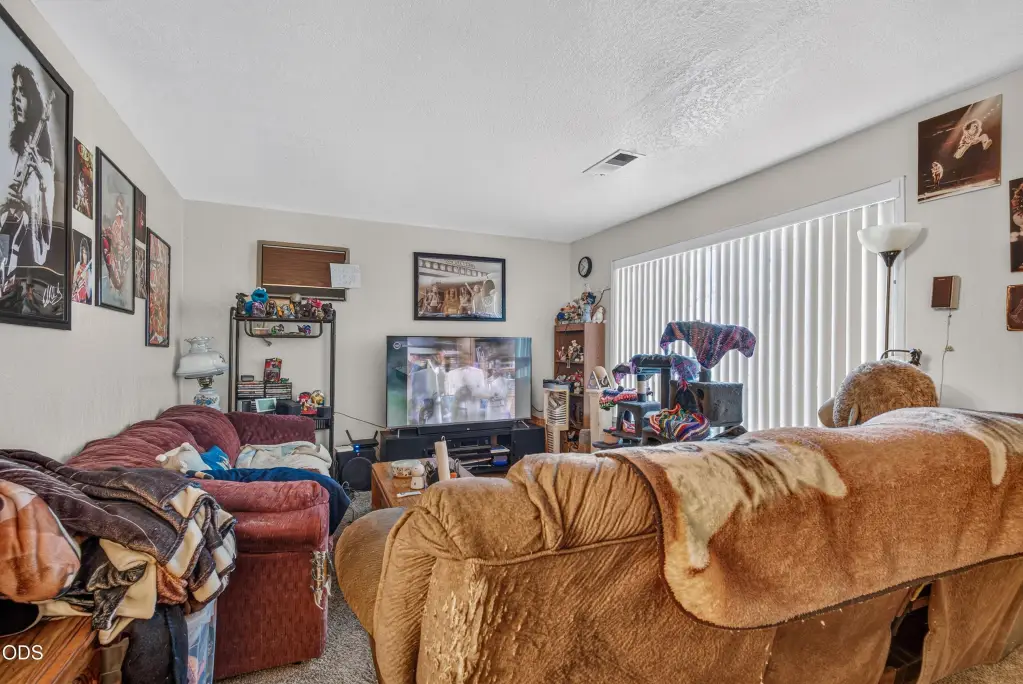
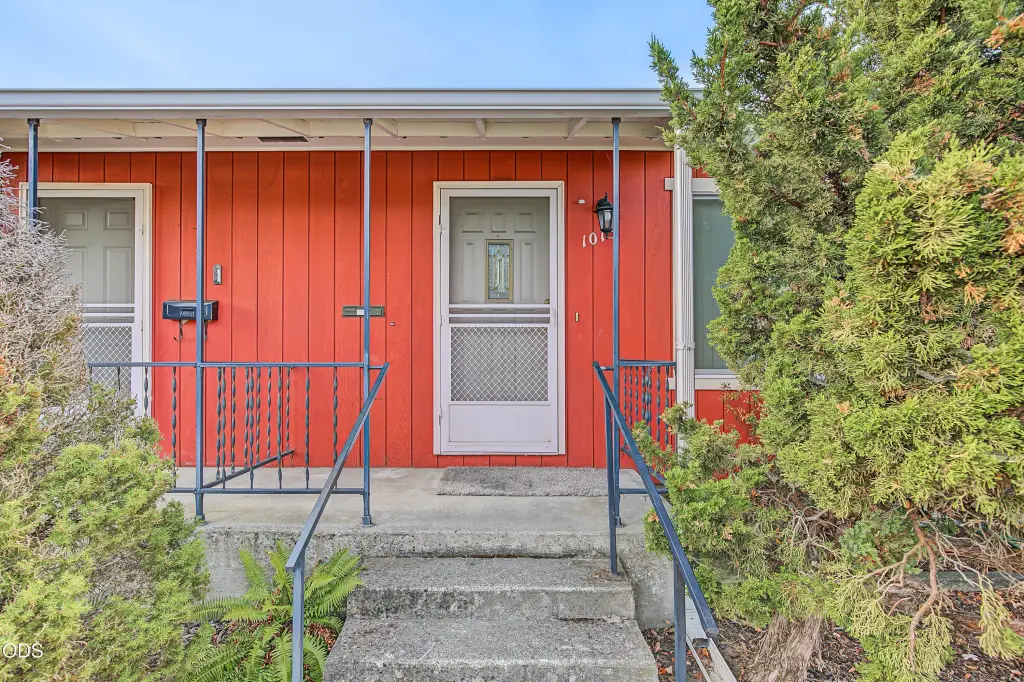
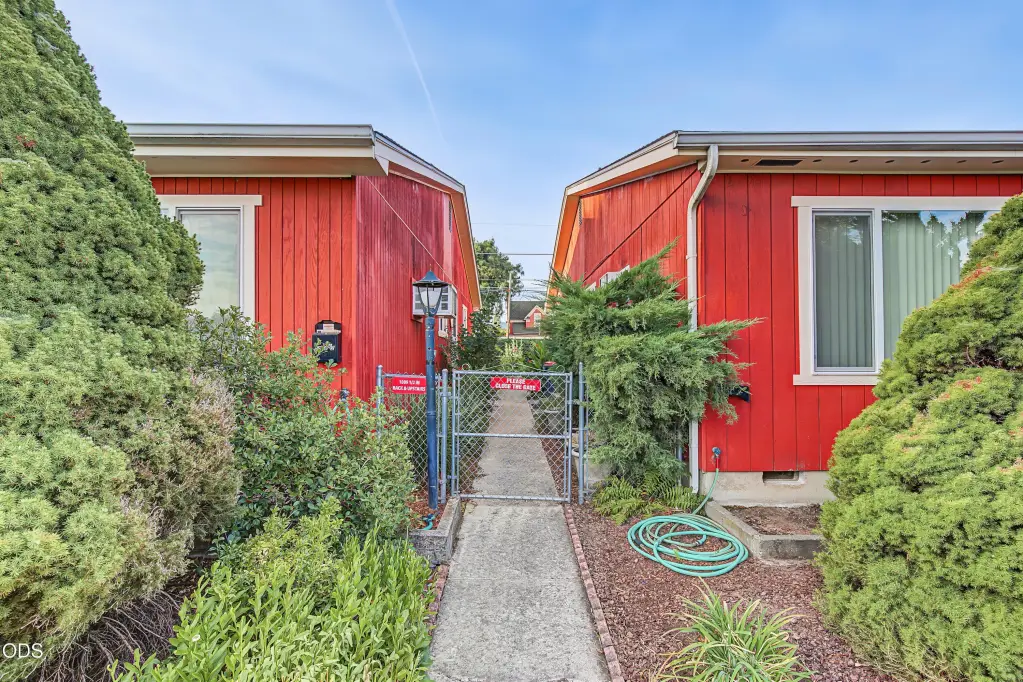
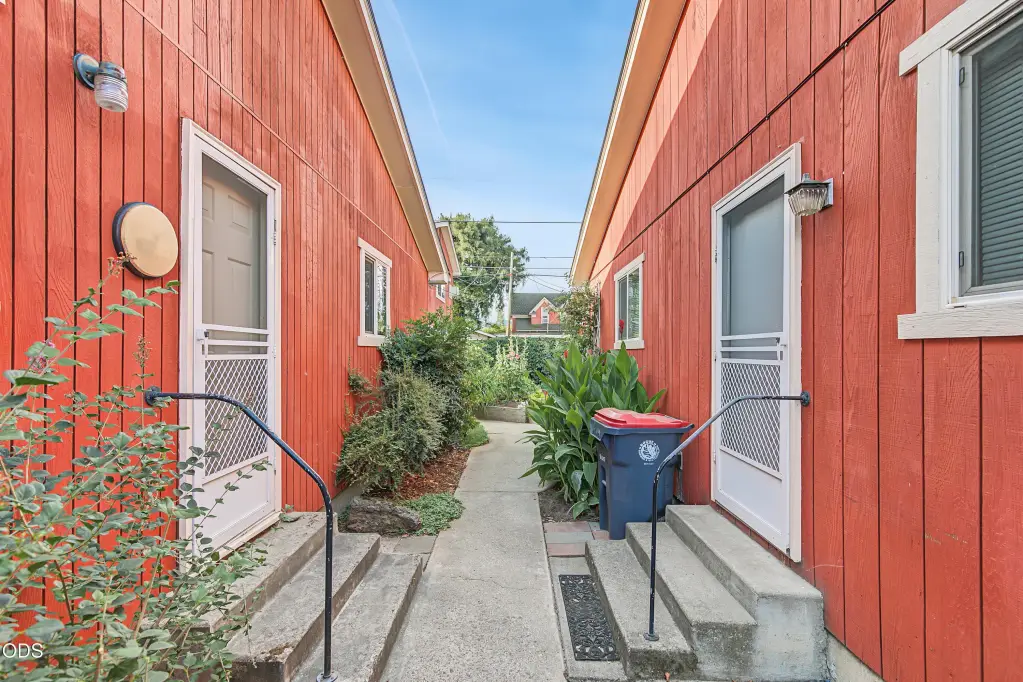
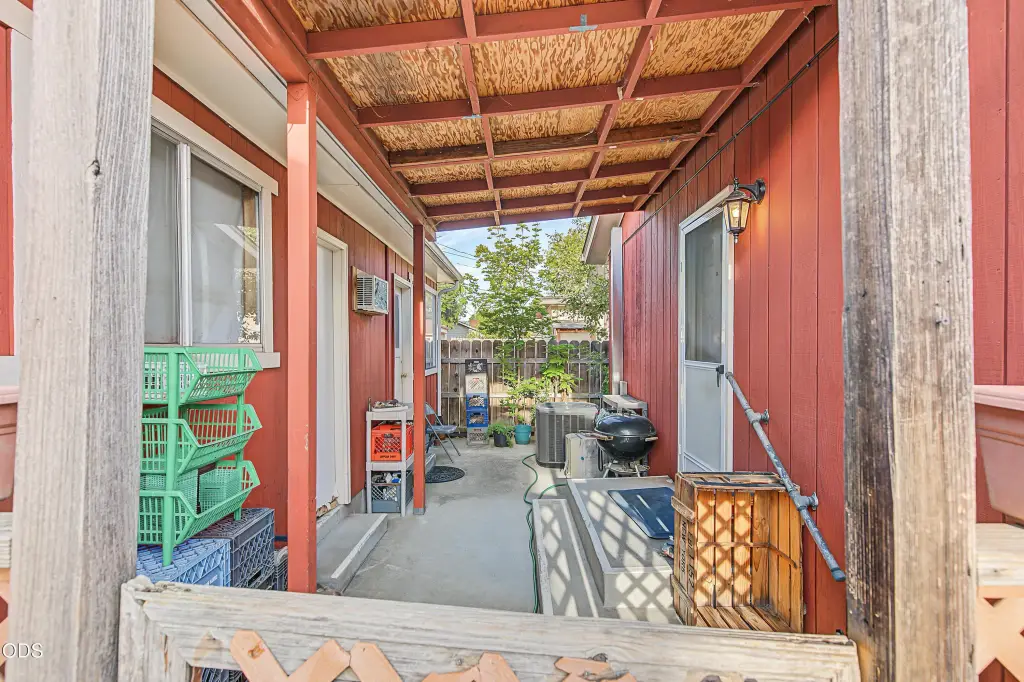
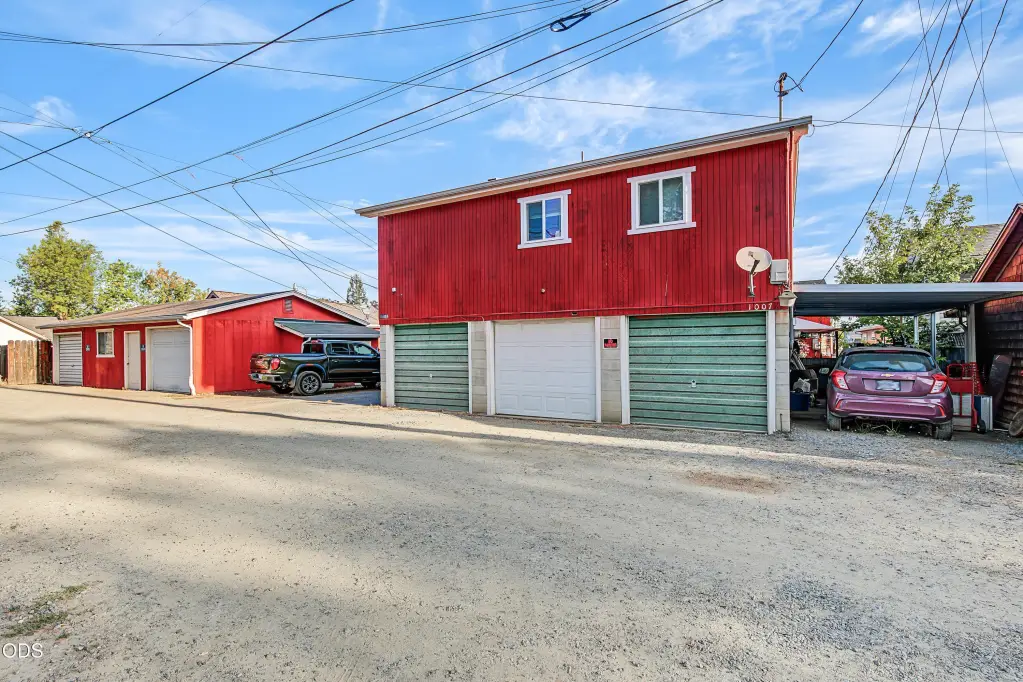
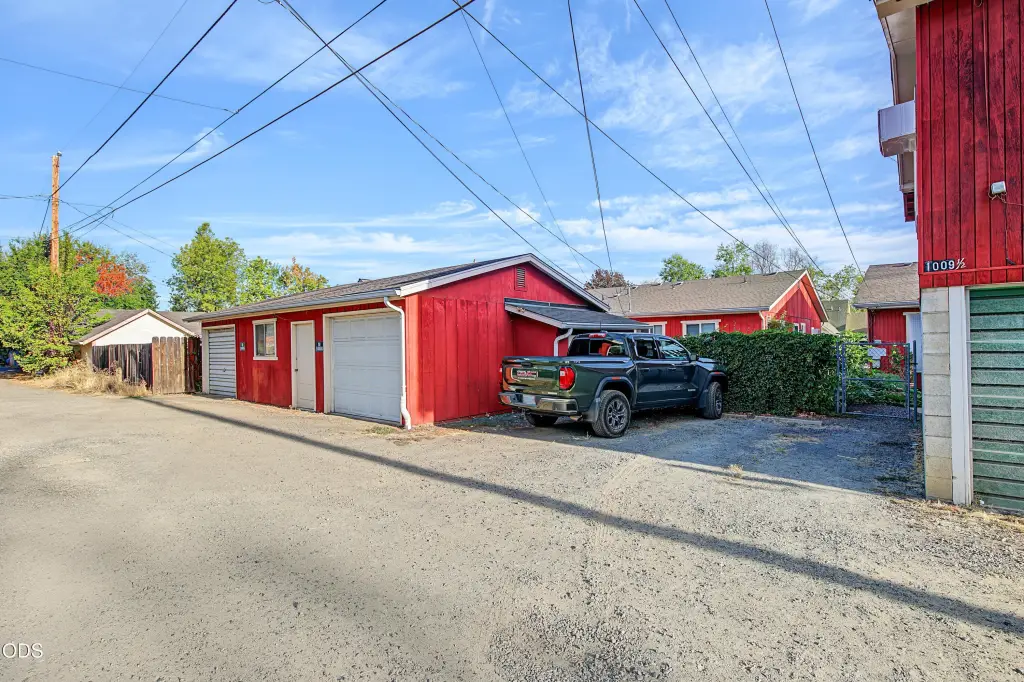
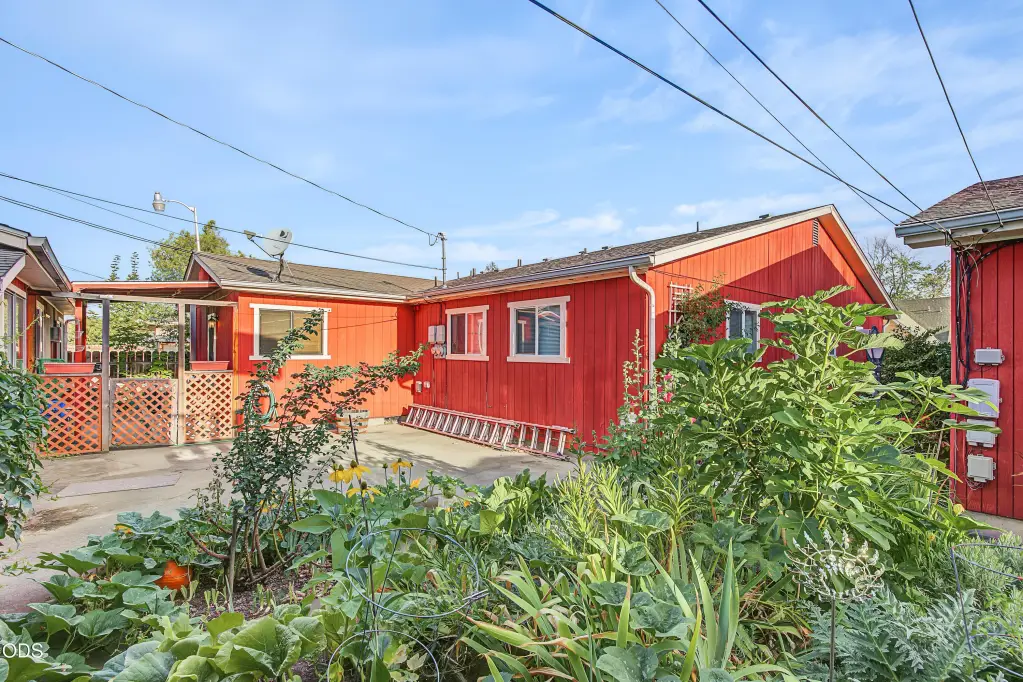
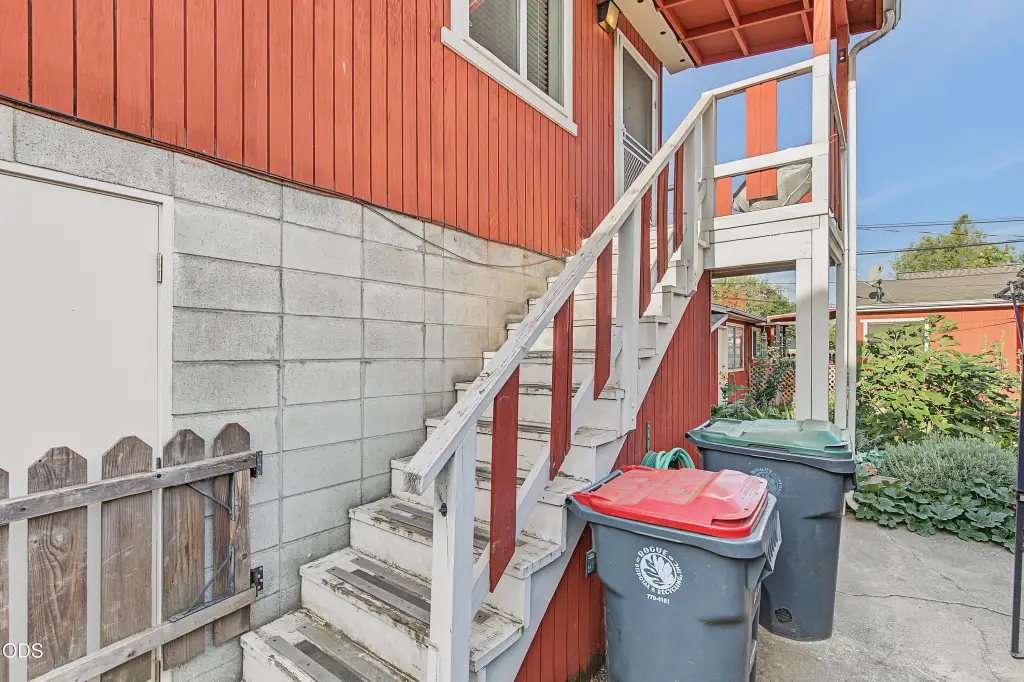
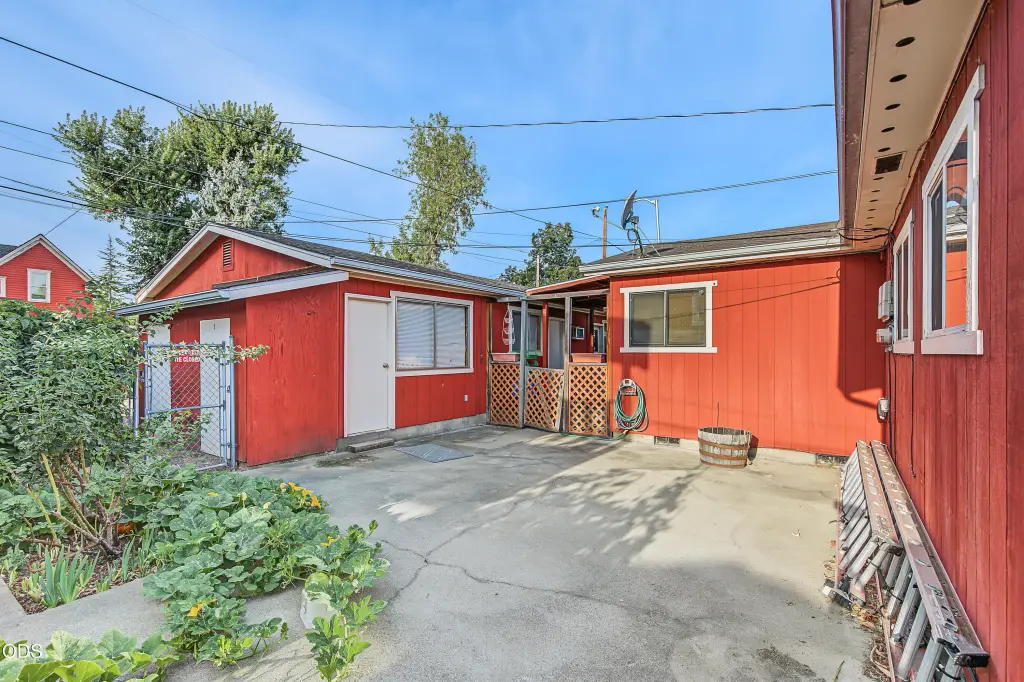
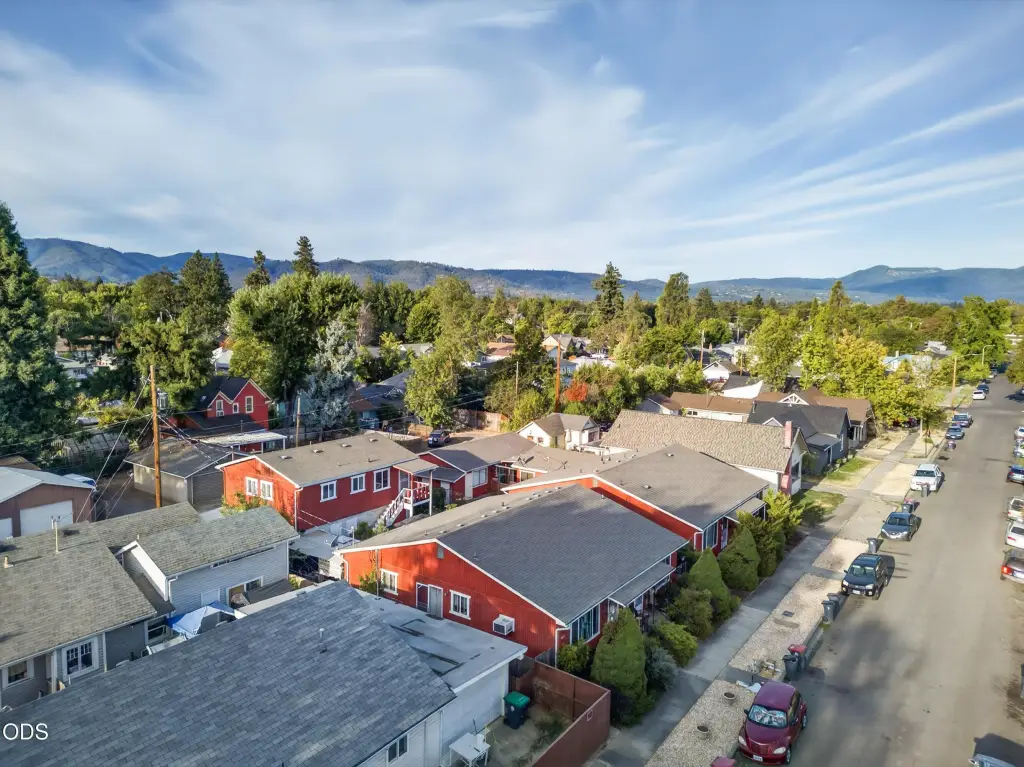
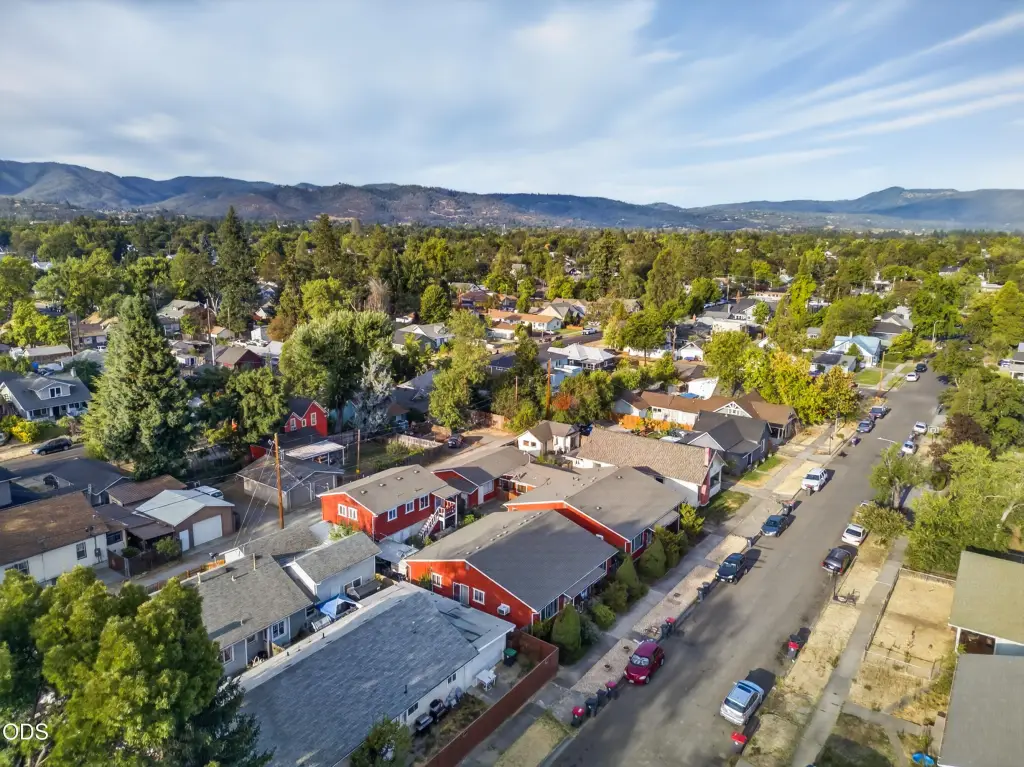
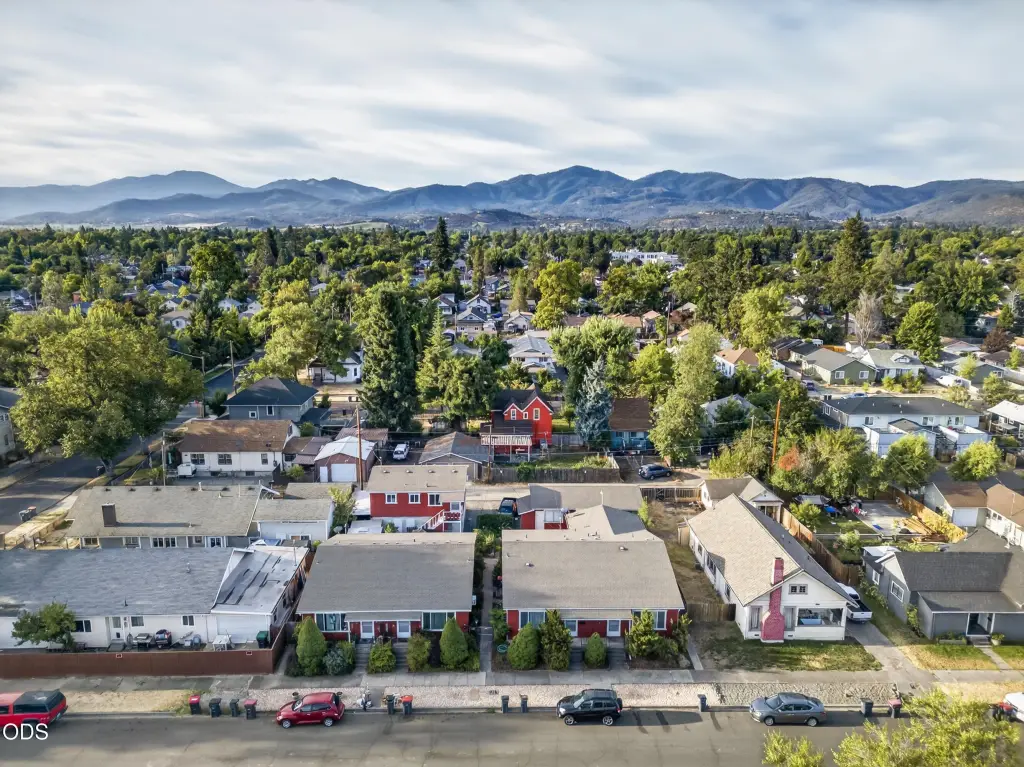
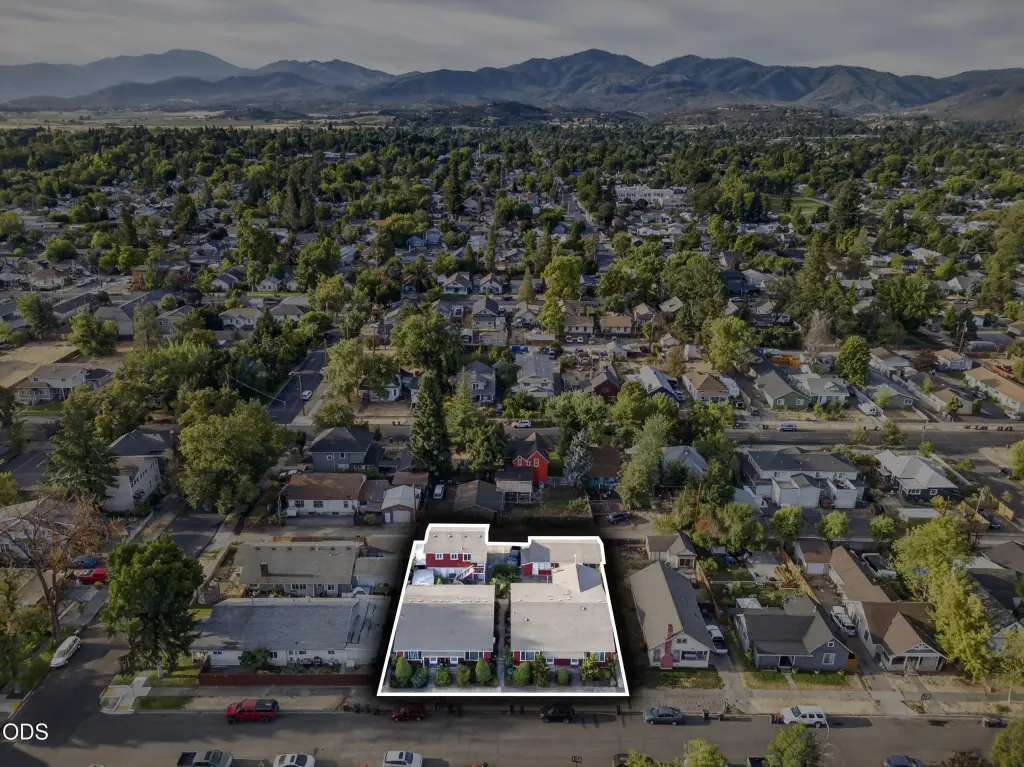
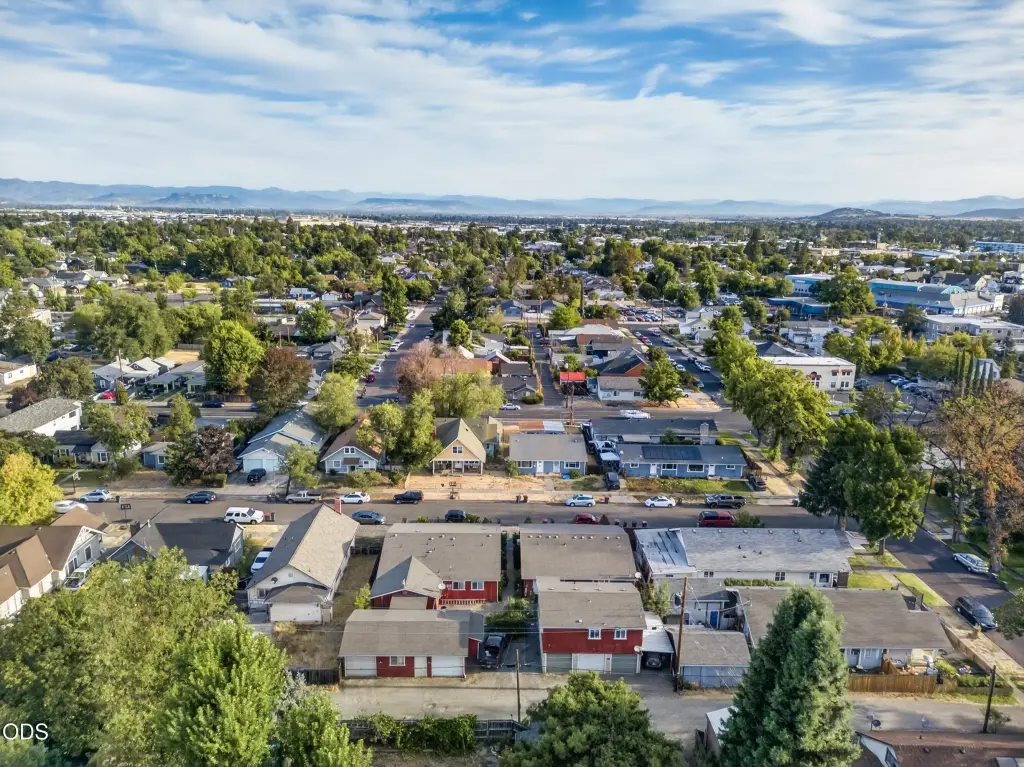
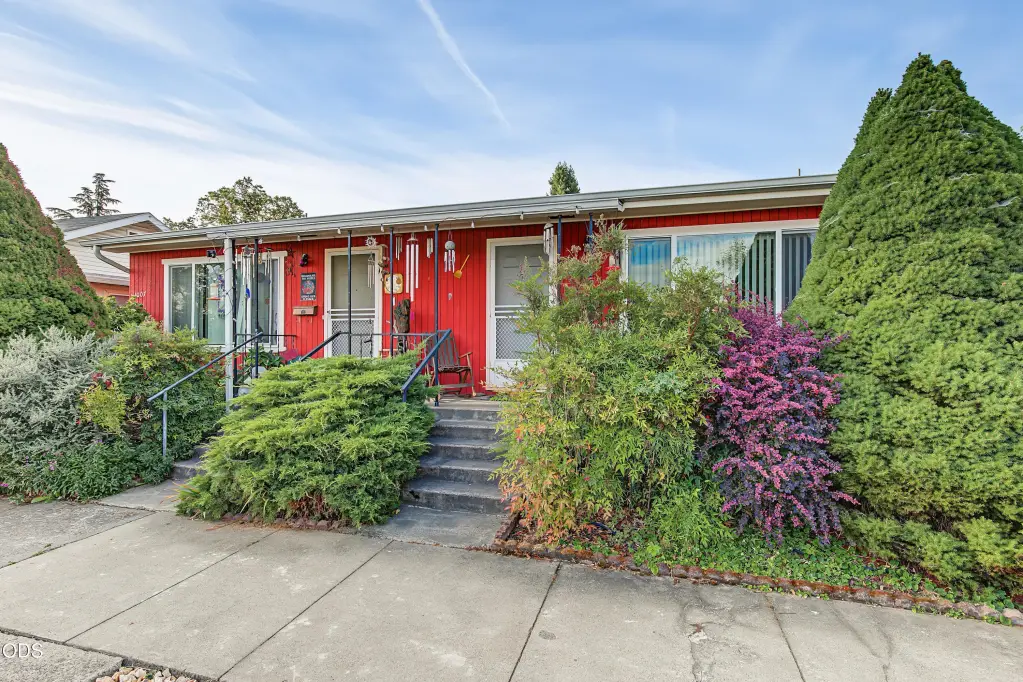
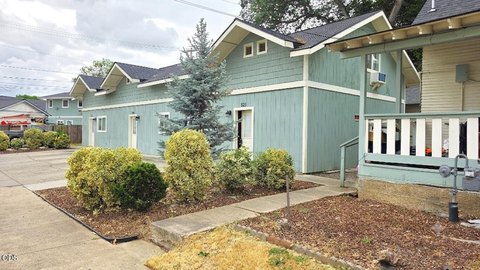
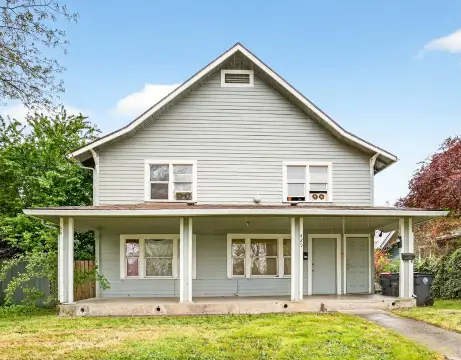
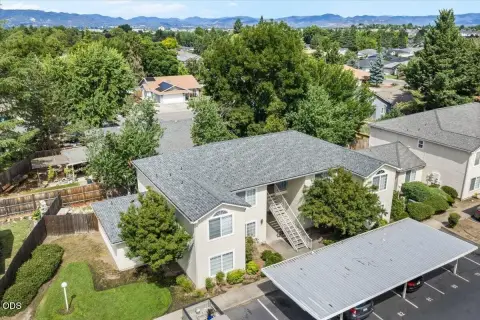
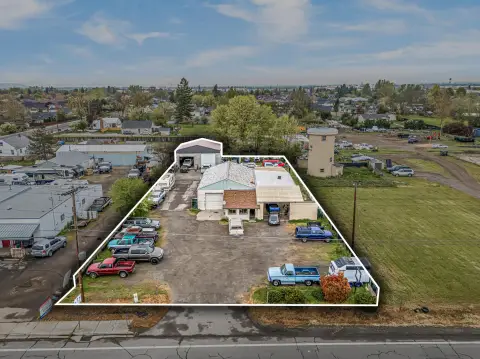
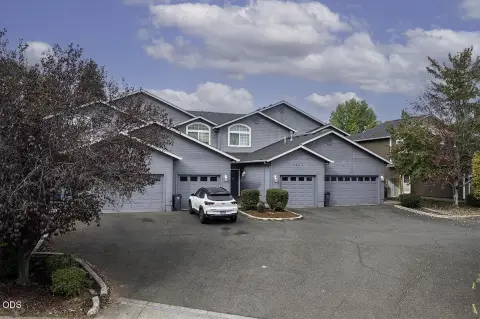
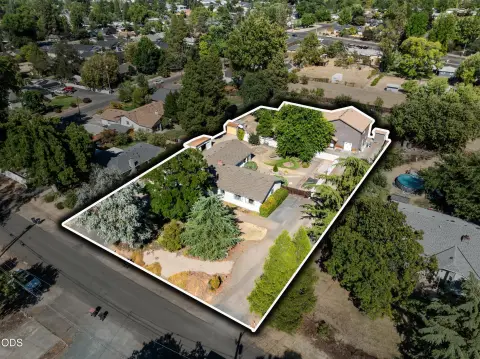
This five-unit multifamily property includes three separate buildings and 5,220 square feet on a 0.24-acre parcel. The unit mix comprises four two-bedroom, one-bath apartments and one two-bedroom, two-bath apartment. All units are currently rented, and each has a private garage, washer and dryer, and kitchen appliances. Water, sewer, and garbage are included with the rent.
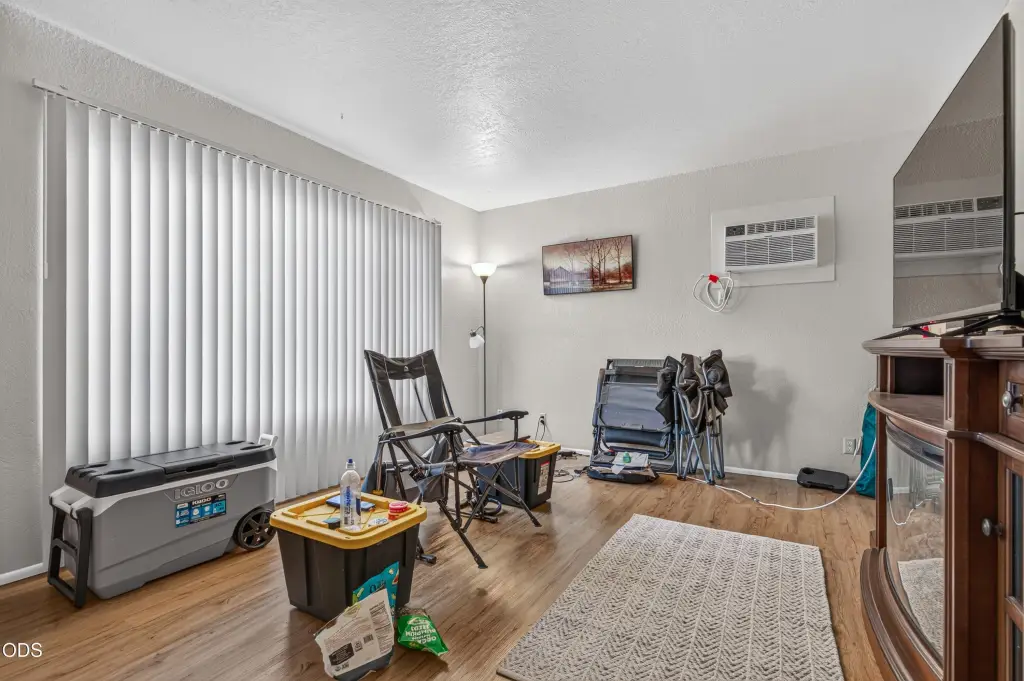
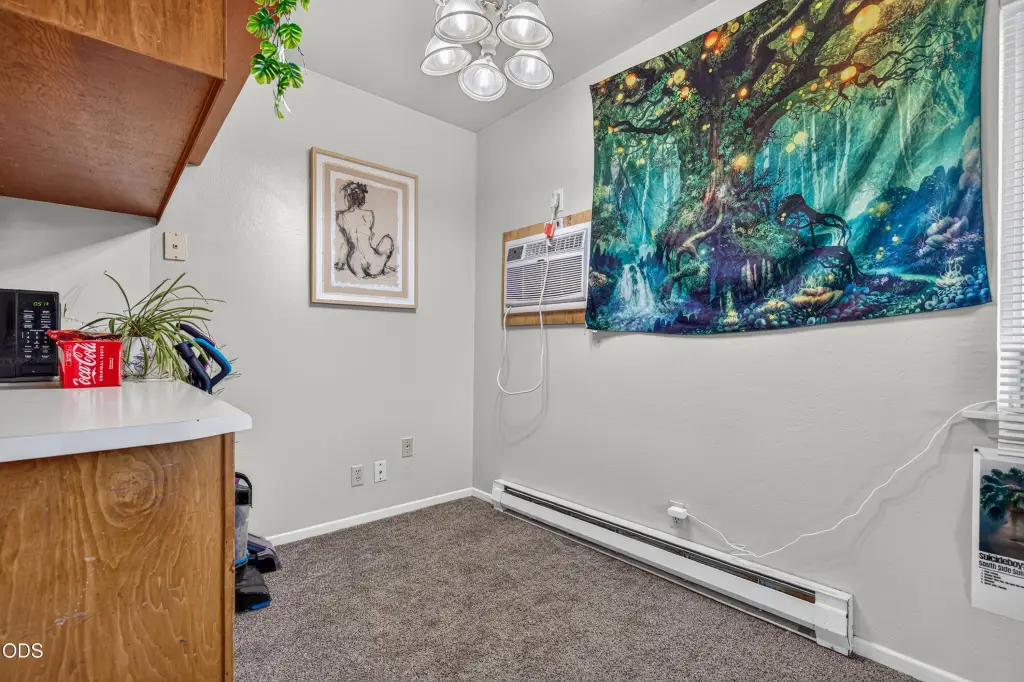
The property was built in 1968 and has received ongoing maintenance, including four replacement street-facing windows, landscaping improvements, shrub trimming, and interior touch-up painting. Unit 1013 features central HVAC and an attached workshop, while the other apartments use wall-mounted heating and air conditioning. Public water and public sewer serve the property, with asphalt roofing and frame construction.
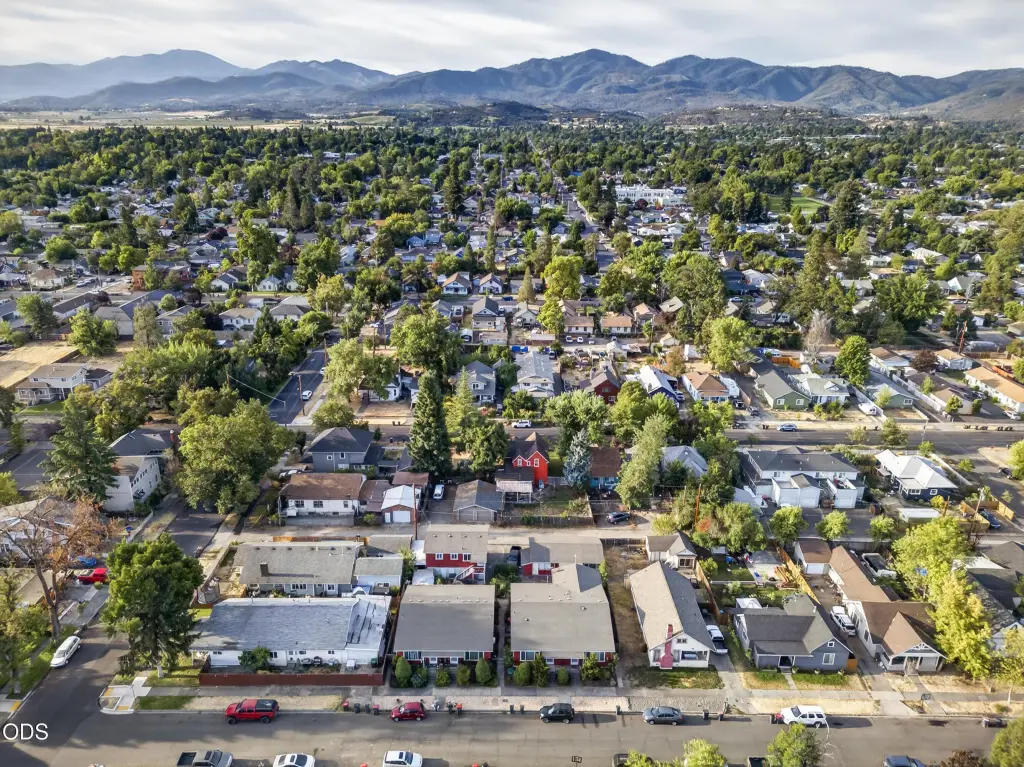
Located at 1007 W 9th Street in West Medford, the property is near downtown Medford, the freeway, and local golf courses. Parking options include garages, assigned spaces, open parking, alley access, and on-street parking.
The property was built in 1968 and has received ongoing maintenance, including four replacement street-facing windows, landscaping improvements, shrub trimming, and interior touch-up painting. Unit 1013 features central HVAC and an attached workshop, while the other apartments use wall-mounted heating and air conditioning. Public water and public sewer serve the property, with asphalt roofing and frame construction.
Located at 1007 W 9th Street in West Medford, the property is near downtown Medford, the freeway, and local golf courses. Parking options include garages, assigned spaces, open parking, alley access, and on-street parking.
Key Highlights
- Five‑unit property across three buildings
- 5,220 square feet on 0.24 acres
- Unit mix includes four 2‑bedroom, 1‑bath units and one 2‑bedroom, 2‑bath unit
Financial Insights
Estimated NOI and Cap Rate
NOI / Yr
$49,094
Cap Rate
7.27%
Suggested Prices Based on Cap Rates
Cap Rate 5%
$981,880
$981.9K
Cap Rate 7%
$701,343
$701.3K
Cap Rate 9%
$545,489
$545.5K
Market Conditions
NOI Build-Up for 5,220 SF
Gross rent
$94.0K $18.00/SF
− Vacancy
−$4.7K −$0.90/SF
EGI
$89.3K $17.10/SF
− OpEx
−$40.2K −$7.69/SF
NOI
$49.1K $9.41/SF
Area
Jackson County, OR
Vacancy
5.00%
Lease Rate
$18.00 /SF/Yr
Expense Ratio
45.00%
Simulate Cap Rate and NOI
Suggested Prices Based on Cap Rates
Cap Rate 5%
$981,880
Cap Rate 7%
$701,343
Cap Rate 9%
$545,489
Alternative Uses
Best Use
Apartment 5plus
$701.3K
$613.7K – $818.2K
NOI $49,094 @ 7.0% cap · market cap 7.27%
Second Best
—
—
no second resolved use
Theoretical Best
Office A
$1.26M
$1.10M – $1.47M
NOI $88,197 @ 7.0% cap · market cap 13.07%
Zoning and permitted uses should be independently verified with authorities.
How Realmo checks its estimates
Property Analytics
Who owns this building?
See the owner, sales and loan history
Open Analytics
Lease Details
5
Residential units
Location Intelligence
Trade Area within ½ mile
1,637
Businesses Nearby
Explore this area
Business Placement
Demographics for 97501, OR
47,519
Population
19,370
Households
2.5
Avg Household Size
37
Median Age
20%
College-Educated
90%
High-School Grad
45.3 sq mi
ZIP Area
1,049
Density / Sq Mi
$61,971
Median Household Income
$36,471
Median Earnings
$1,238
Median Rent
$325,200
Median Home Value
Check the figures for this property
Cap Rate, Value Estimation, Potential NOI and more
View Realmo Analytics
Market
Vacancy Rate% for Multifamily in West region



Frequently Asked Questions
What type of property is this?
Apartment building - Maintained multifamily asset with private garages, in-unit laundry, and varied two-bedroom layouts.
Where is this apartment building located?
The property is located at 1007 W 9th Street Medford, OR.
What is the asking price?
The asking price for this property is $675,000.
What are key features of this property?
This property features: Five‑unit property across three buildings; 5,220 square feet on 0.24 acres; Unit mix includes four 2‑bedroom, 1‑bath units and one 2‑bedroom, 2‑bath unit


