Historic Pharmacy and Office
1006-8 W LEHIGH Avenue Philadelphia, PA 19133
For Sale
$829,000
Commercial Sale - PHILADELPHIA, PA
Property Size5,700 SF
Lot Size0.13 Acres
Price / SF$145.44
Days on Market323
Property Features for 1006-8 W LEHIGH Avenue
General Information
Property type
Other
Property subtype
Retail
Parking
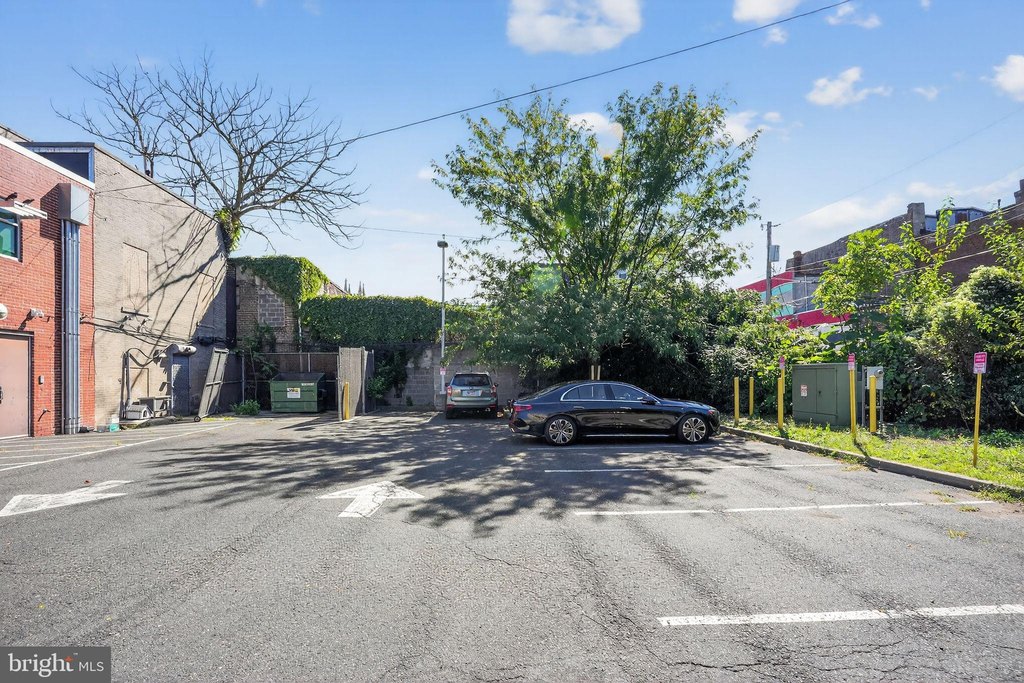
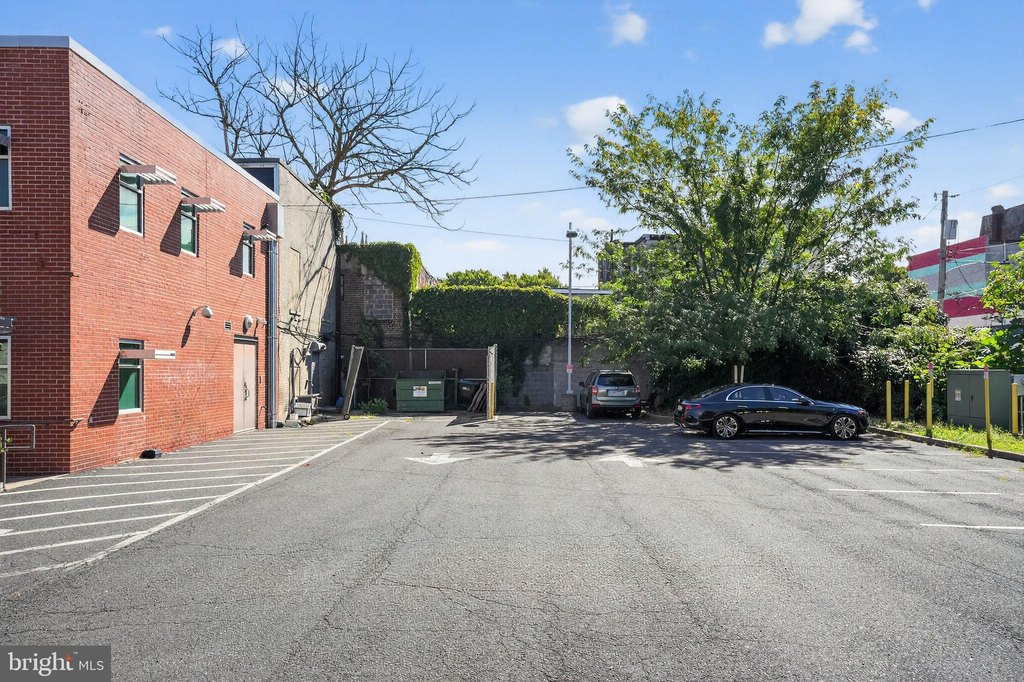
7
Parking features
On Street, Parking Lot
Standard status
Active
Lot size
0.13 Acres
Taxes and HOA fees
Tax Annual Amount
4777
Utilities
Heating system
Hot Water(Heating)
Cooling system
Central Air
Building Details
Year built
1915
Number of units
4
Building materials
Masonry
Listing Agency:
Homestarr Realty
(215) 355-5565
Listed By:
Michael Bottaro · License #AB067983
(267) 307-2444
Added: Sep 9, 2025
Changed: Jul 13
Last Checked: Jul 28 at 10:06PM
MLS# PAPH2535834
Copyright © 2026 Bright MLS. All rights reserved. All information provided by the listing agent/broker is deemed reliable but is not guaranteed and should be independently verified.
Investment Insights
Based on property information with market context.
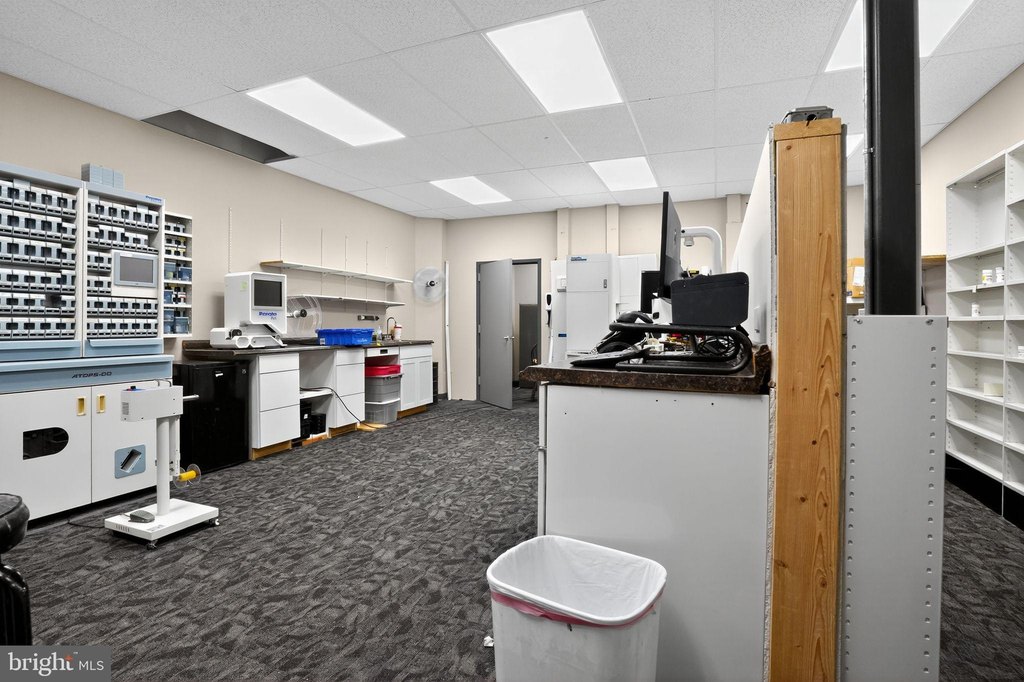
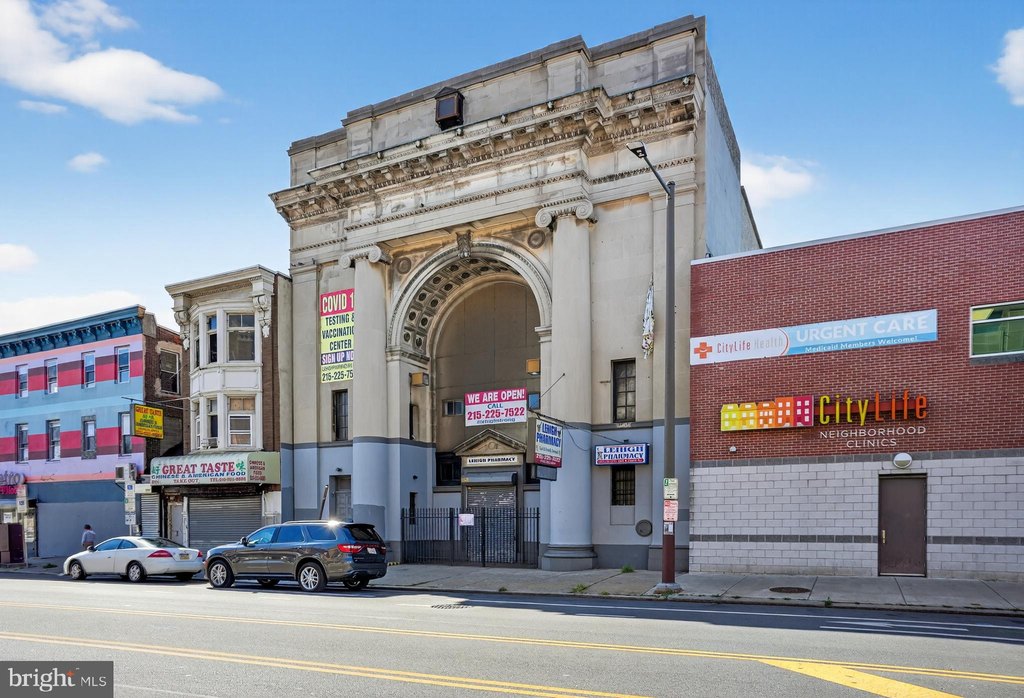
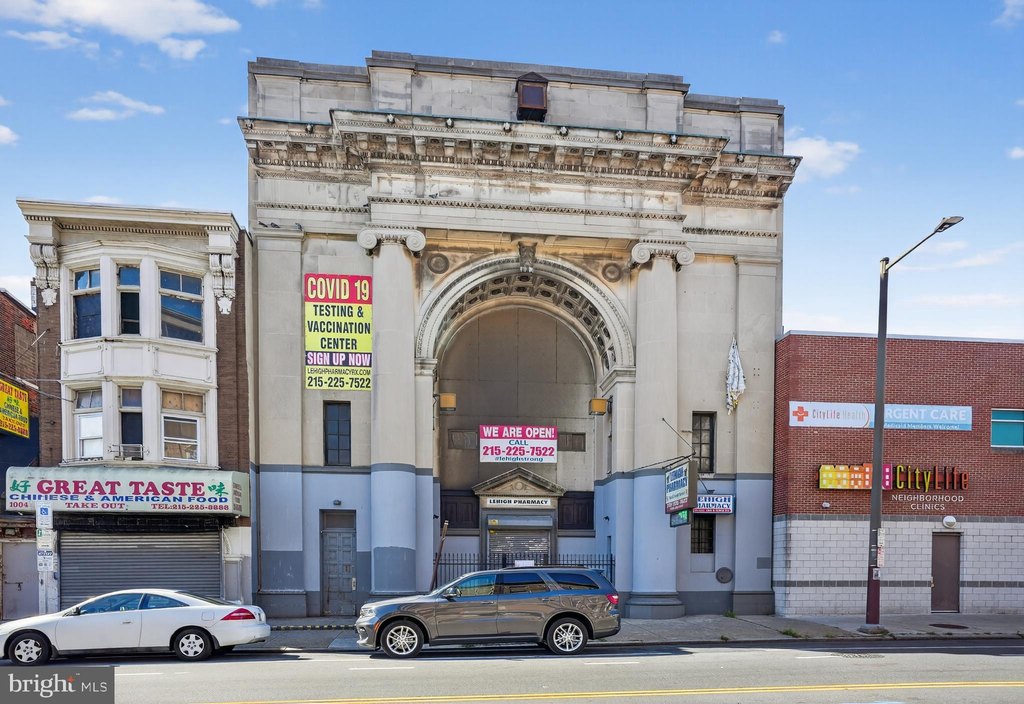
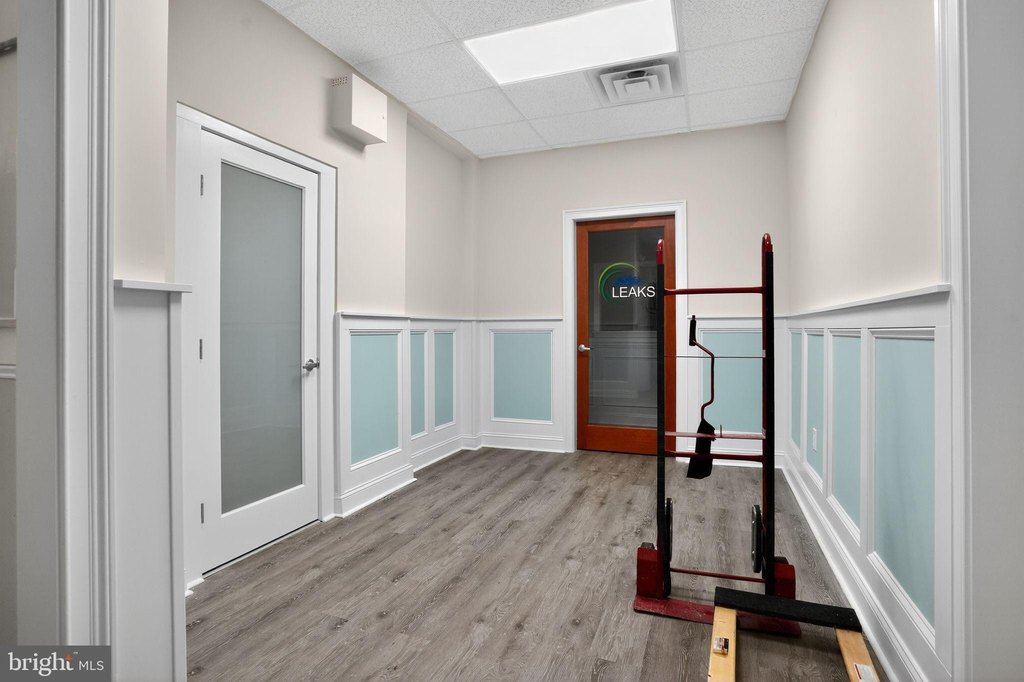
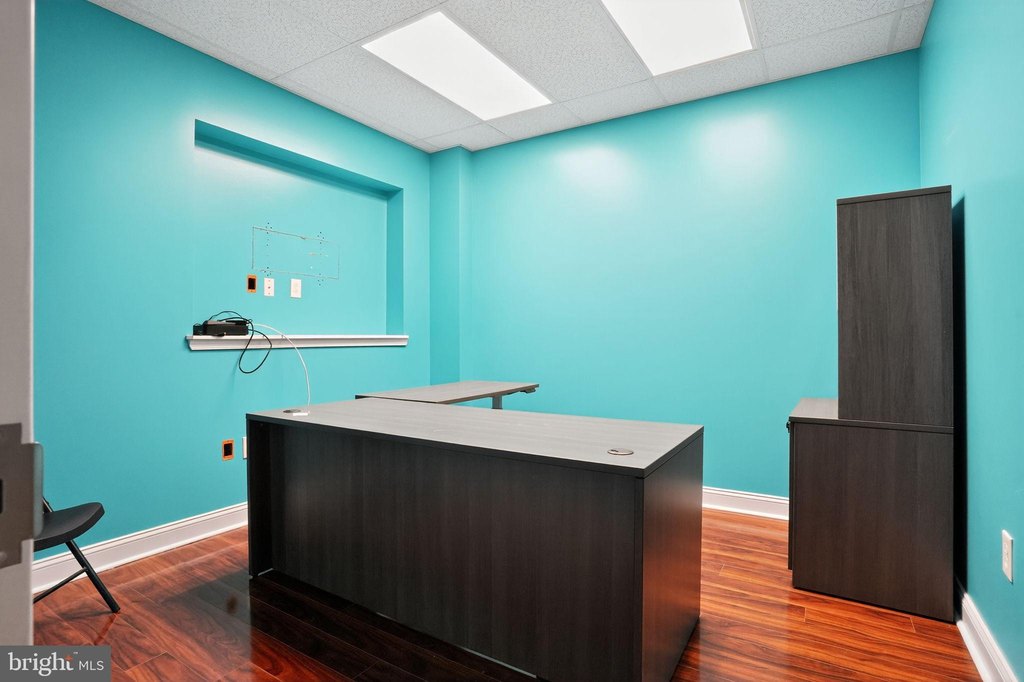
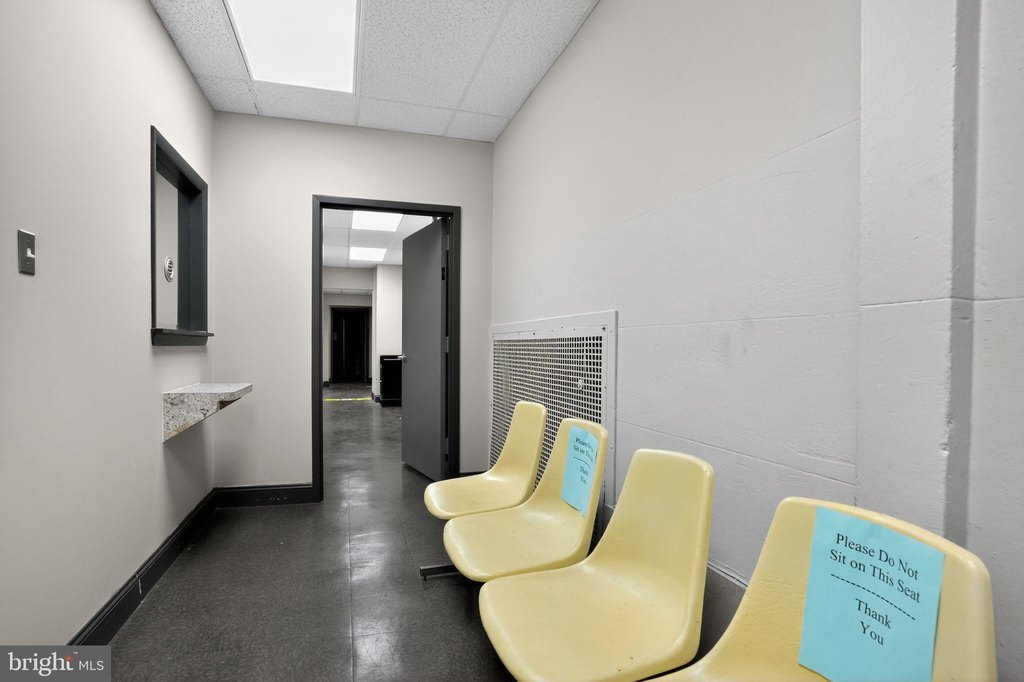
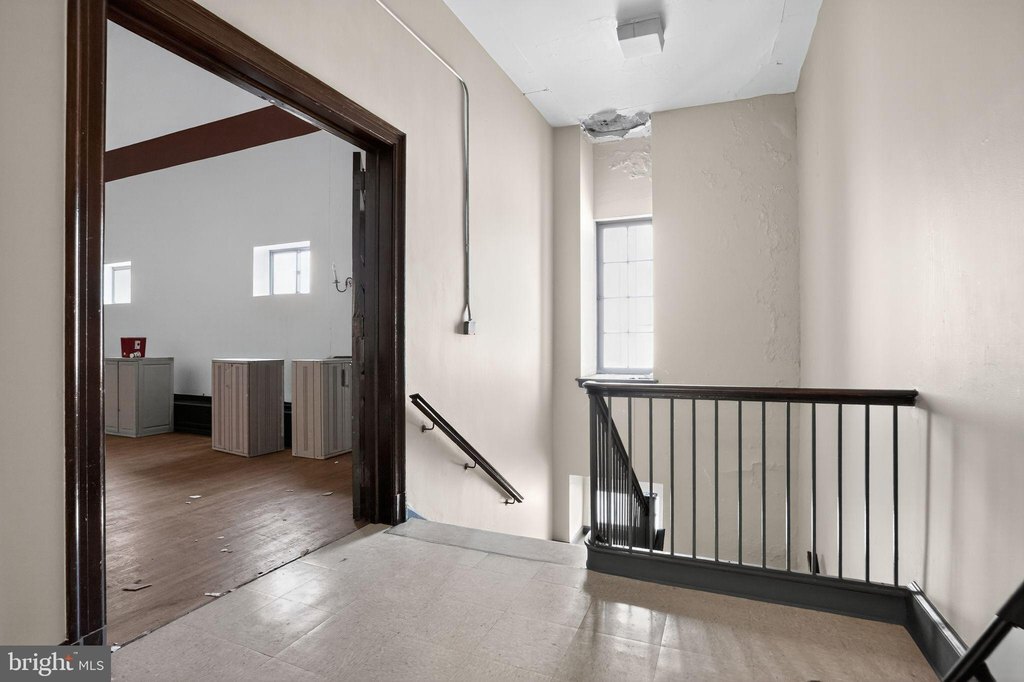
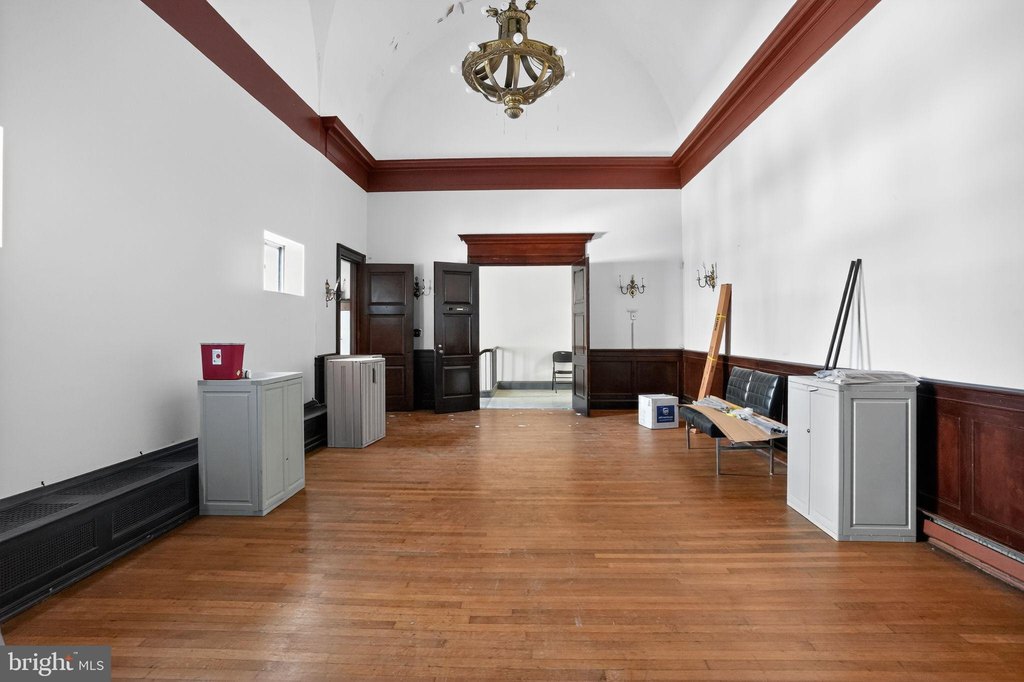
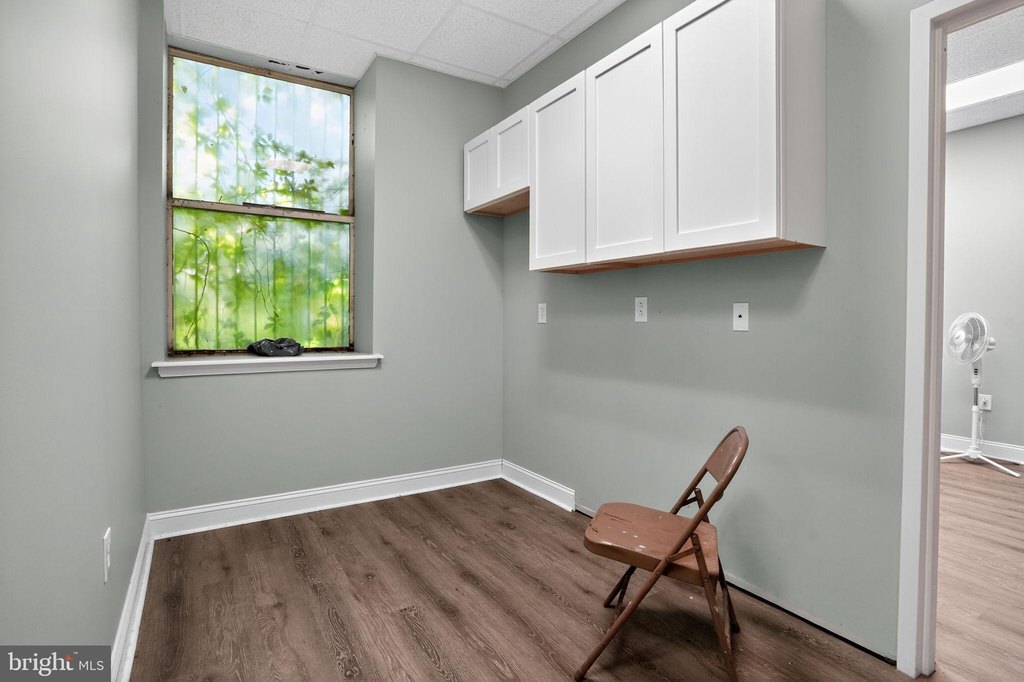
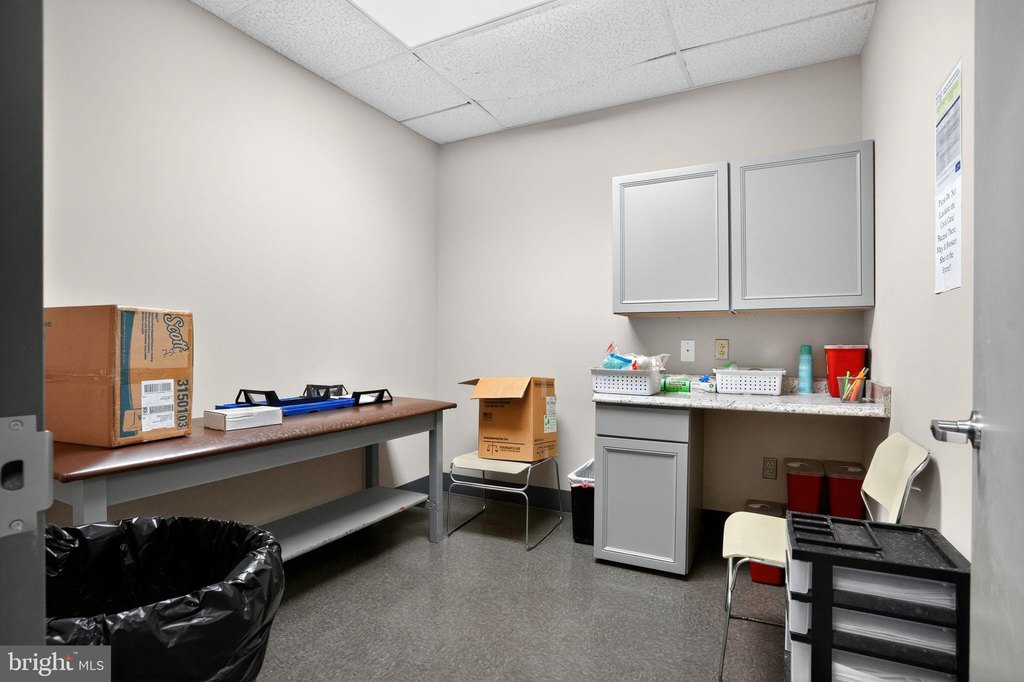
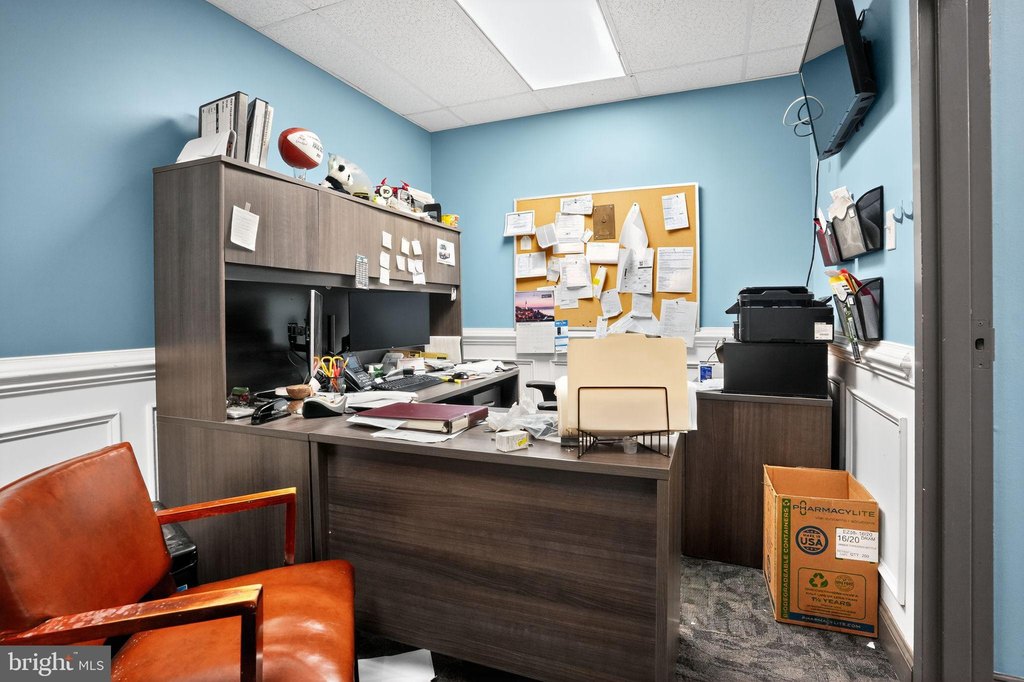
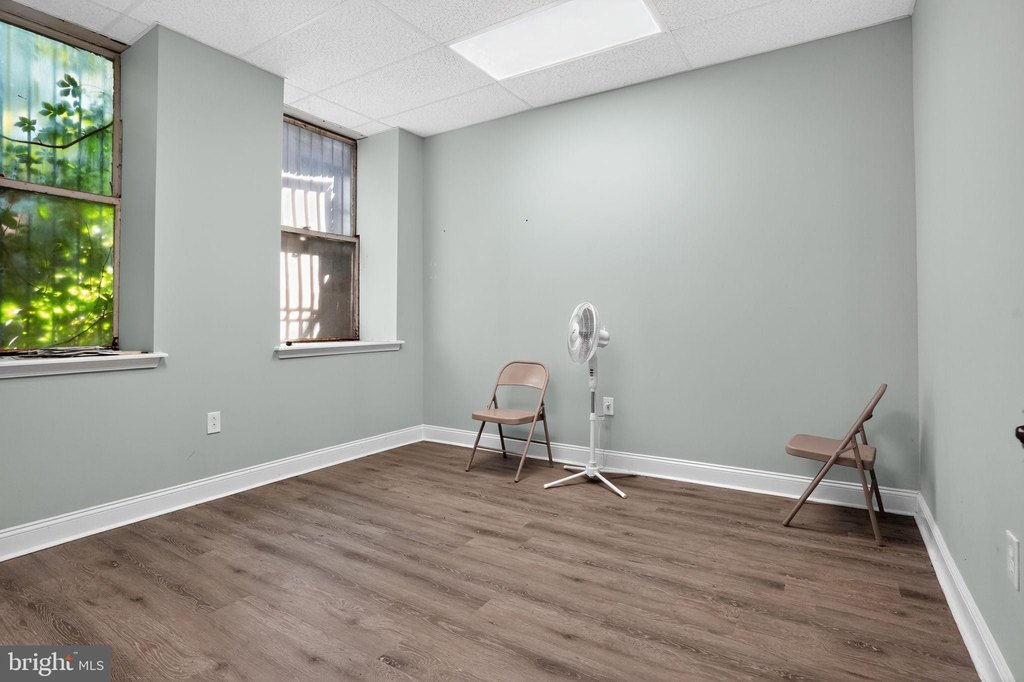
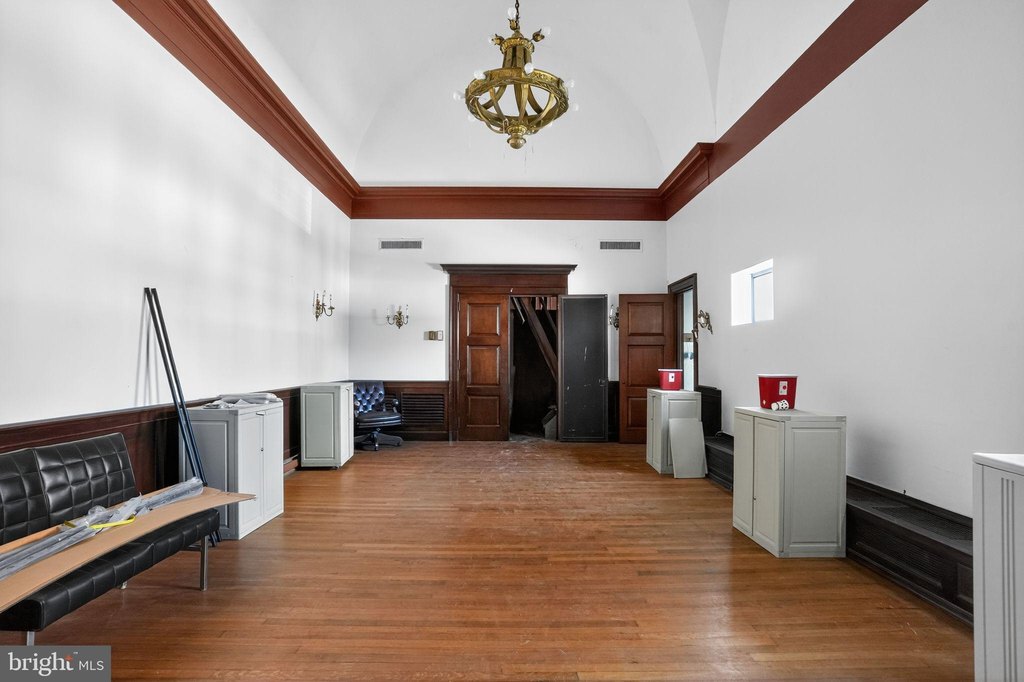
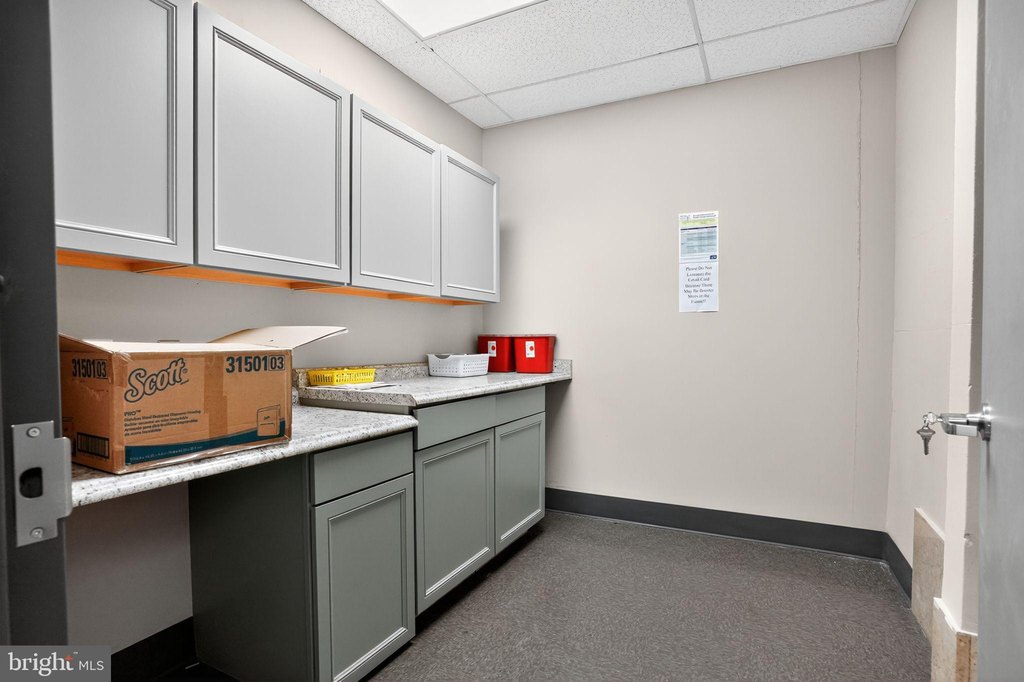
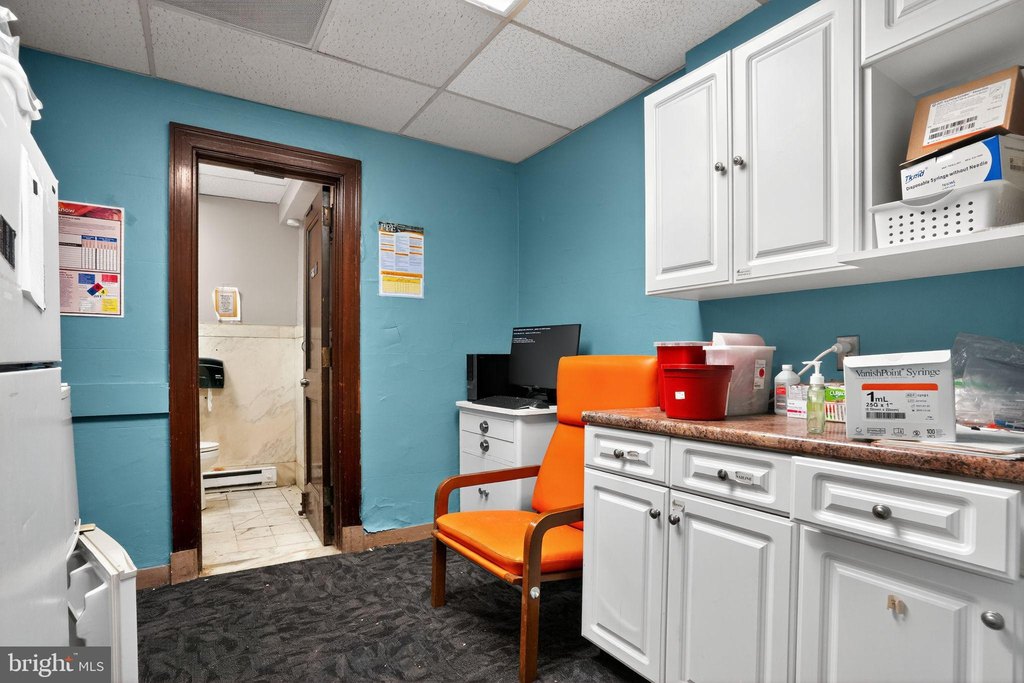
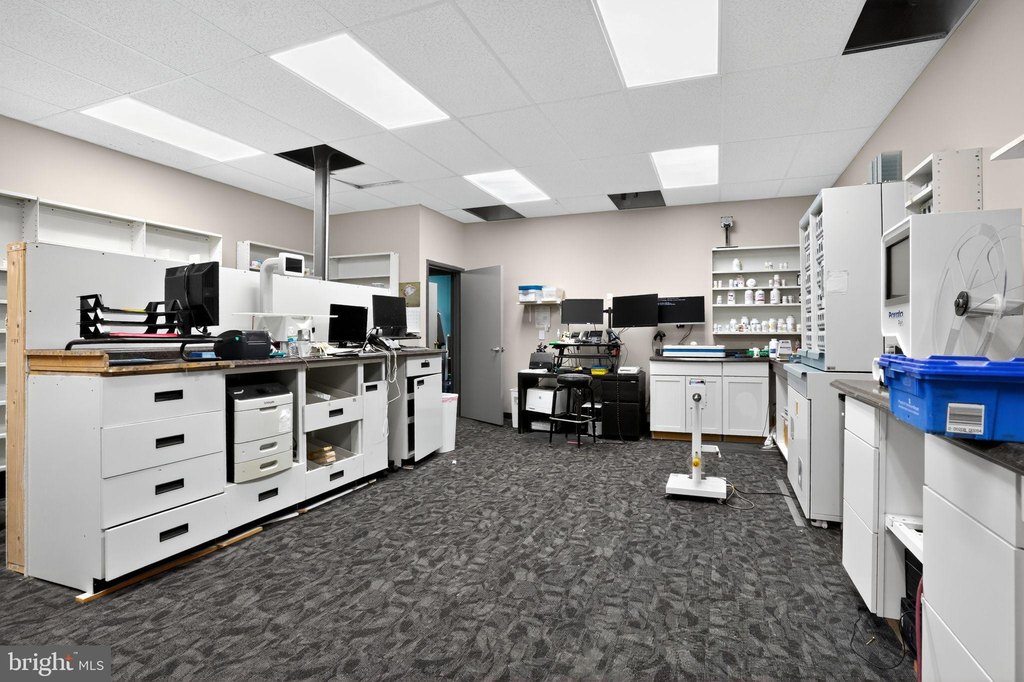
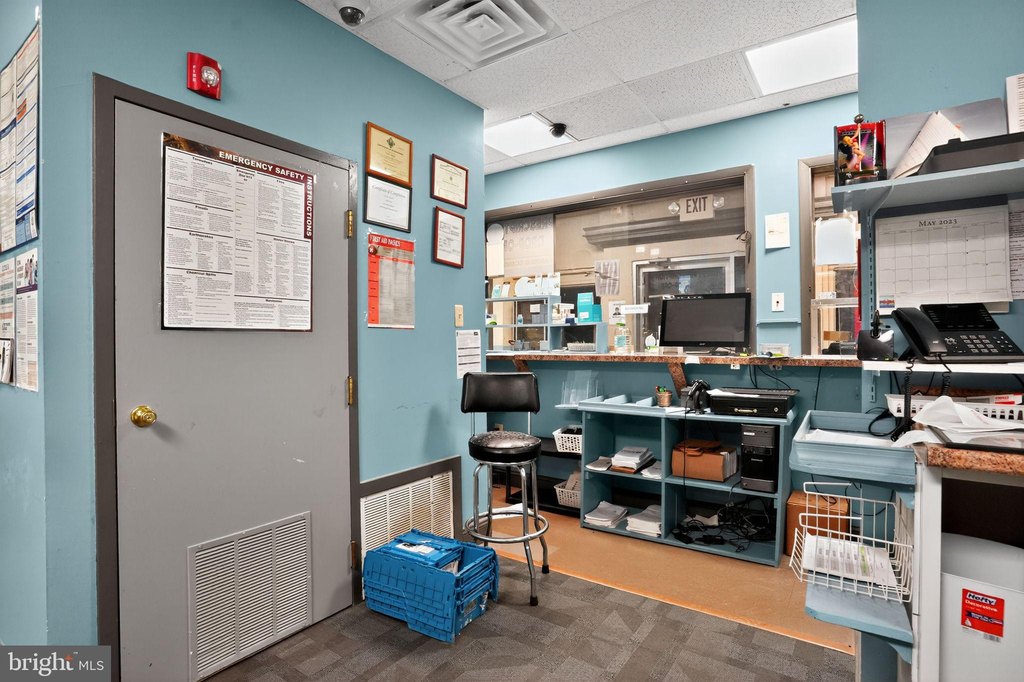
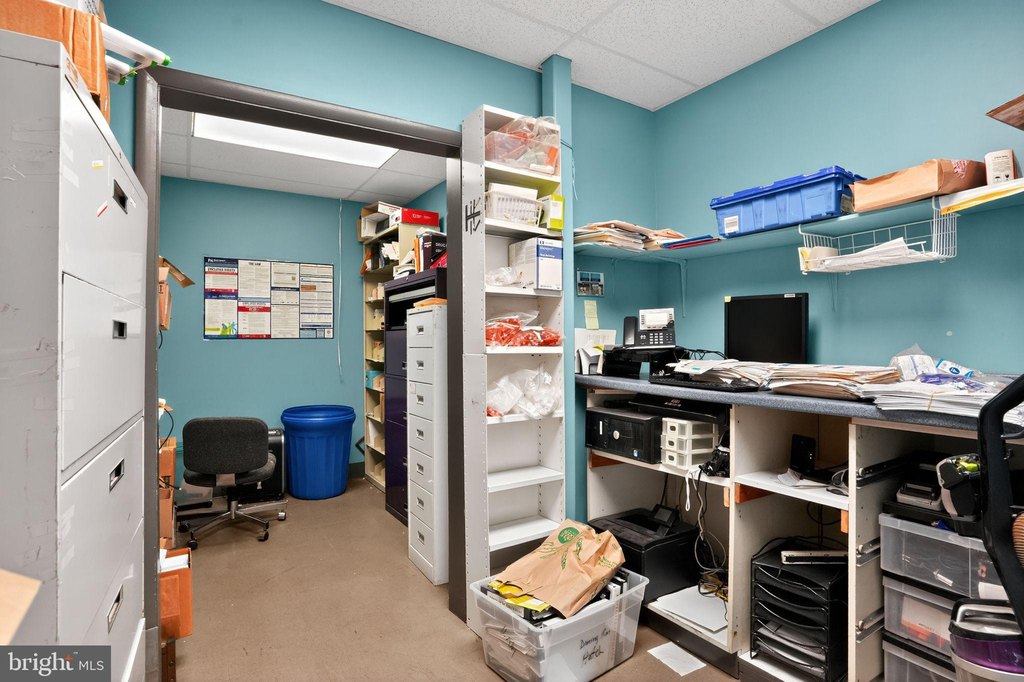
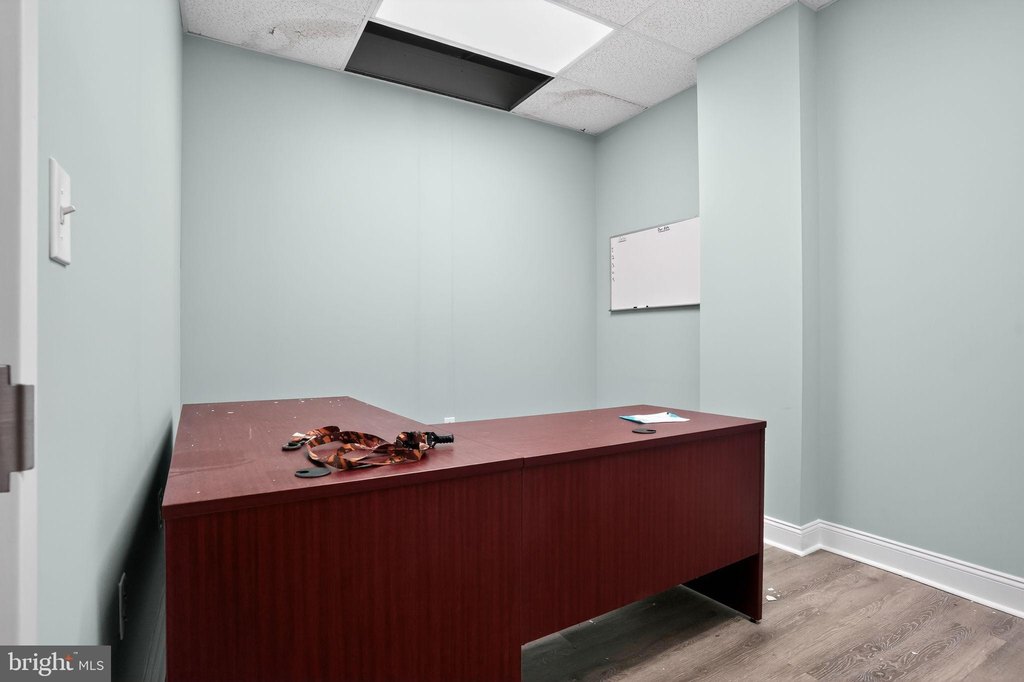
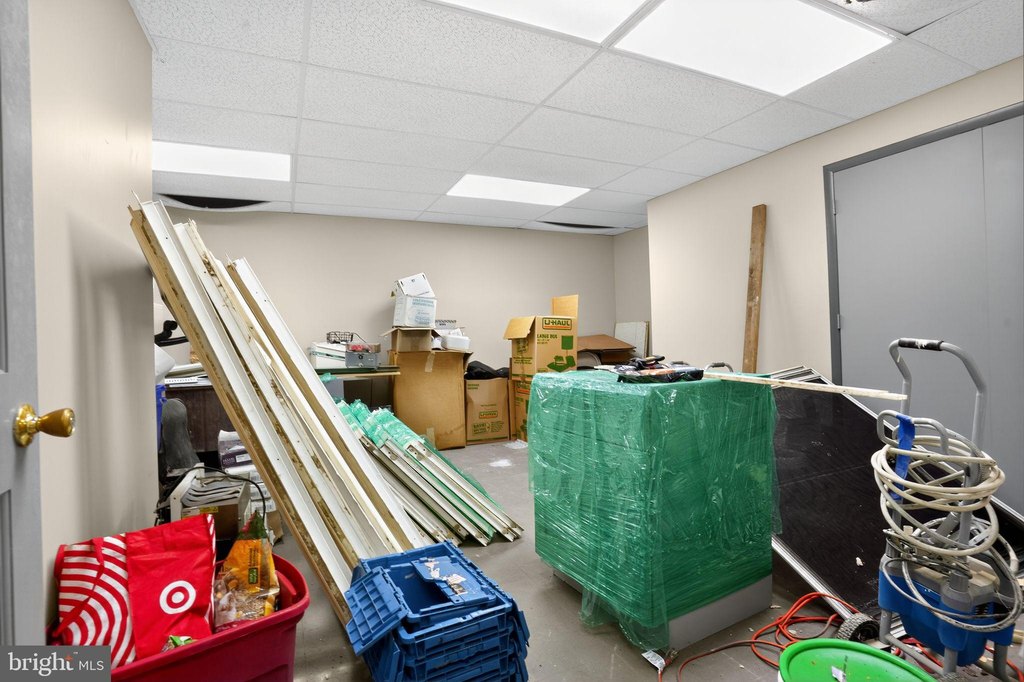
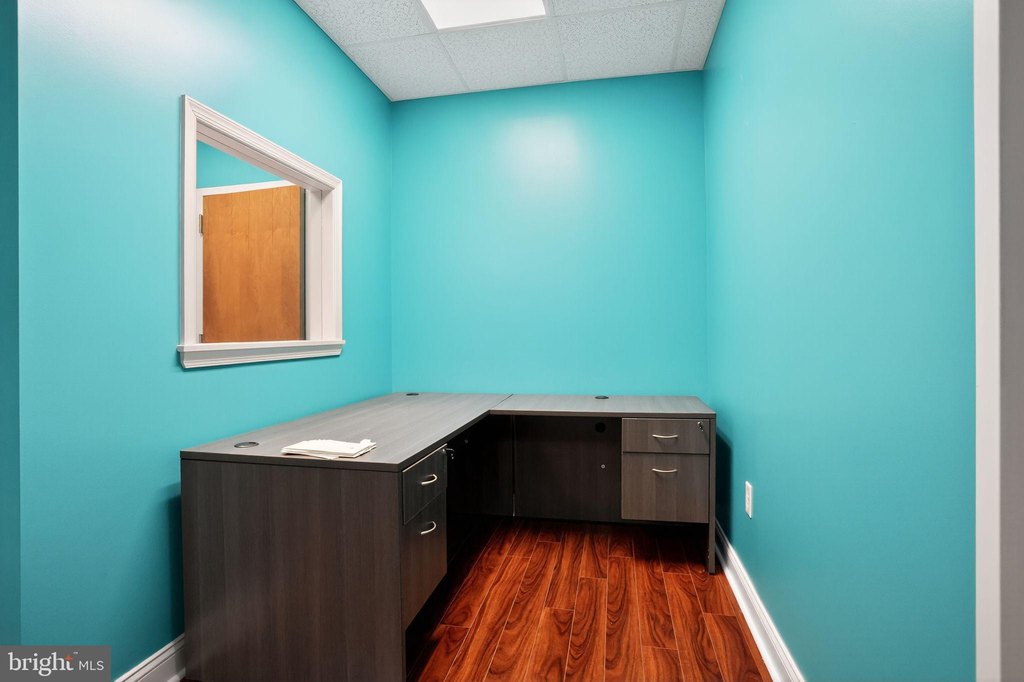
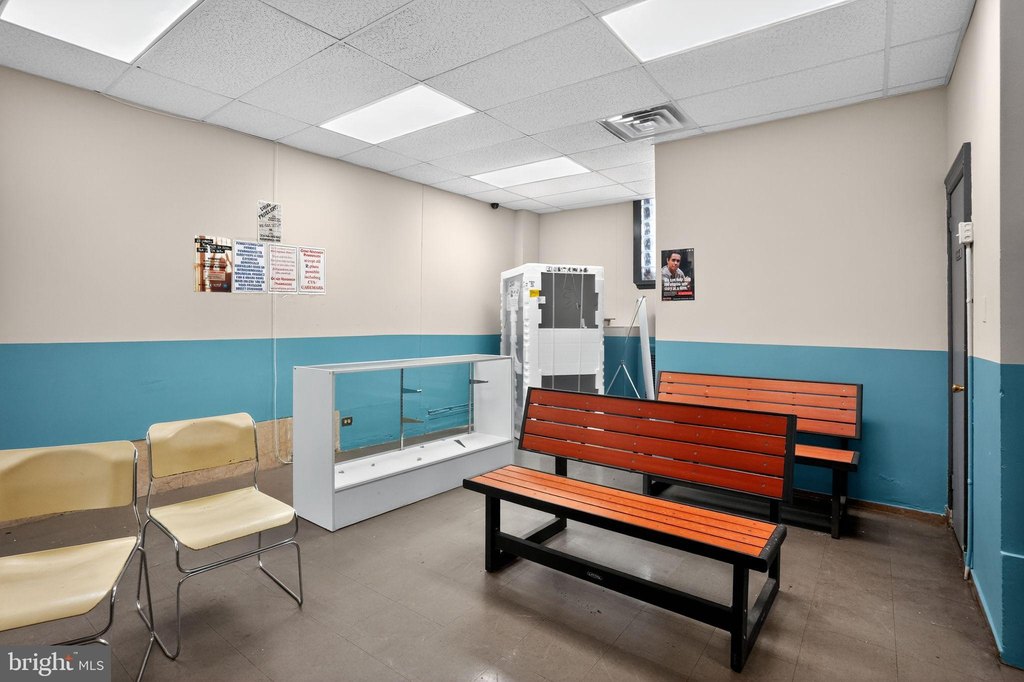
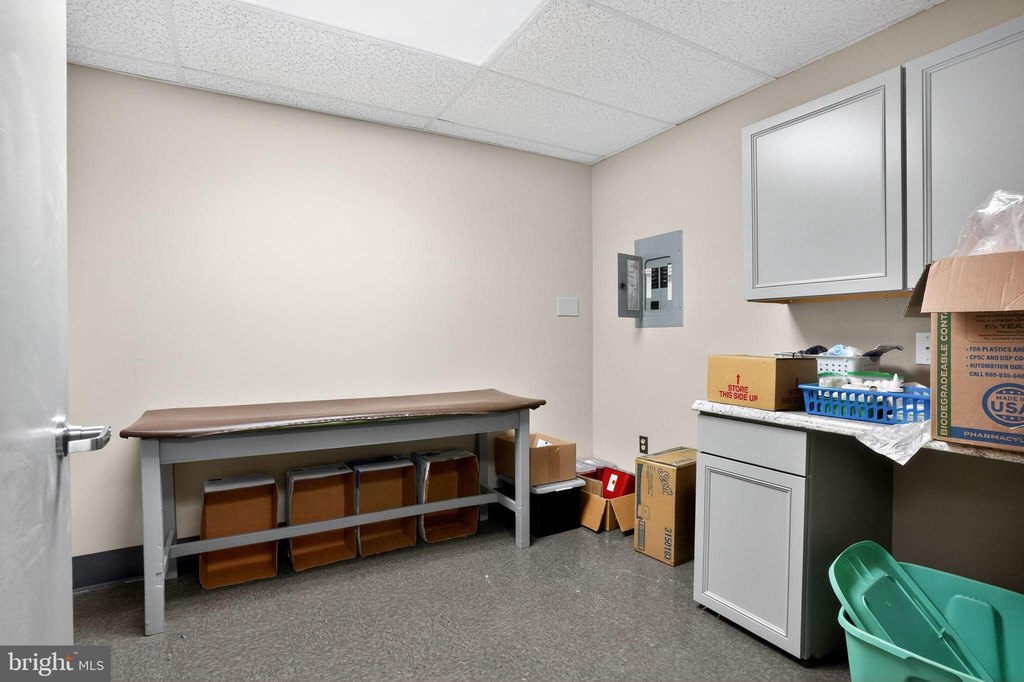
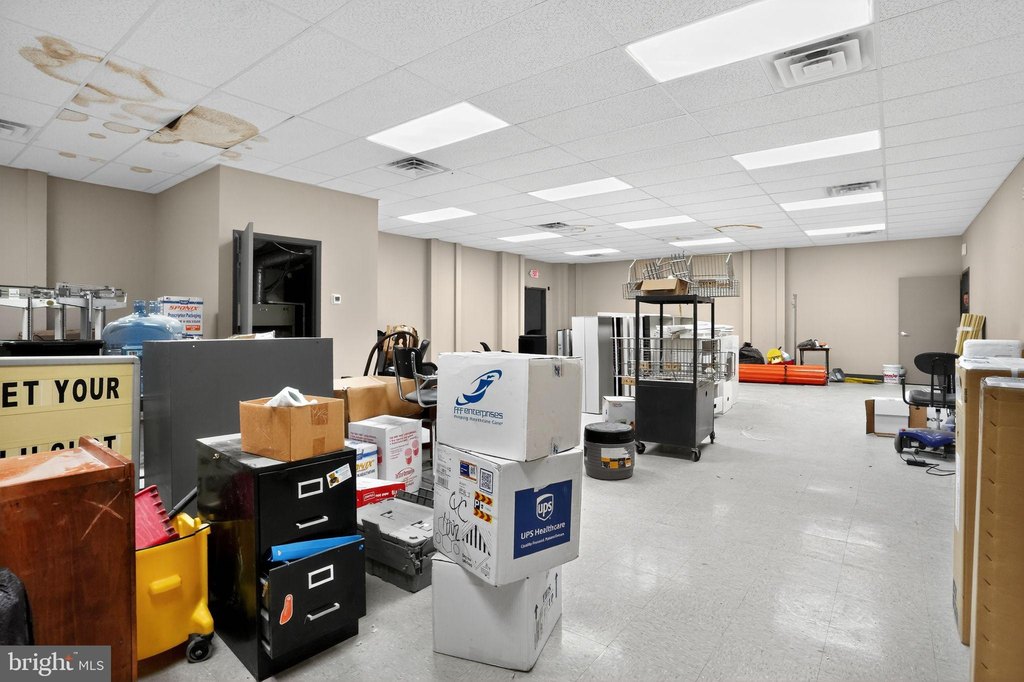
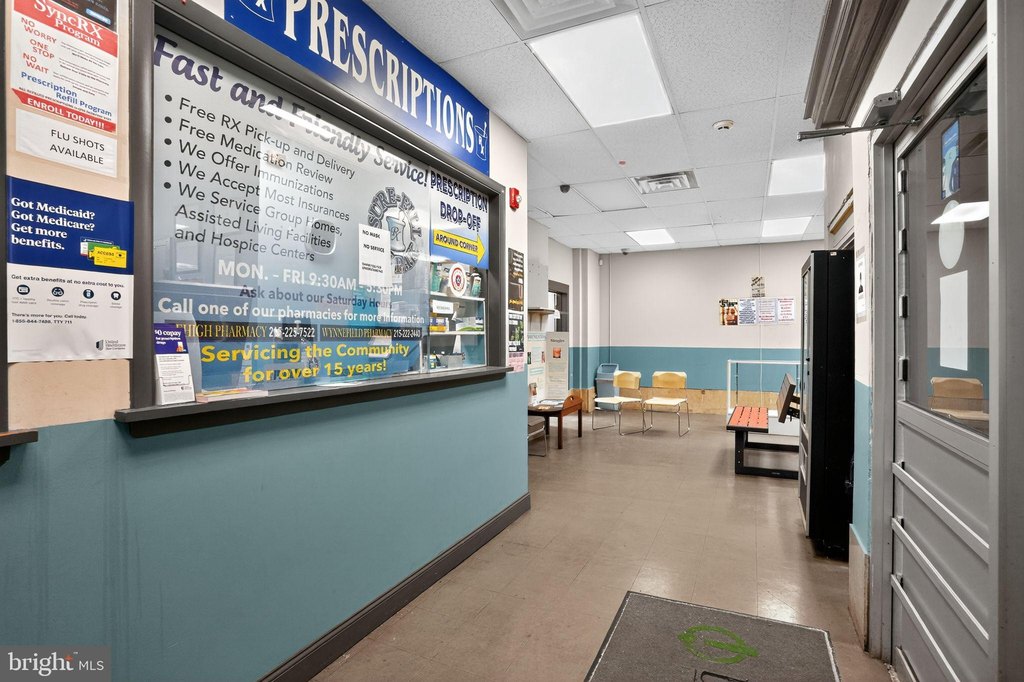
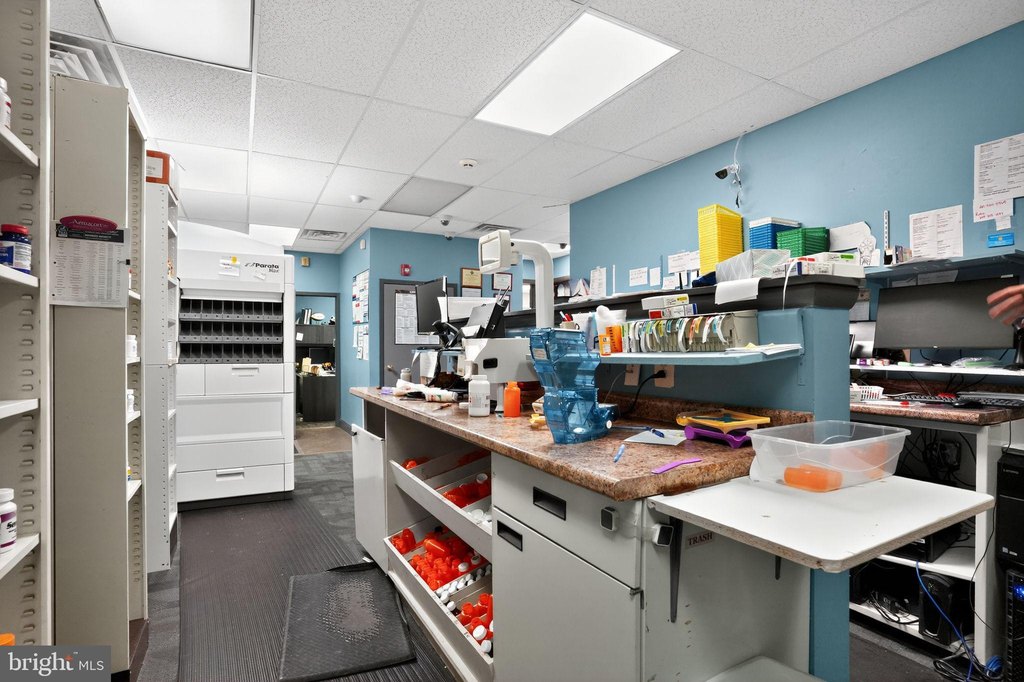
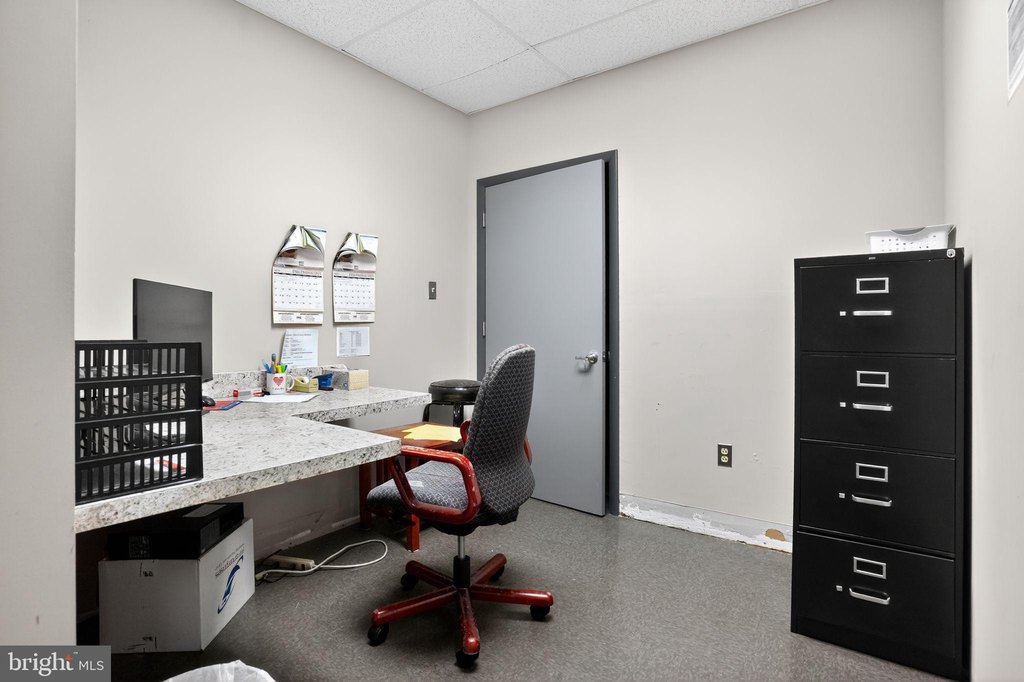
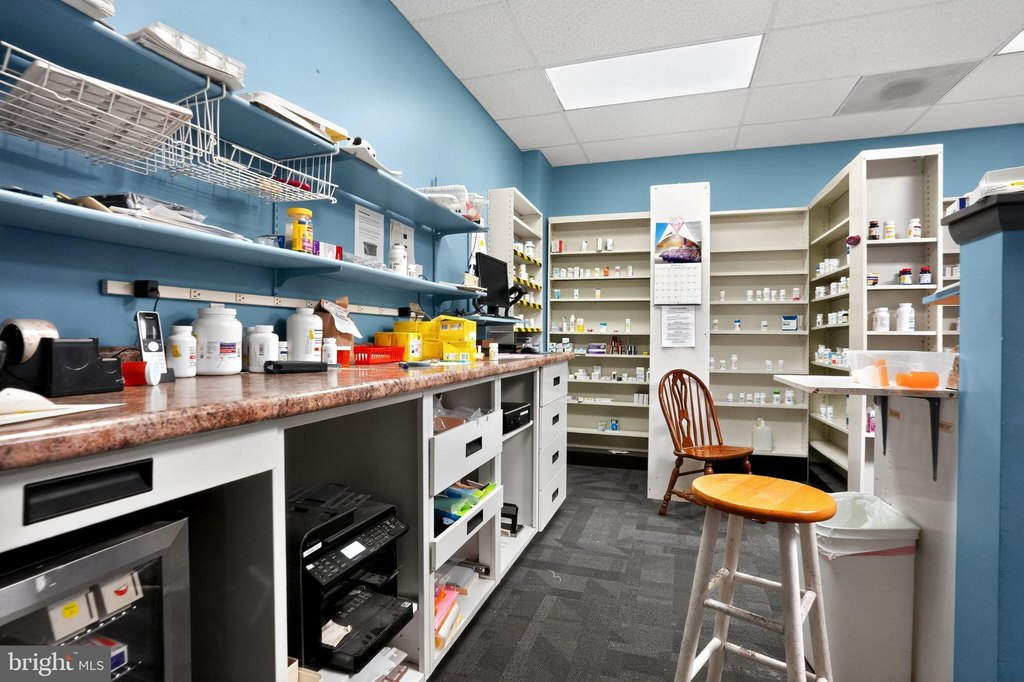
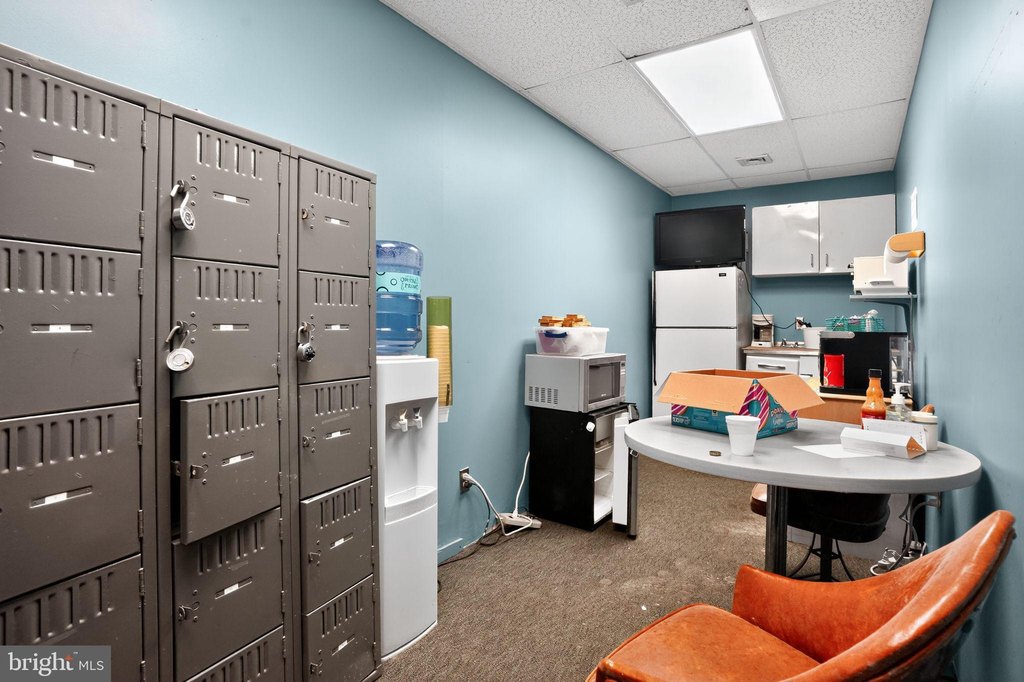
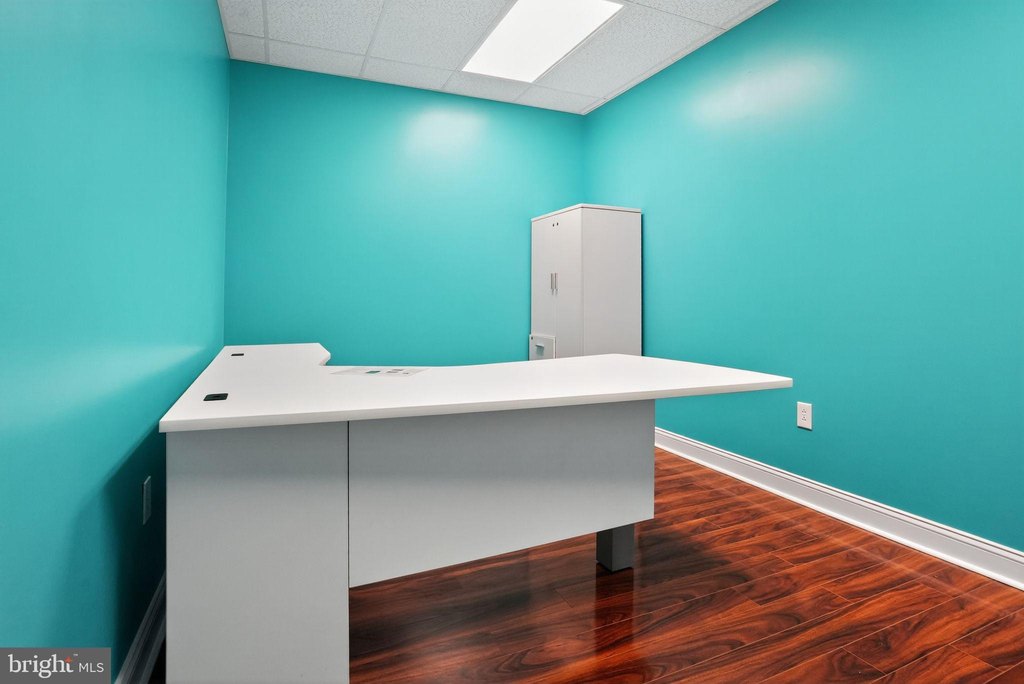
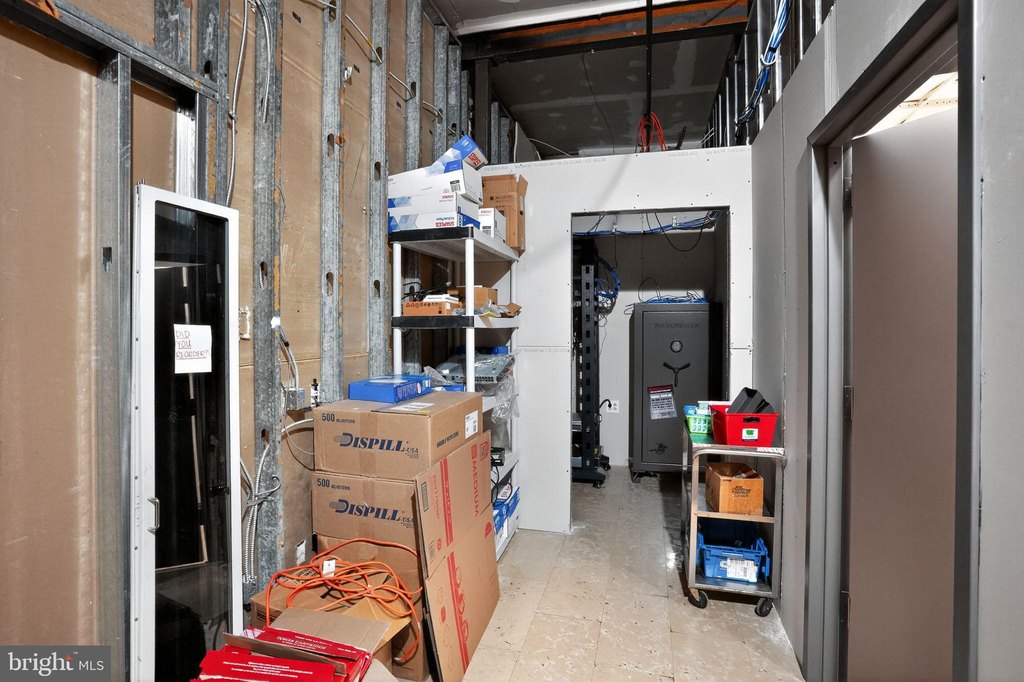
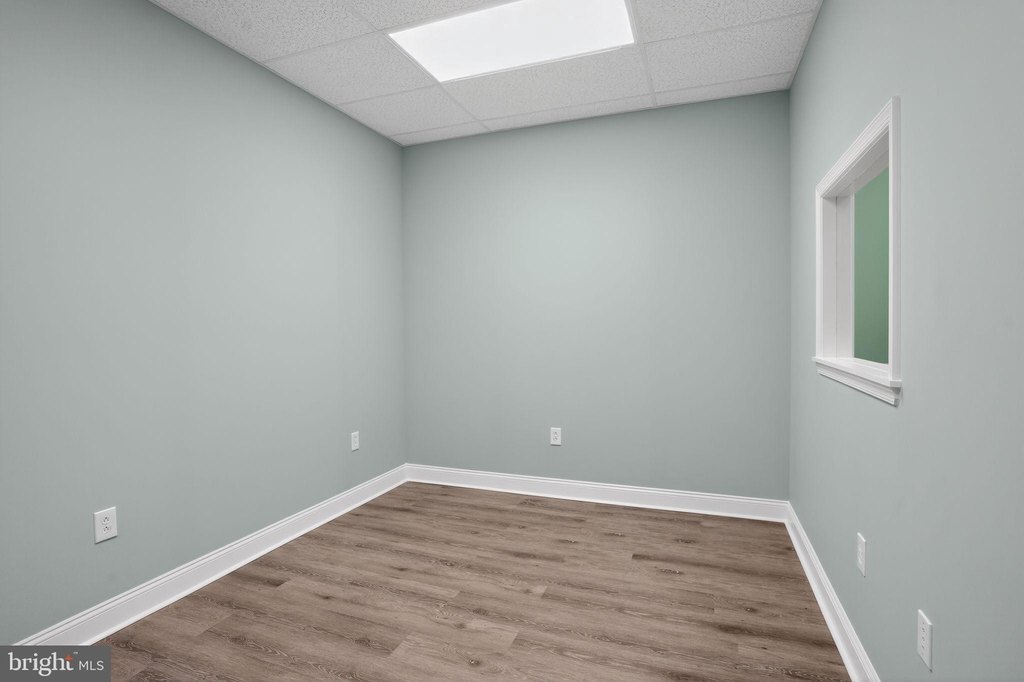
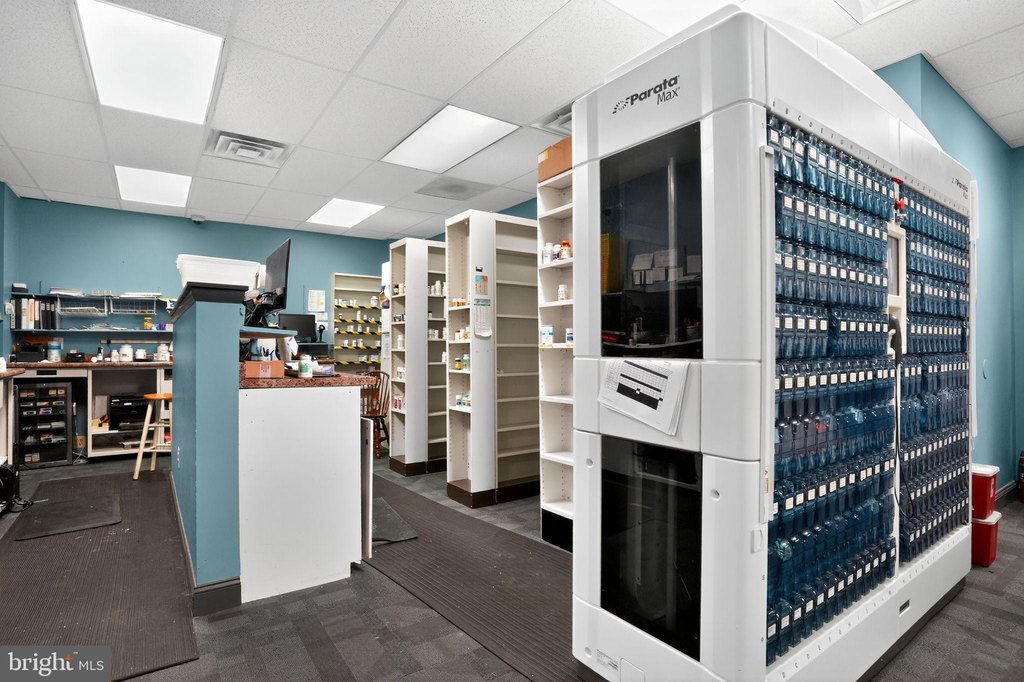
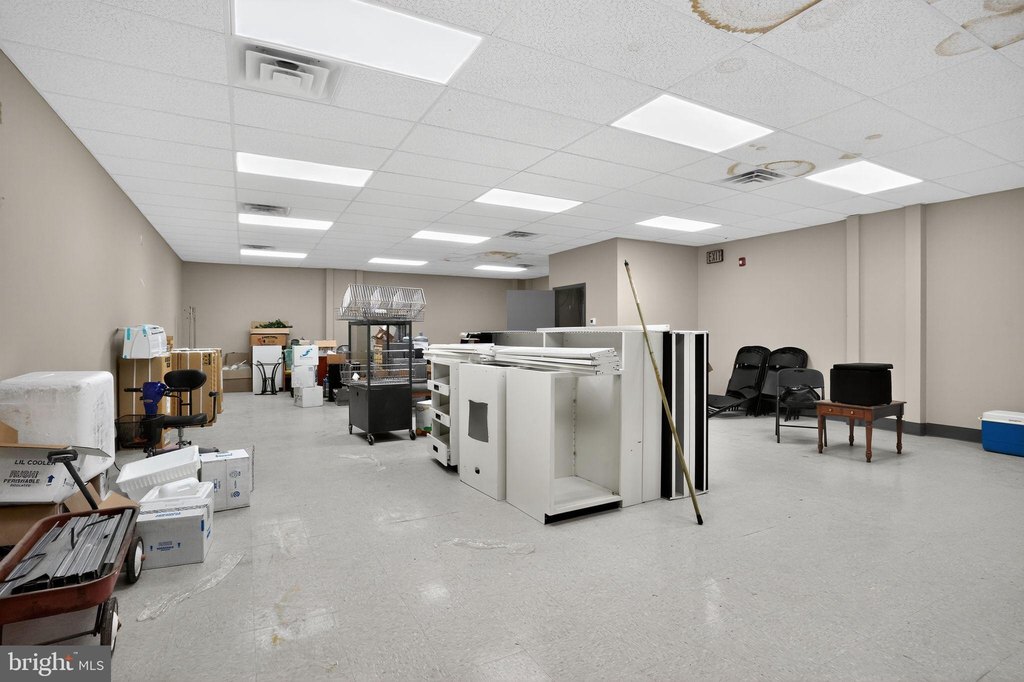
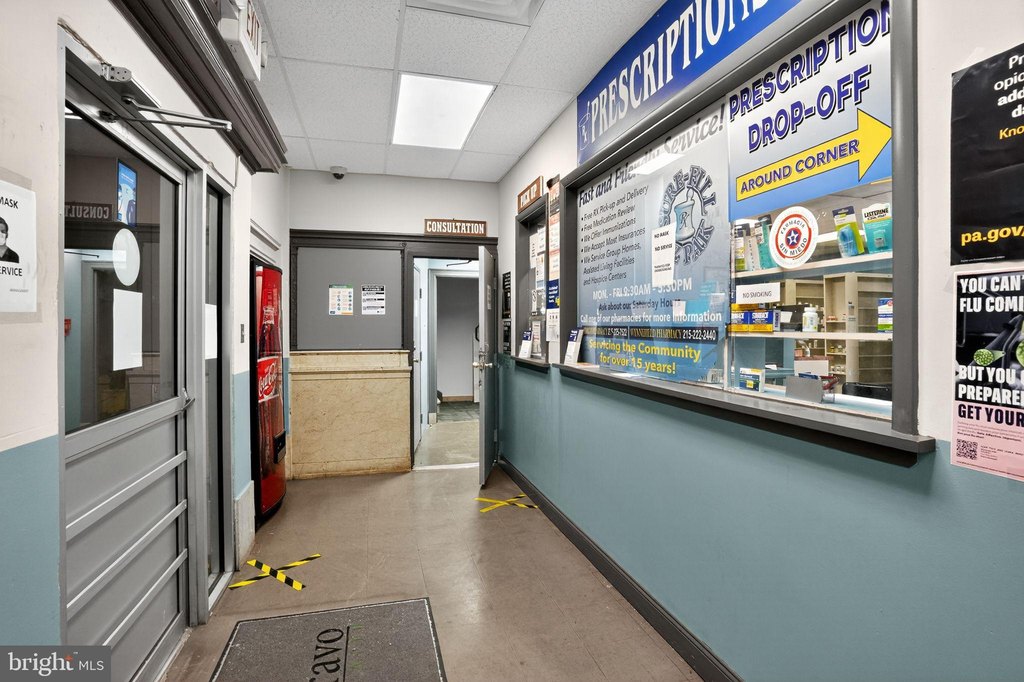
1006–8 W Lehigh Avenue is a historic, multi-tenant commercial building that was originally structured in approximately 1915 and later operated as the Lehigh Branch of the Philadelphia Savings Fund Society (PSFS), which opened between 1923 and 1924. The first floor is built out as an operational pharmacy with a managerial office, storage room, employee break room, changing room, and additional retail and pharmaceutical space, presented with a grand lobby. A separate space on the first floor includes a doctor’s office with a waiting room and a vaccination room. The second floor was used as a former executive suite with floor-to-ceiling windows and high ceilings, and the rear also includes three office spaces.
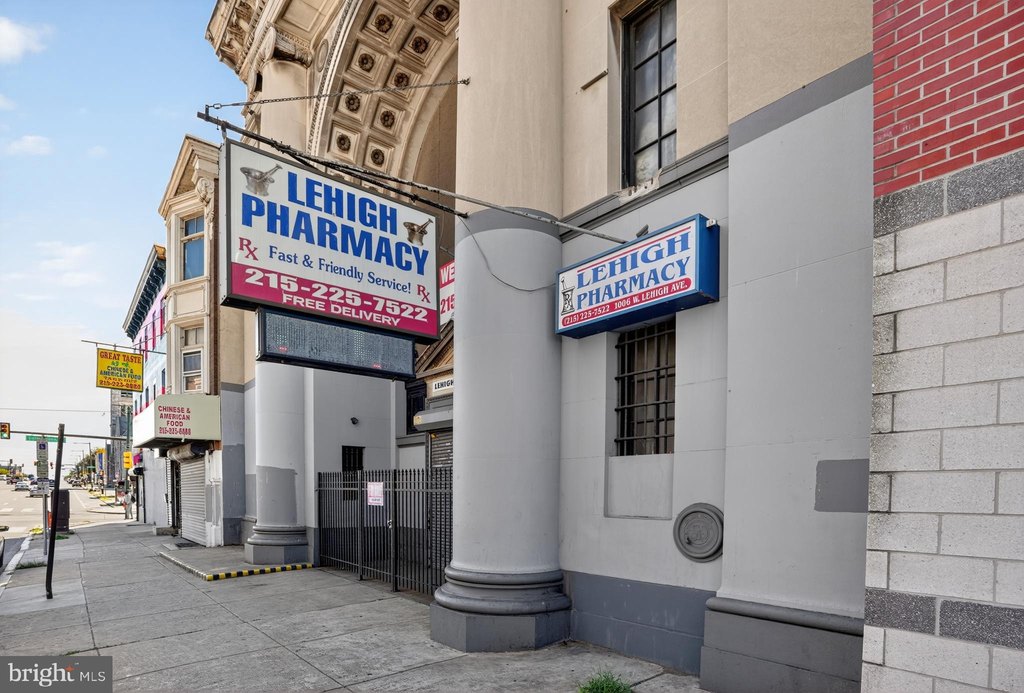
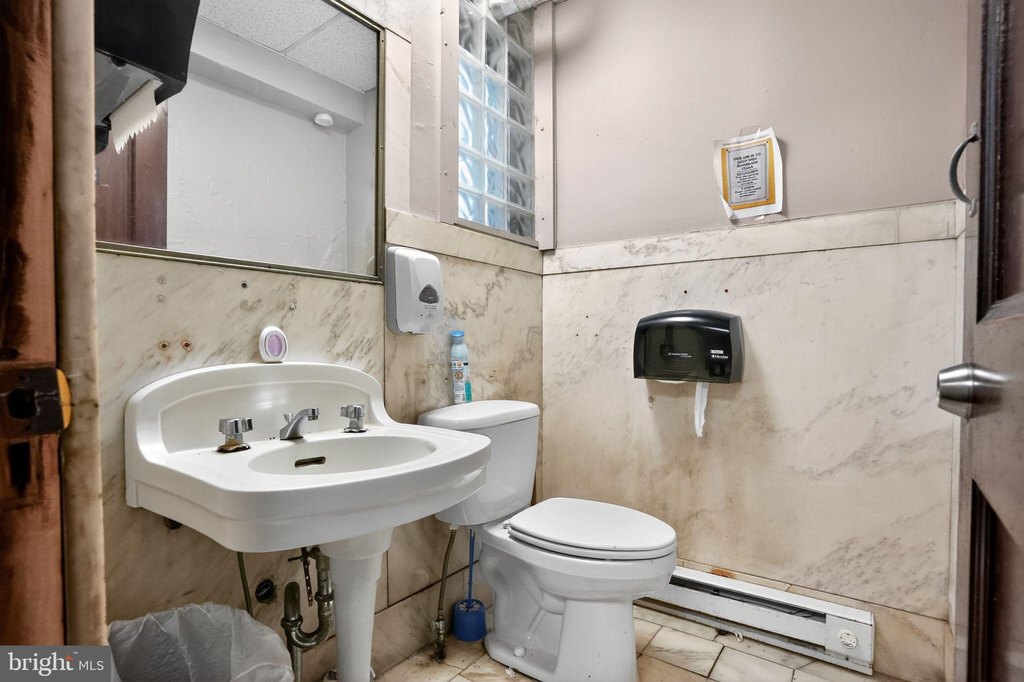
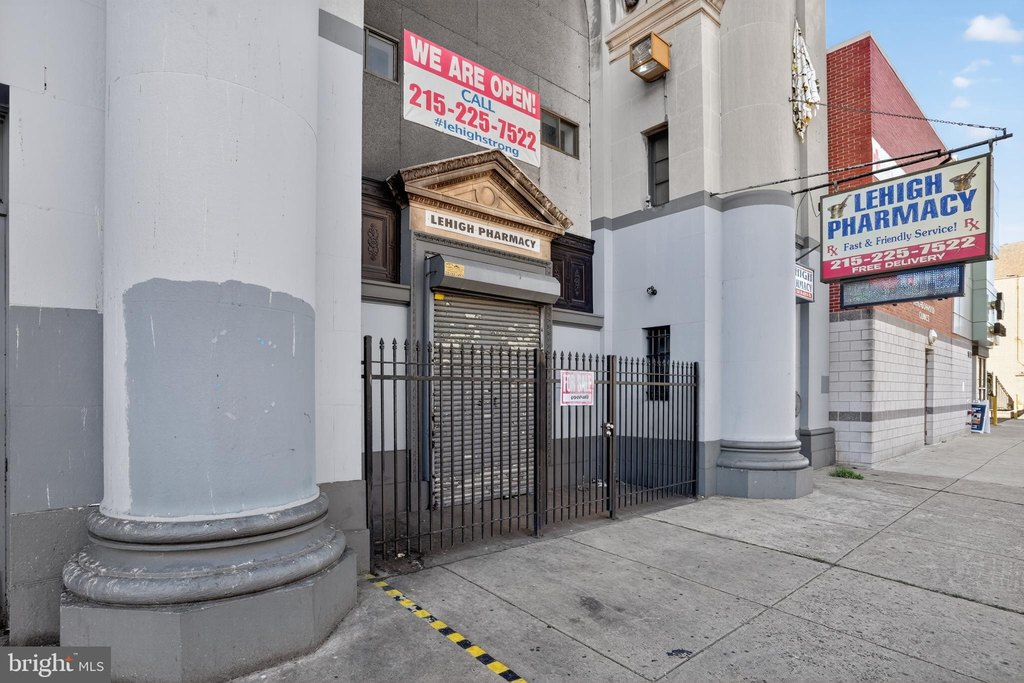
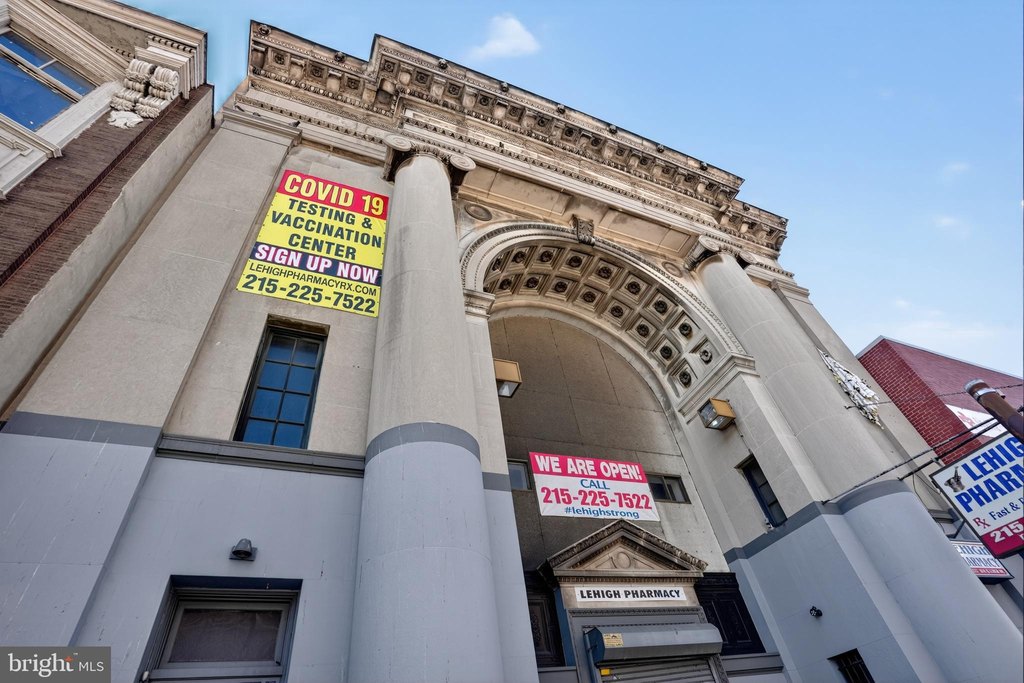
The property is located at the intersection of W. Lehigh and Germantown Avenues in a high-traffic area, close to the Broad Street Line’s North Philadelphia Station and Temple University’s main campus. The offering is described as CMX-2 zoned and includes 7 parking spots in a parking lot behind the building. Large Greek pillars and original hardwood and marble-tiled flooring contribute to the building’s character.
The property is located at the intersection of W. Lehigh and Germantown Avenues in a high-traffic area, close to the Broad Street Line’s North Philadelphia Station and Temple University’s main campus. The offering is described as CMX-2 zoned and includes 7 parking spots in a parking lot behind the building. Large Greek pillars and original hardwood and marble-tiled flooring contribute to the building’s character.
Key Highlights
- High‑traffic location with CMX‑2 zoning, offering commercial multi‑tenant opportunities and potential for supplemental income through subleasing.
- Large 5700 sq ft building with existing operational pharmacy build‑out, including retail space, offices, and storage.
- Historic building with architectural significance, formerly a branch of PSFS designed by prominent architects.
Financial Insights For Office B
Simulate Cap Rate and NOI
NOI Build-Up
- Vacancy
- income lost from leasable area expected to sit empty during the year — subtracted from gross rent.
- EGI (Effective Gross Income)
- gross rent minus vacancy losses — the realistic income before paying operating costs.
- OpEx (Operating Expenses)
- recurring costs to operate the property (property tax, insurance, utilities, maintenance, management) — excludes financing and capital improvements.
- NOI (Net Operating Income)
- income a property generates after operating costs but before financing and taxes.
| Component | $ | $/SF |
|---|---|---|
| Gross rent | $125.2k | $21.96 |
| − Vacancy | −$25.2k | −$4.41 |
| EGI | $100.0k | $17.55 |
| − OpEx | −$25.0k | −$4.39 |
| NOI | $75.0k | $13.16 |
5,700 SF · lease $21.96/SF/yr · vacancy 20.10% · expense 25.00%
Alternative Uses
Best Use
Specialty Retail
$1.18M
$1.03M – $1.38M
NOI $82,593 @ 7.0% cap · market cap 9.96%
Second Best
Office B
$1.07M
$937.6K – $1.25M
NOI $75,009 @ 7.0% cap · market cap 9.05%
Theoretical Best
Multifamily LT 5
$1.39M
$1.22M – $1.62M
NOI $97,270 @ 7.0% cap · market cap 11.73%
Zoning and permitted uses should be independently verified with authorities.
Property Analytics
Property Profile
Location Intelligence
Current Use


Similar Off Market Nearby
- Genoa Healthcare — 2600 N American St, Philadelphia, PA 19133
- Apollo Pharmacy — 460 W Lehigh Ave, Philadelphia, PA 19133
- Rite Aid Pharmacy — 2131-59 N Broad St, Philadelphia, PA 19122
- Eyelash growth serum Shop — 1013 W Huntingdon St, Philadelphia, PA 19133
- WinkNdMink — 2519 Germantown Ave, Philadelphia, PA 19133
Frequently Asked Questions
What type of property is this?
Drug store - Former bank building with an operational pharmacy, doctor’s office, and executive-style second floor, plus 7 behind-building parking spots.
Where is this drug store located?
The property is located at 1006-8 W LEHIGH Avenue Philadelphia, PA.
What is the asking price?
The asking price for this property is $829,000.
What are key features of this property?
This property features: High‑traffic location with CMX‑2 zoning, offering commercial multi‑tenant opportunities and potential for supplemental income through subleasing.; Large 5700 sq ft building with existing operational pharmacy build‑out, including retail space, offices, and storage.; Historic building with architectural significance, formerly a branch of PSFS designed by prominent architects.


