Renovated Duplex with Private

For Sale
$350,280
1005/1007 Haynes Street, San Marcos, TX 78666
Residential, San Marcos, TX
Property Size1,273 SF
Lot Size0.28 Acres
Price / SF$275.16
Days on Market516
Property Features for 1005/1007 Haynes Street
General Information
Property type
Residential Multi Family
Property subtype
Duplex
Bedrooms
2
Full bathrooms
1
Rooms
Bedroom 2, Bedroom 1, Bathroom 1
Interior features
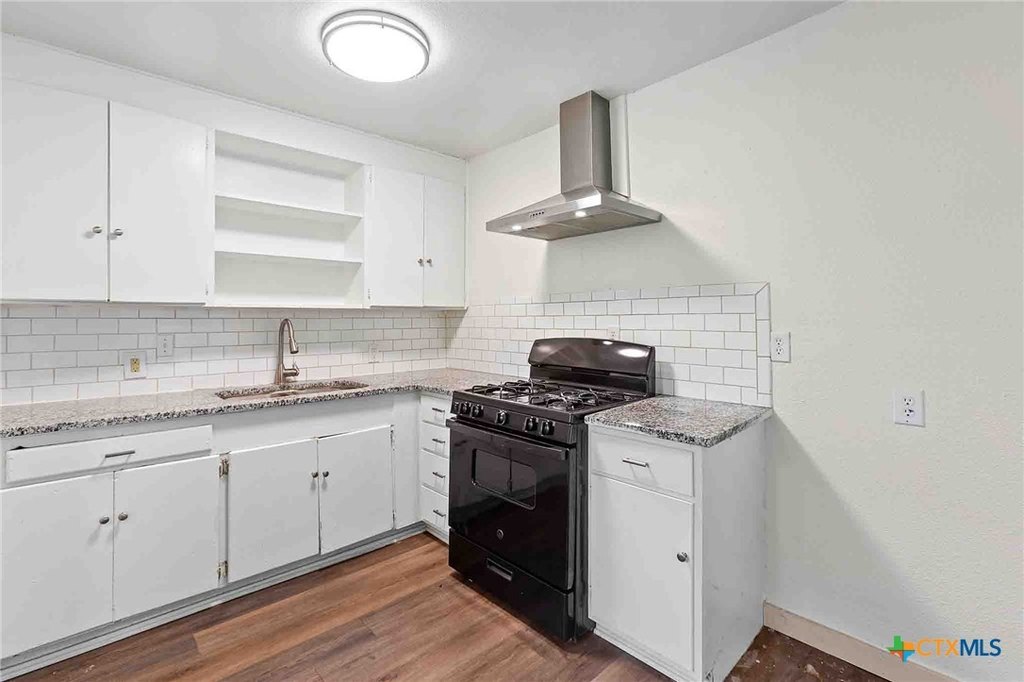
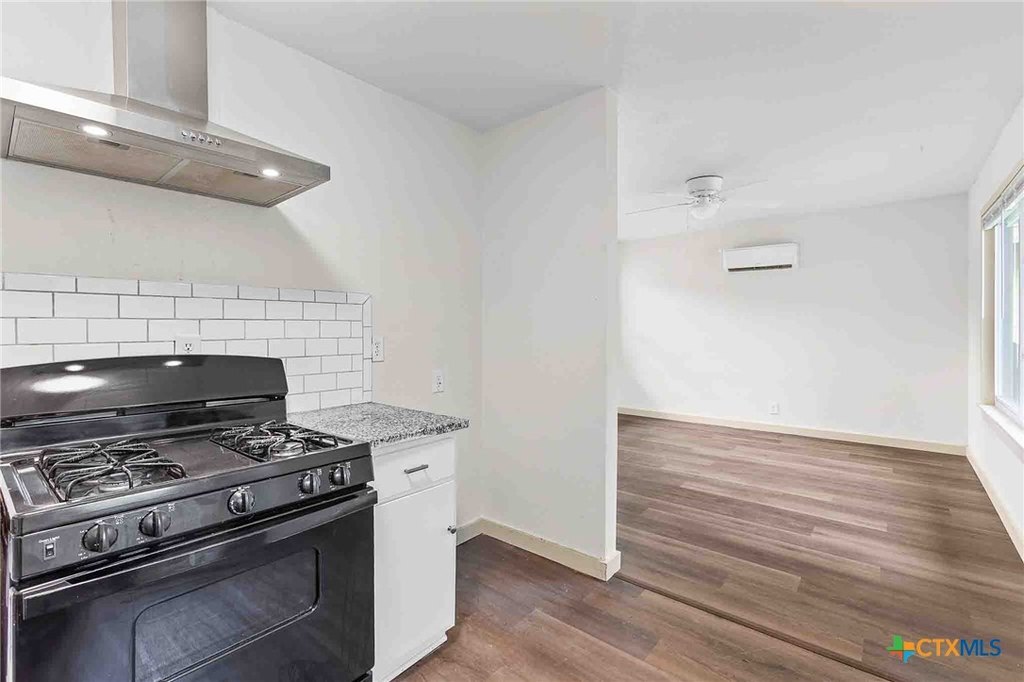
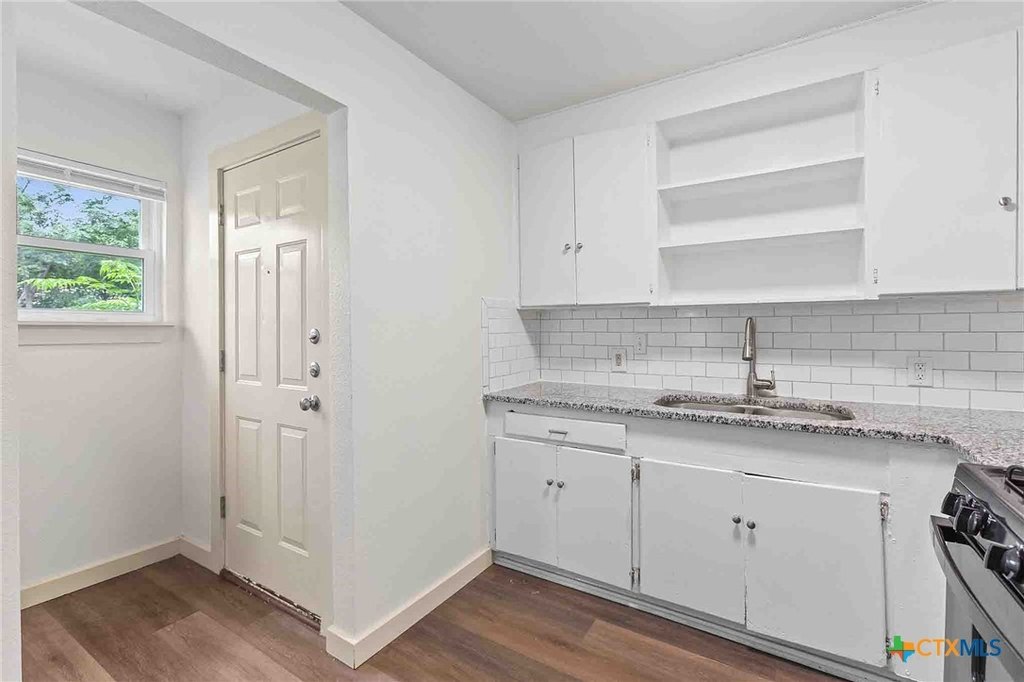
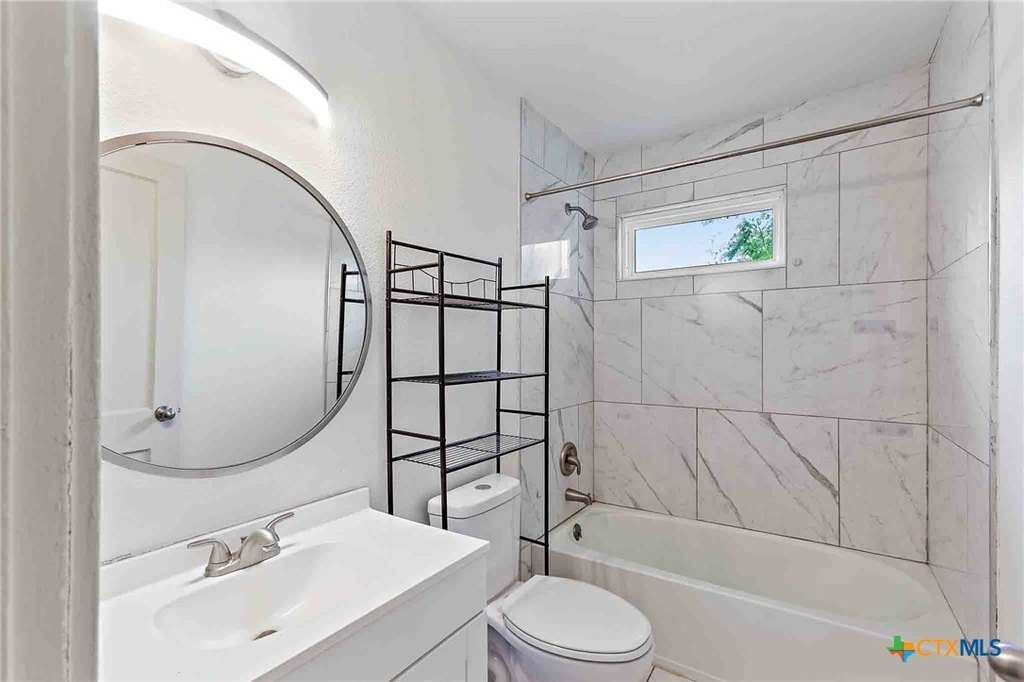
CeilingFans, TubShower, GraniteCounters
Exterior features
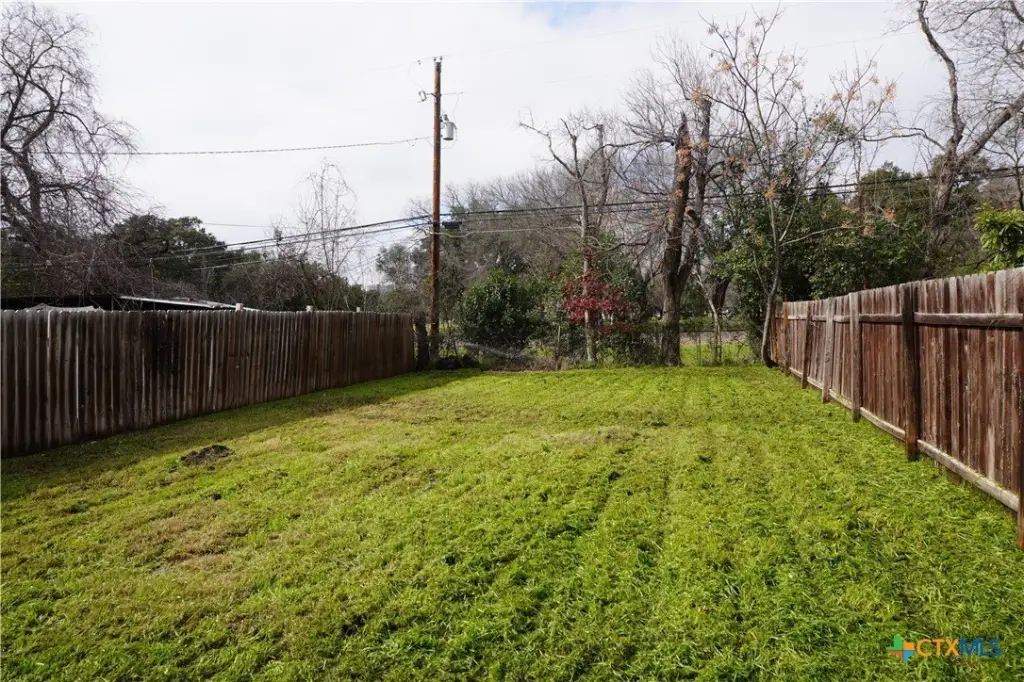
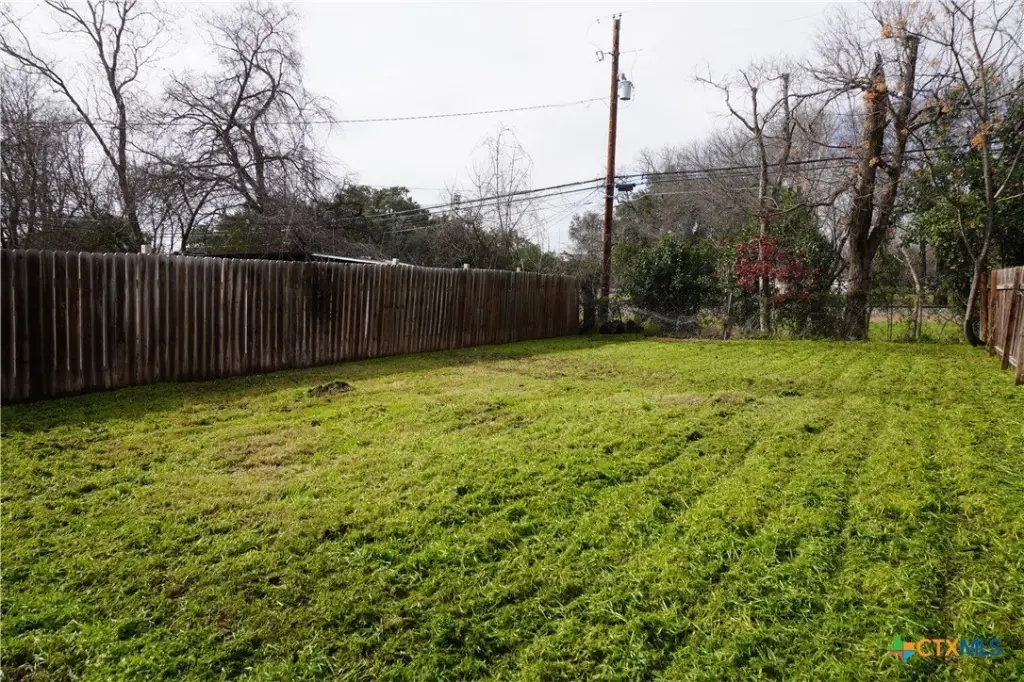
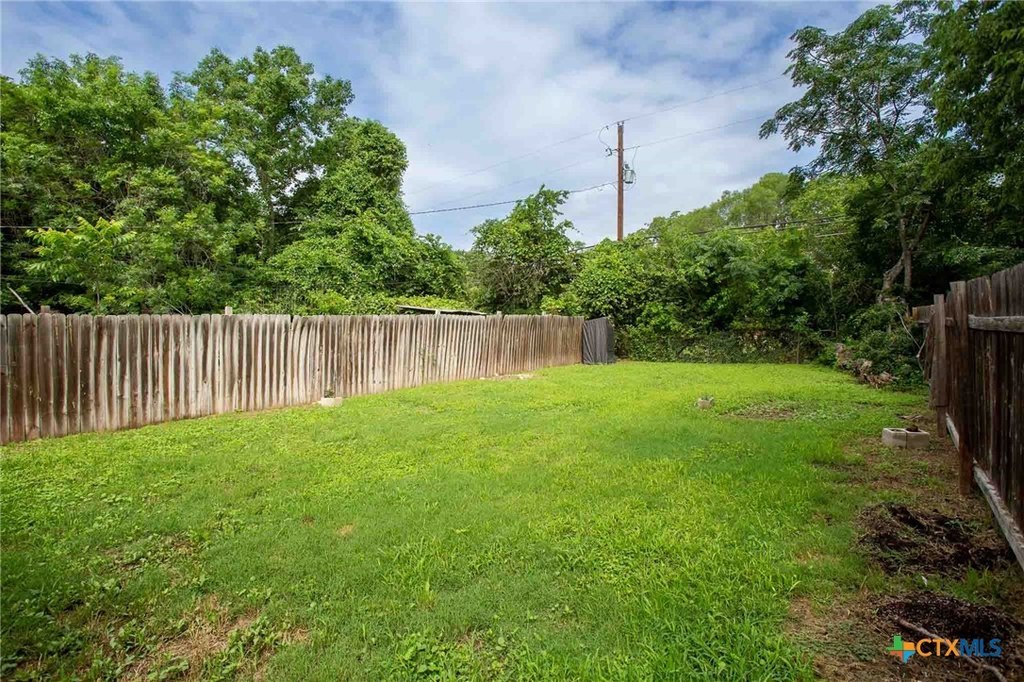
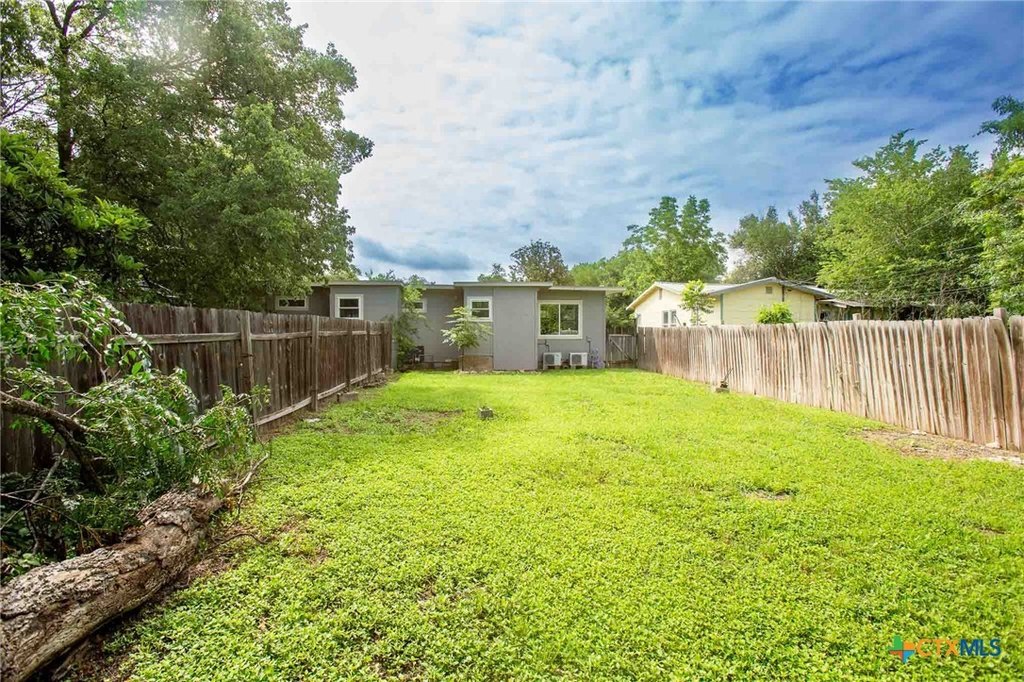
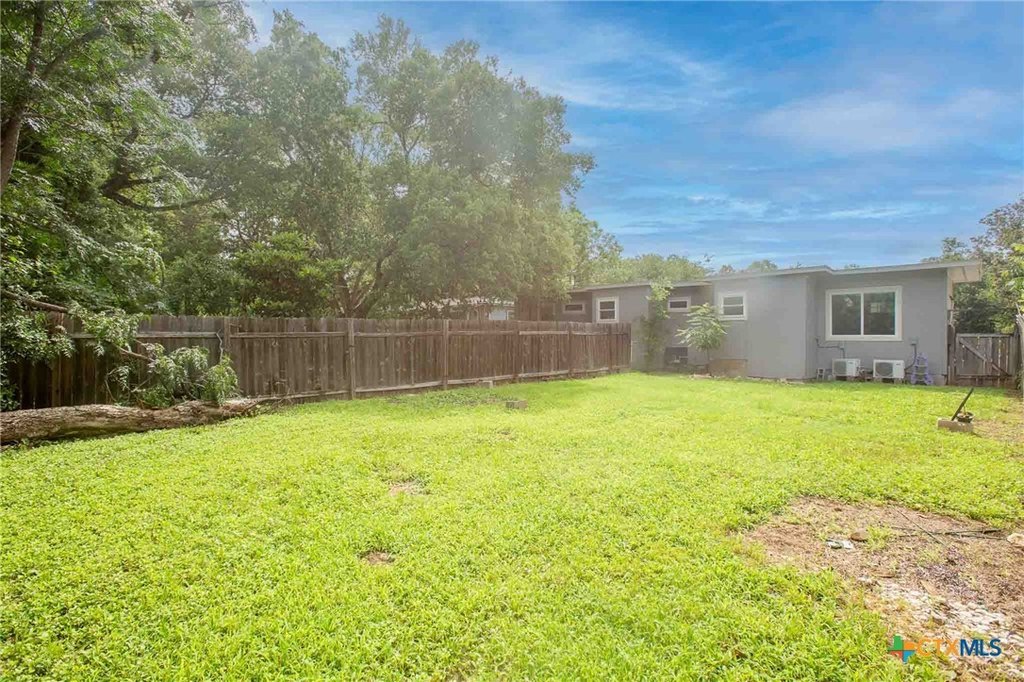
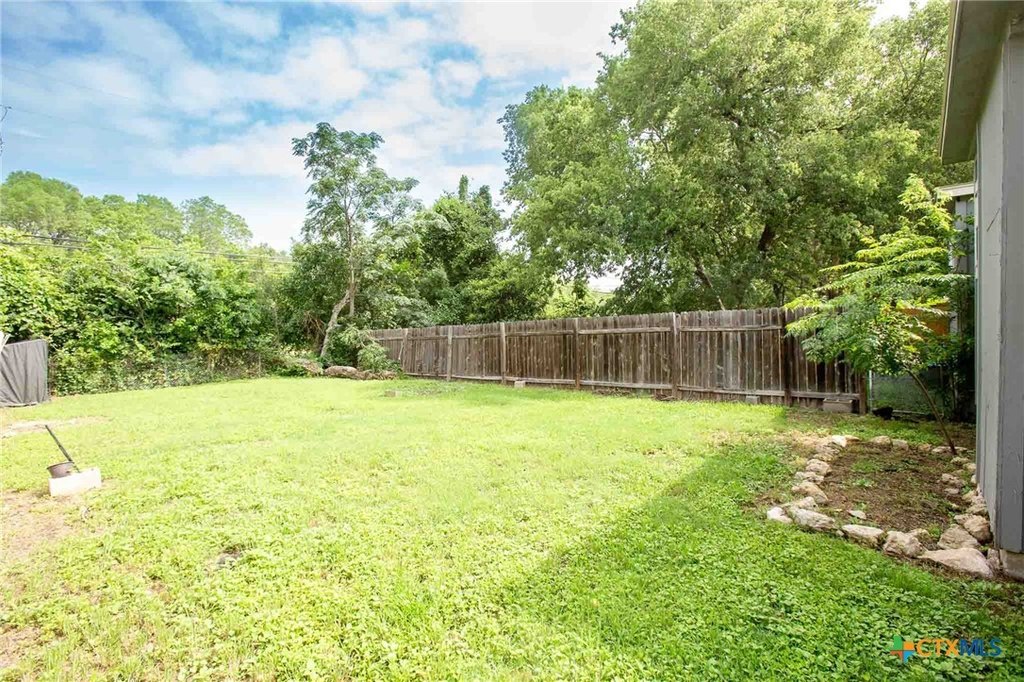
PrivateYard, Lighting
Appliances
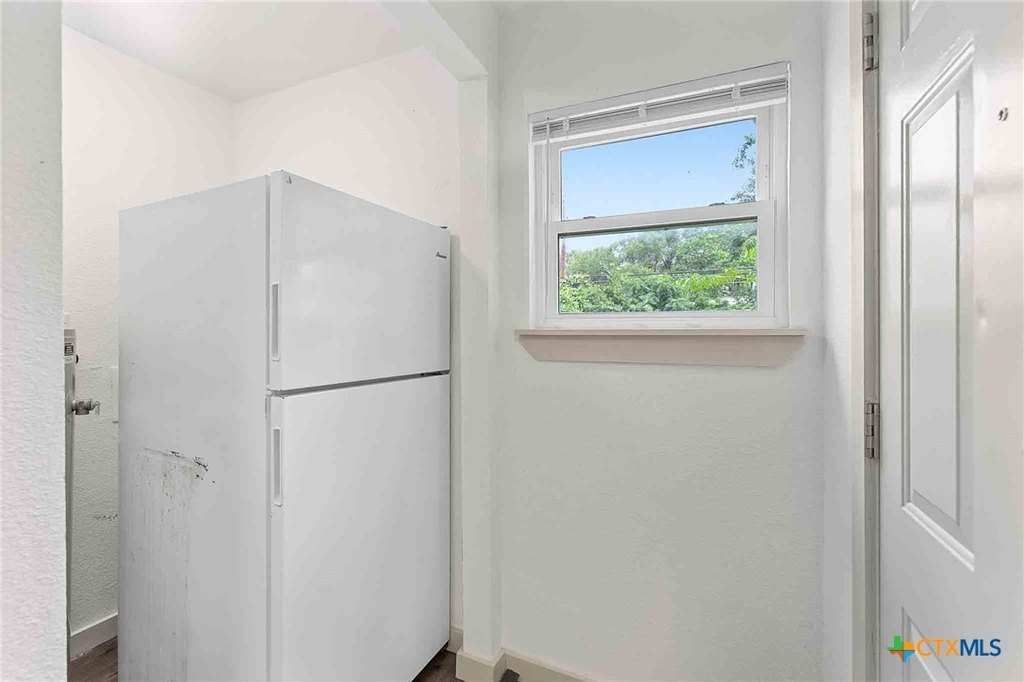
Dishwasher, ElectricRange, Refrigerator, RangeHood
Subdivision
Rio Vista Terrace
Lot features
City Lot, Less Than Quarter Acre
Elementary school district
San Marcos Cisd
Middle school district
San Marcos Cisd
High school district
San Marcos Cisd
Directions
Take Hopkins and turn right on Riverside. Left on Haynes.
Standard status
Active
APN
R39176
Size
1,273 SF
Lot size
0.28 Acres
Taxes and HOA fees
Tax Year
2023
Tax Description
RIO VISTA TERRACE 57-106 LOT 2 BLK 6 QUINCY LEE A GEO#339430746370
Tax Annual Amount
4201
Legal Description
RIO VISTA TERRACE 57-106 LOT 2 BLK 6 QUINCY LEE A GEO#339430746370
Utilities
Heating system
Central
Cooling system
Central Air
Water source
Public
Amenities
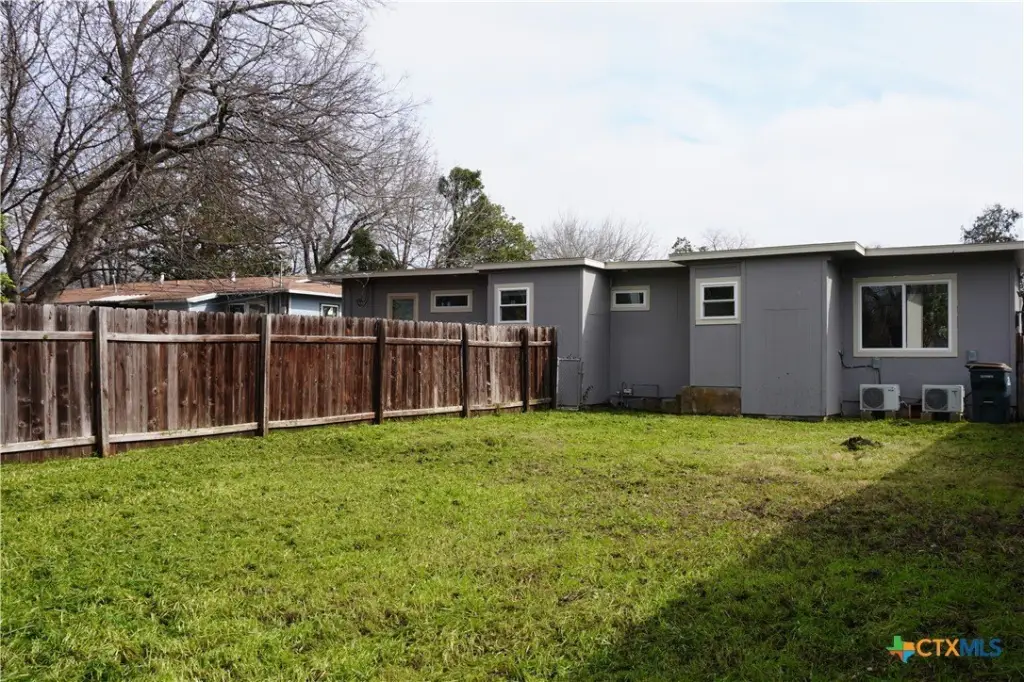
large fenced back yard
off street parking
Building Details
Floors in Building
1
Number of units
1
Flooring type
Wood, Vinyl
Roof type
Shingle, Composition
Architectural style
Craftsman
Listing Agency:
Monica & Company Real Estate
(512) 667-9129
Listed By:
Katie Molina · License #0765560
(512) 618-5871
Added: May 18, 2025
Changed: Sep 13
Last Checked: Oct 15 at 11:06PM
MLS# 578451
Copyright © 2026 Central Texas Multiple Listing Service. All rights reserved. All information provided by the listing agent/broker is deemed reliable but is not guaranteed and should be independently verified.

Ask AI about this property
Review the available facts, identify missing information and prepare questions for the agent.
Investment Insights
Based on property information with market context.
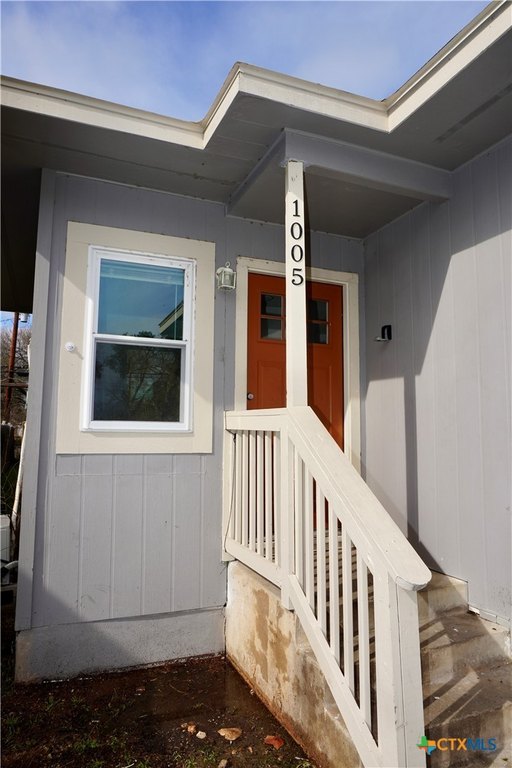
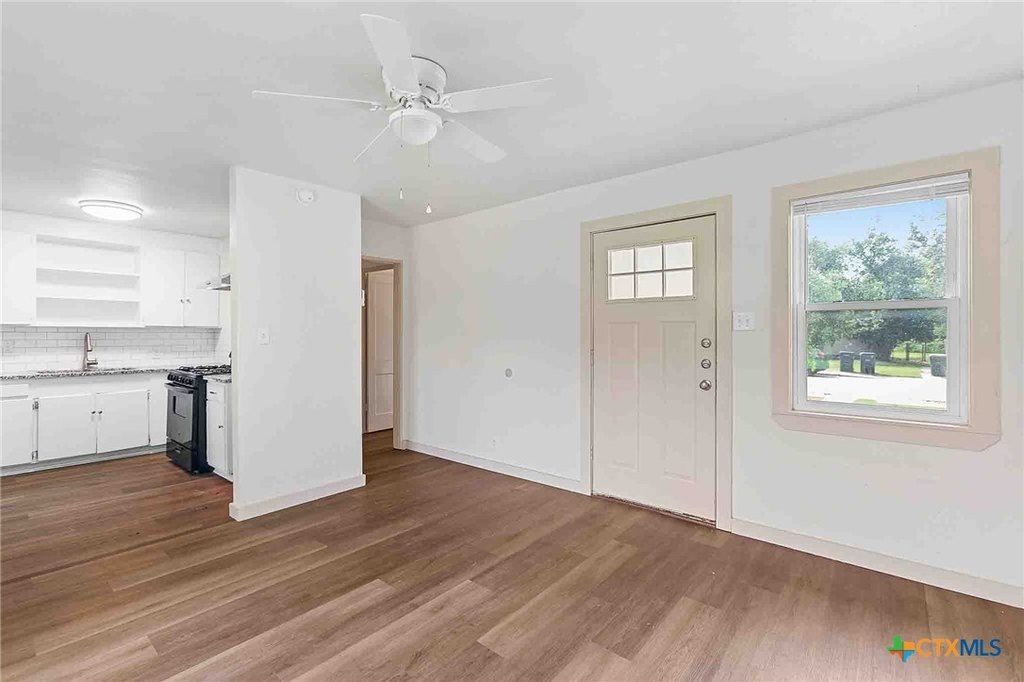
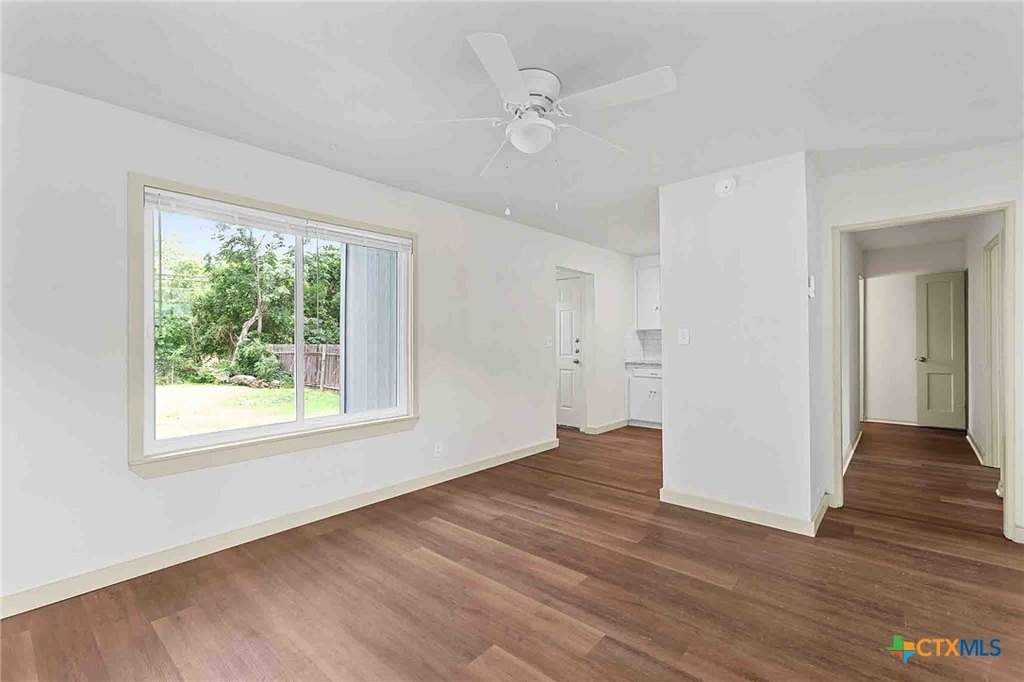
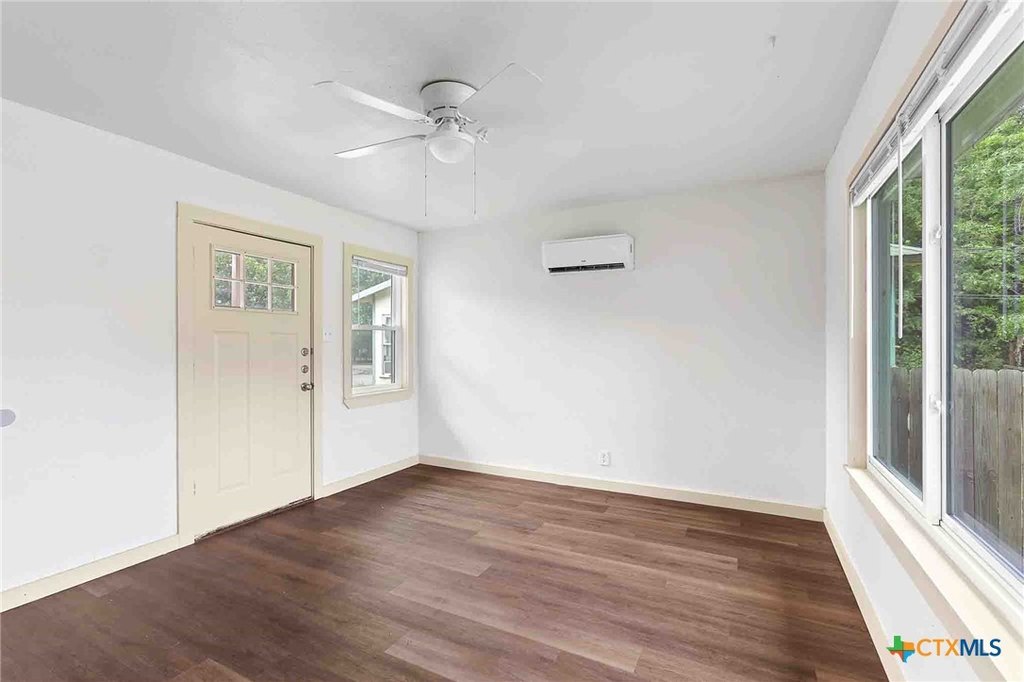
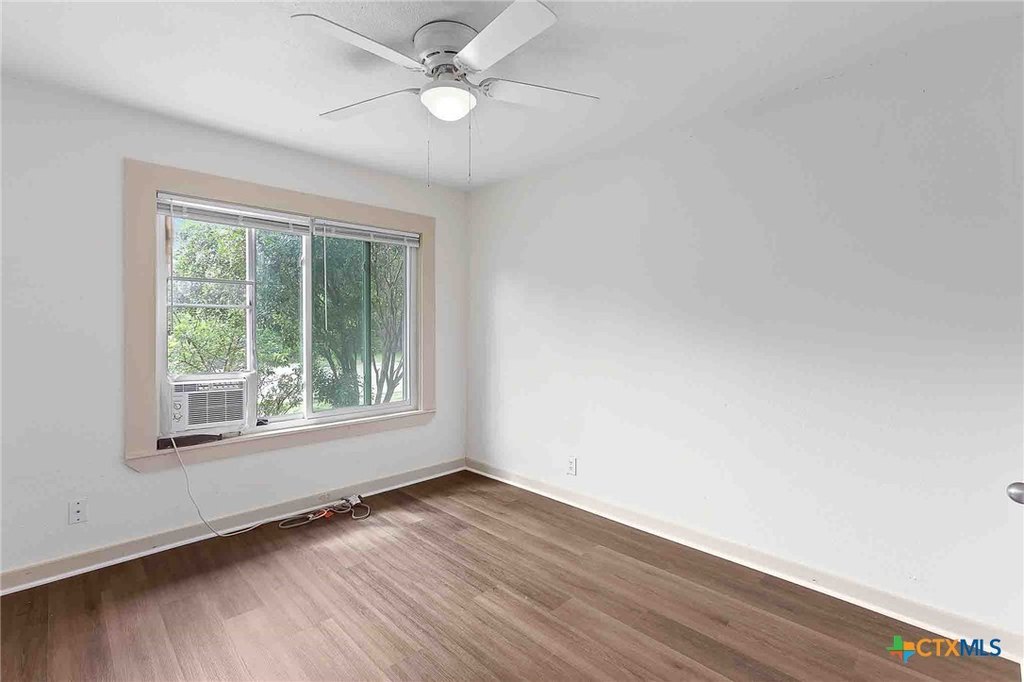
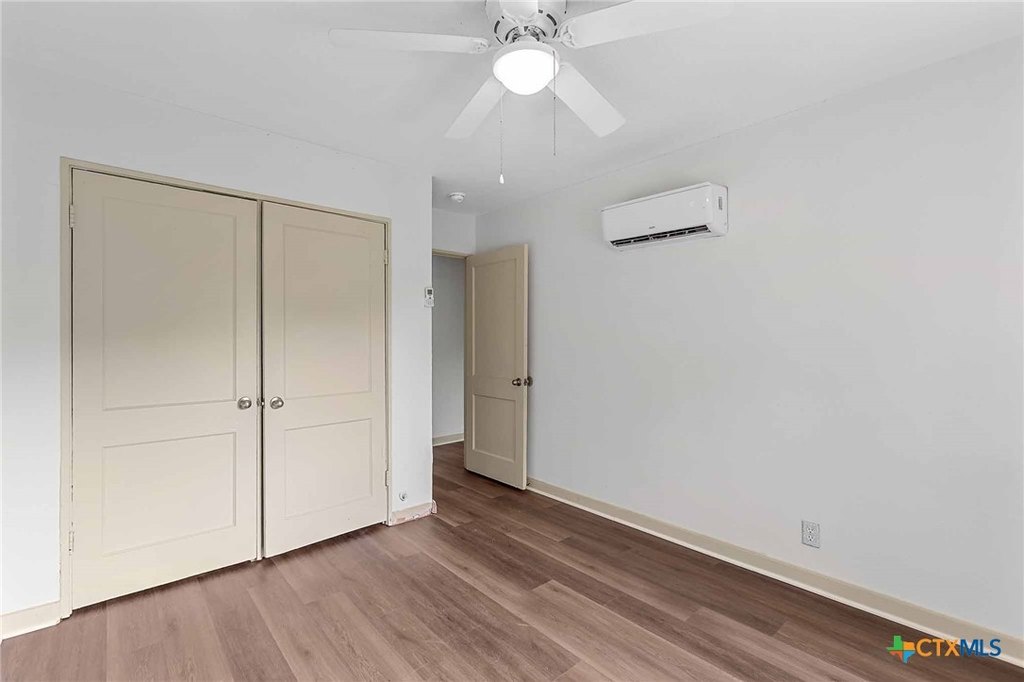
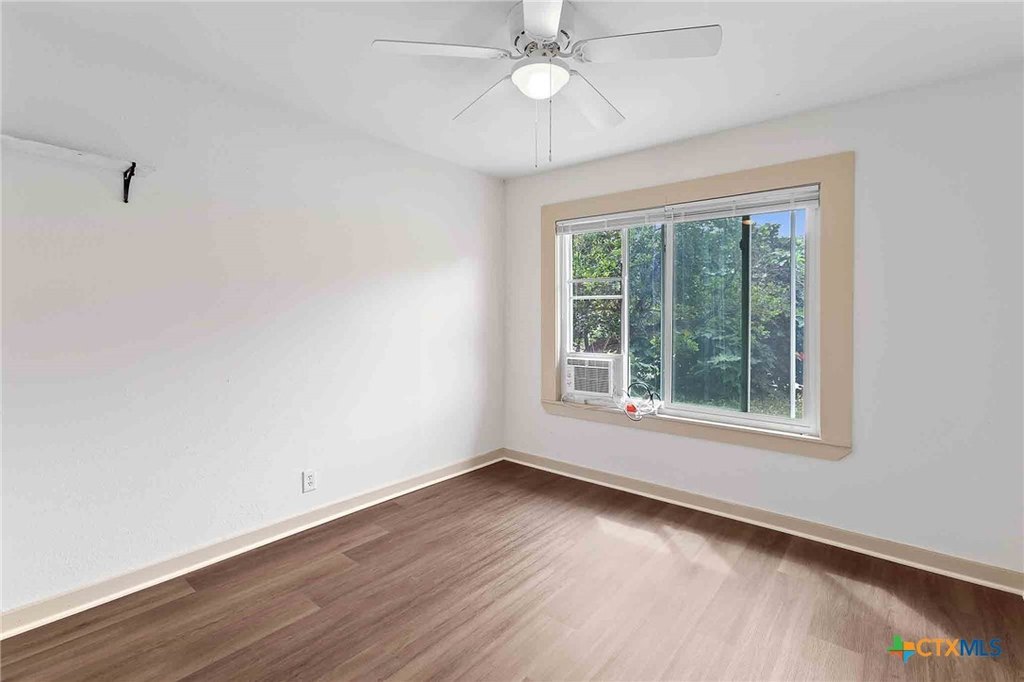
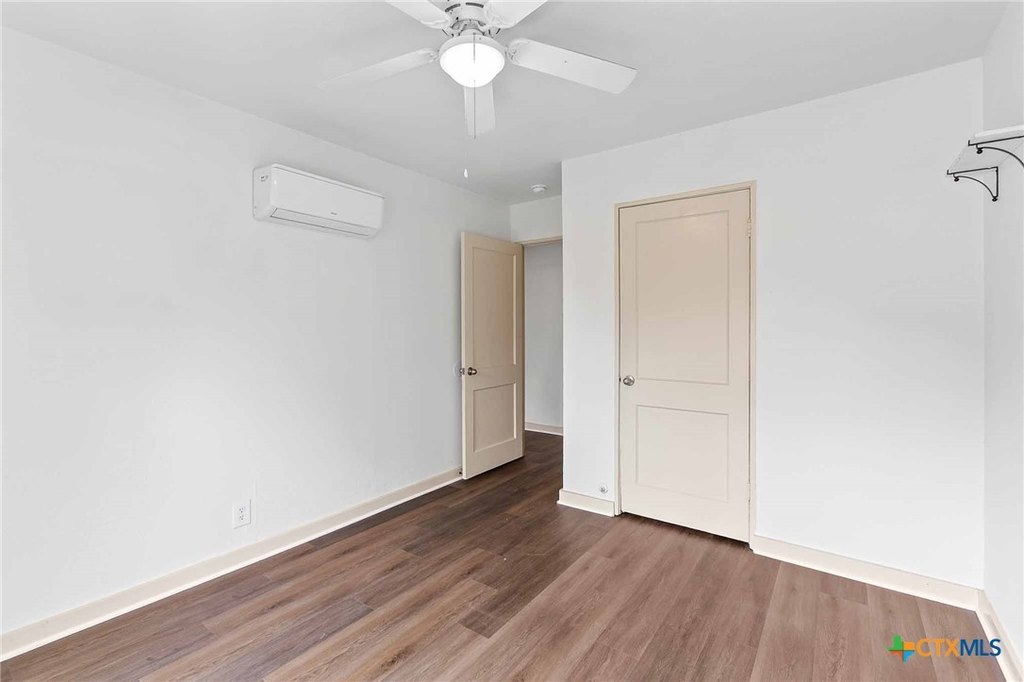
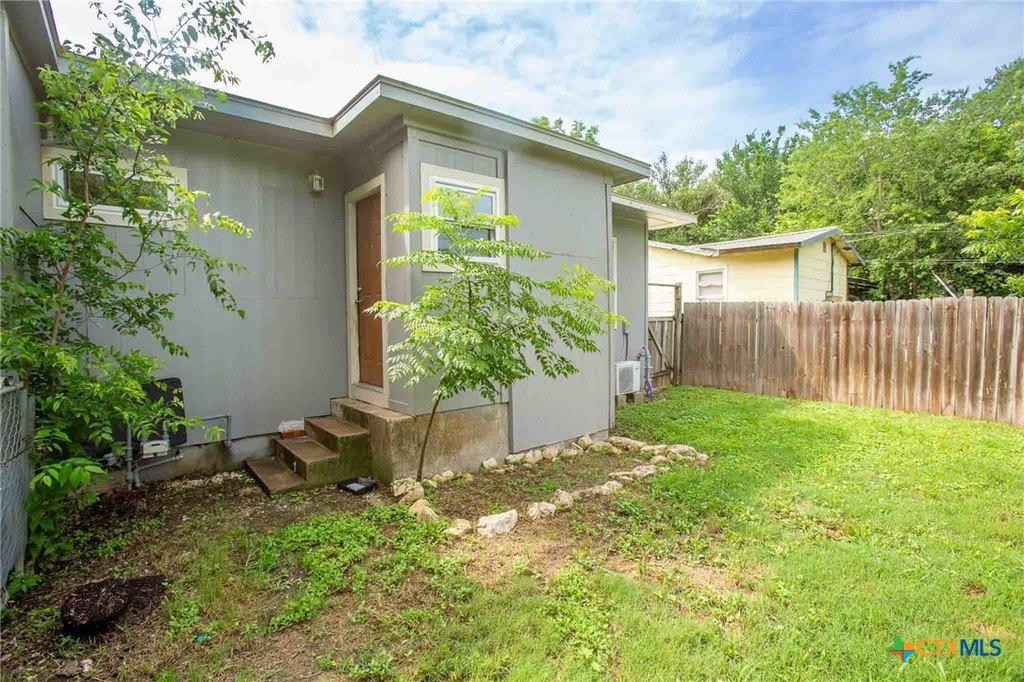
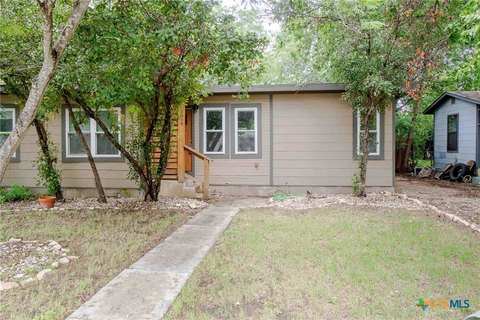
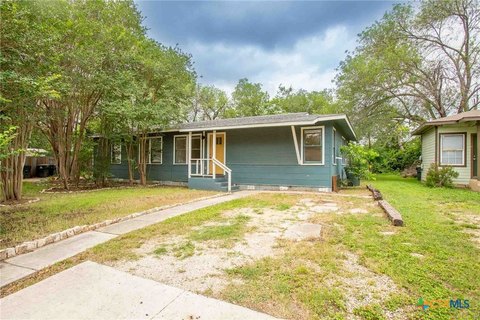
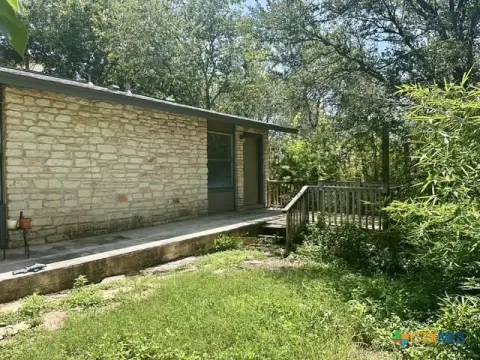
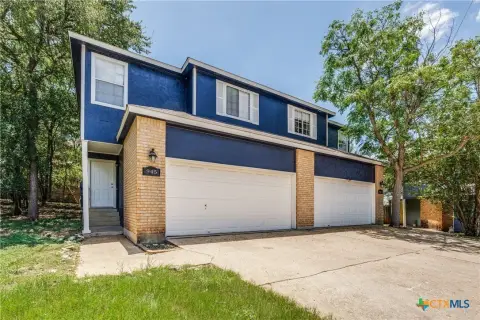
This duplex at 1005/1007 Haynes Street offers 1,273 square feet with recently updated interiors and exteriors. Improvements include new paint, countertops, flooring, and fixtures. The property features granite counters, central heating and air conditioning, ceiling fans, vinyl and wood flooring, and a kitchen equipped with a dishwasher, electric range, refrigerator, and range hood. Each unit includes a large fenced backyard, while off-street parking supports daily convenience.
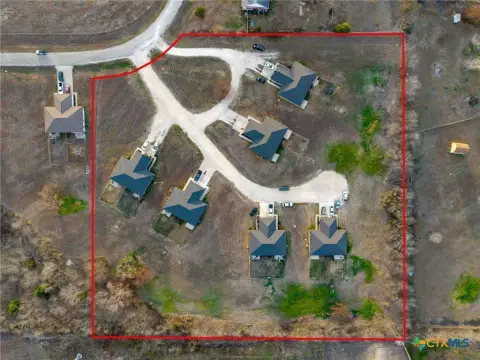
The property is approximately a half-mile walk from the spring-fed San Marcos River and is near Rio Vista Park, the Square, local restaurants, and nightlife. Public water service, shingle and composition roofing, and a Craftsman architectural style complete the physical profile. The offering represents one of four duplexes being offered, with eight total units across the group.
The property is approximately a half-mile walk from the spring-fed San Marcos River and is near Rio Vista Park, the Square, local restaurants, and nightlife. Public water service, shingle and composition roofing, and a Craftsman architectural style complete the physical profile. The offering represents one of four duplexes being offered, with eight total units across the group.
Key Highlights
- 1,273‑square‑foot duplex at 1005/1007 Haynes Street
- Recently renovated with updated paint, countertops, flooring, and fixtures
- Large fenced backyard for each unit
Financial Insights
Estimated NOI and Cap Rate
NOI / Yr
$21,346
Cap Rate
6.09%
Suggested Prices Based on Cap Rates
Cap Rate 5%
$426,920
$426.9K
Cap Rate 7%
$304,943
$304.9K
Cap Rate 9%
$237,178
$237.2K
Market Conditions
NOI Build-Up for 1,273 SF
Gross rent
$32.1K $25.20/SF
− Vacancy
−$1.6K −$1.24/SF
EGI
$30.5K $23.96/SF
− OpEx
−$9.1K −$7.19/SF
NOI
$21.3K $16.77/SF
Area
Hays County, TX
Vacancy
4.94%
Lease Rate
$25.20 /SF/Yr
Expense Ratio
30.00%
Simulate Cap Rate and NOI
Suggested Prices Based on Cap Rates
Cap Rate 5%
$426,920
Cap Rate 7%
$304,943
Cap Rate 9%
$237,178
Alternative Uses
Best Use
Multifamily LT 5
$304.9K
$266.8K – $355.8K
NOI $21,346 @ 7.0% cap · market cap 6.09%
Second Best
Apartment 5plus
$278.8K
$243.9K – $325.2K
NOI $19,514 @ 7.0% cap · market cap 5.57%
Theoretical Best
Office A
$532.1K
$465.6K – $620.8K
NOI $37,250 @ 7.0% cap · market cap 10.63%
Zoning and permitted uses should be independently verified with authorities.
How Realmo checks its estimates
Property Analytics
Unlock full access to Insights
Subscribe to Realmo Intelligence
Open Analytics
Current Use
Lease Details
2
Residential units
Location Intelligence
Trade Area within ½ mile
1,255
Businesses Nearby
Explore this area
Business Placement
Demographics for 78666, TX
86,584
Population
36,354
Households
2.4
Avg Household Size
27
Median Age
35%
College-Educated
89%
High-School Grad
192.4 sq mi
ZIP Area
450
Density / Sq Mi
$55,478
Median Household Income
$25,890
Median Earnings
$1,294
Median Rent
$271,900
Median Home Value
Check the figures for this property
Cap Rate, Value Estimation, Potential NOI and more
View Realmo Analytics
Market
Vacancy Rate% for Multifamily in South region





Frequently Asked Questions
What type of property is this?
Duplex - Updated two-unit property with fenced outdoor space, off-street parking, and proximity to the San Marcos River.
Where is this duplex located?
The property is located at 1005/1007 Haynes Street San Marcos, TX.
What is the asking price?
The asking price for this property is $350,280.
What are key features of this property?
This property features: 1,273‑square‑foot duplex at 1005/1007 Haynes Street; Recently renovated with updated paint, countertops, flooring, and fixtures; Large fenced backyard for each unit


