Single-Story Auto Shop with Car
For Sale
$349,000
1001 E 30th Street, Indianapolis, IN 46205
Commercial Sale, Indianapolis, IN
Property Size1,902 SF
Lot Size0.22 Acres
Price / SF$183.49
Days on Market117
Property Features for 1001 E 30th Street
General Information
Property type
Commercial Sale
Property subtype
Other
Zoning
C4
Fencing
Fenced
Elementary school district
Indianapolis Public Schools
Middle school district
Indianapolis Public Schools
High school district
Indianapolis Public Schools
Directions
GPS Friendly
Subdivision
4910 - Marion - Center
Standard status
Active
APN
490730109045000101
Lot size
0.22 Acres
Taxes and HOA fees
Tax Year
2024
Tax Description
Meadland Grandview Add L45
Tax Annual Amount
1714
Legal Description
Meadland Grandview Add L45
Building Details
Year built
1971
Floors in Building
1
Roof type
Asphalt
Listing Agency:
Keller Williams Indpls Metro N · Keller Williams Realty
(317) 846-6300
Listed By:
Cameron Mason · License #RB19000178
(317) 430-6749
Added: Jun 19
Changed: Sep 9
Last Checked: Oct 13 at 5:06AM
MLS# 22109156
Copyright © 2026 Broker Listing Cooperative®. All rights reserved. All information provided by the listing agent/broker is deemed reliable but is not guaranteed and should be independently verified.
Investment Insights
Based on property information with market context.
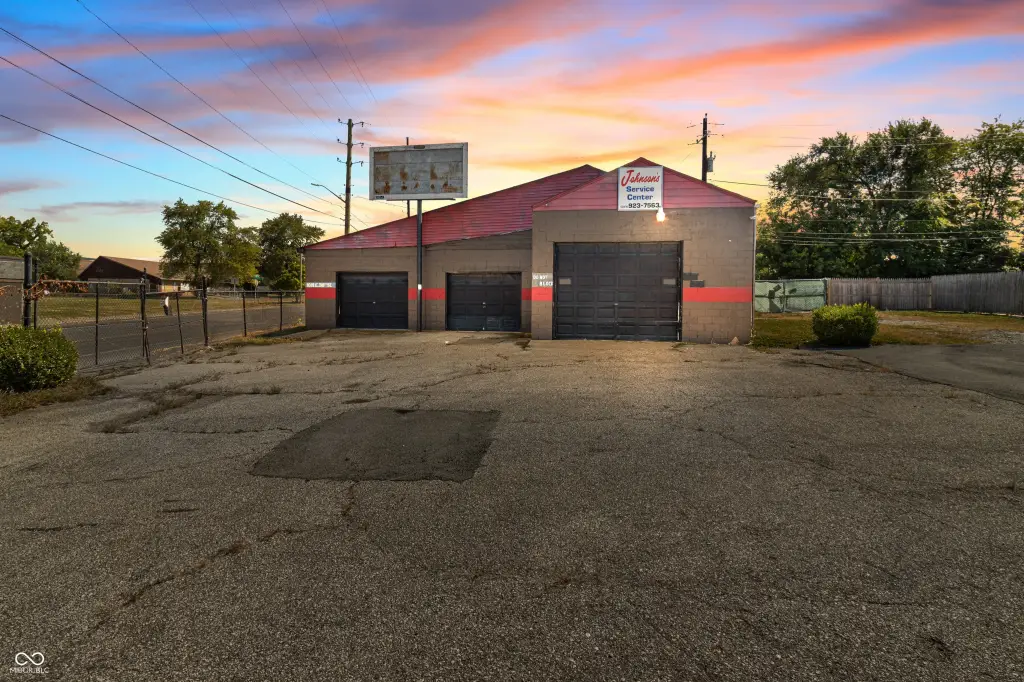
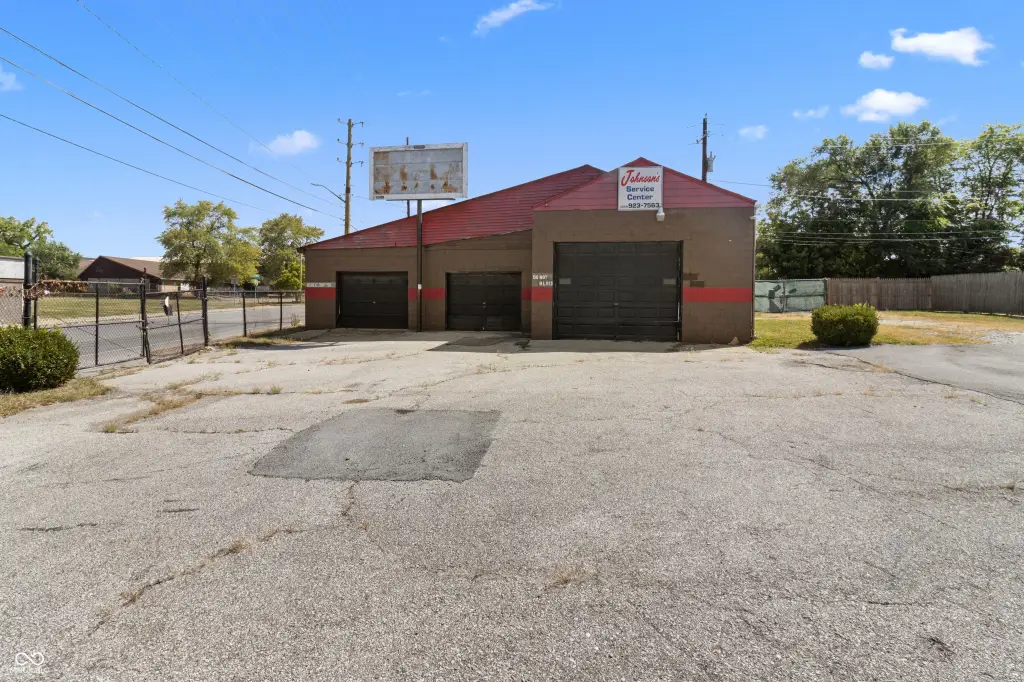
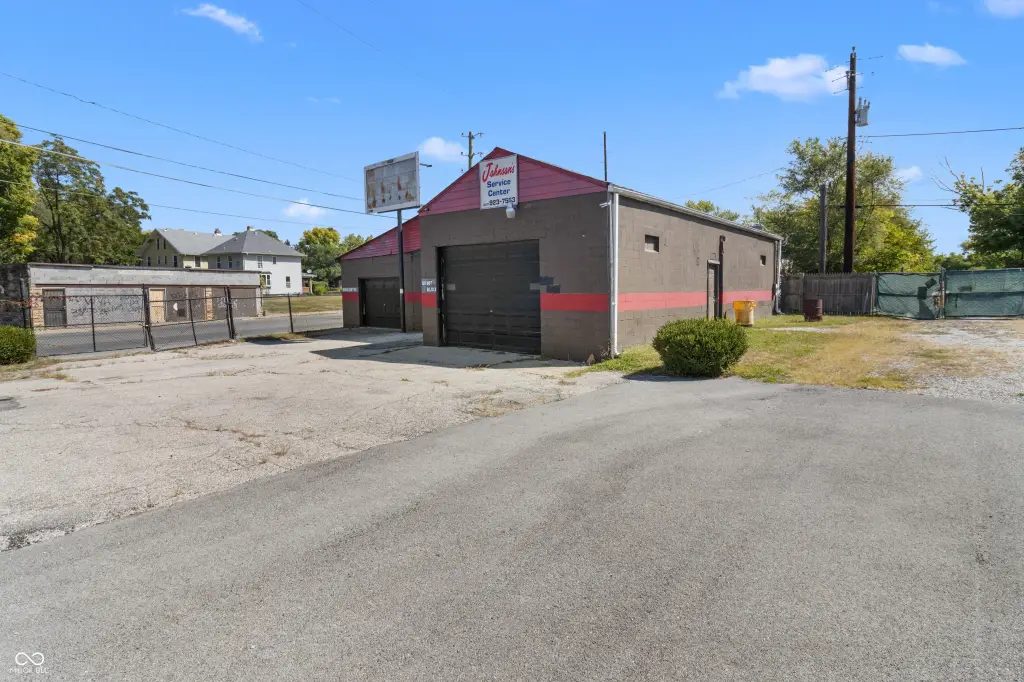
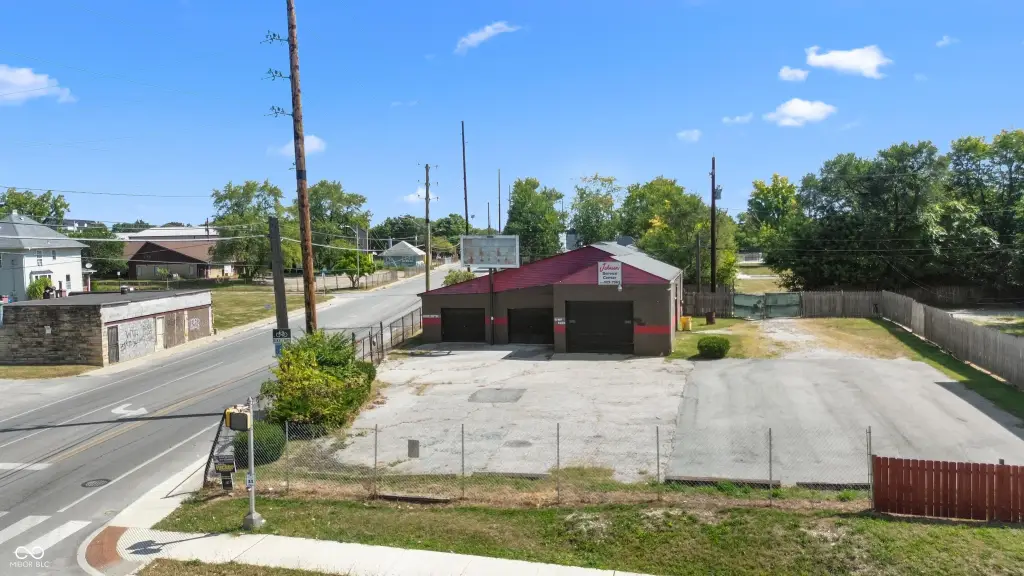
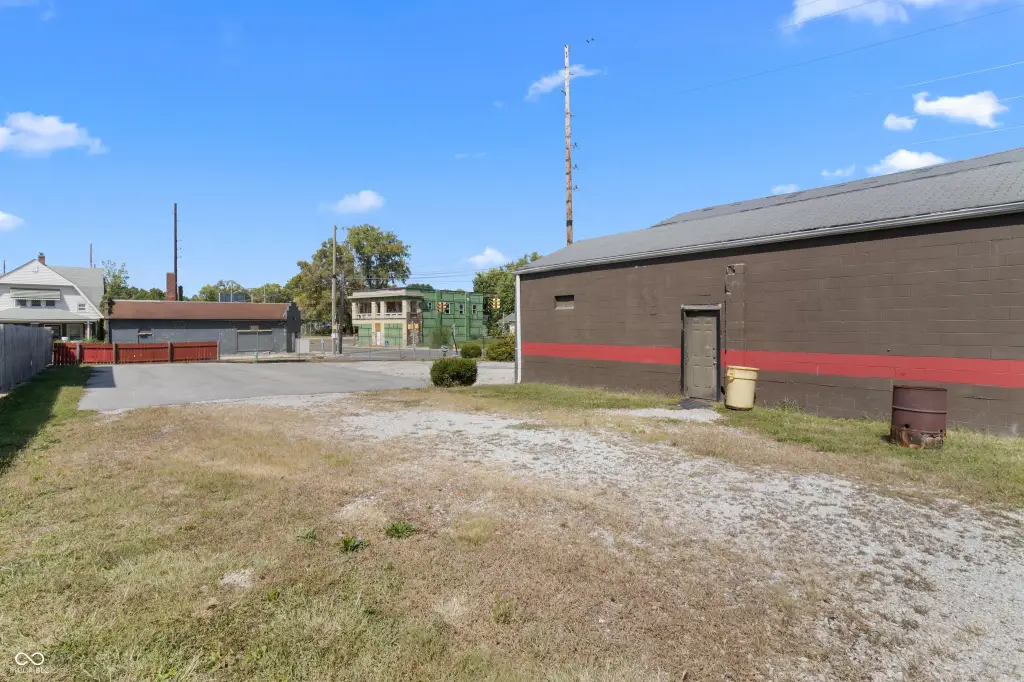
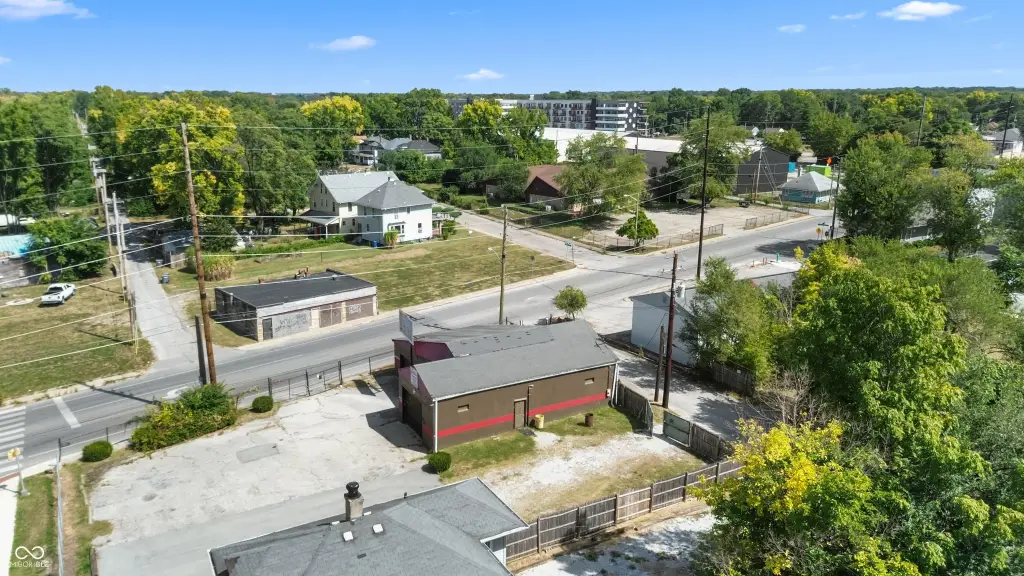
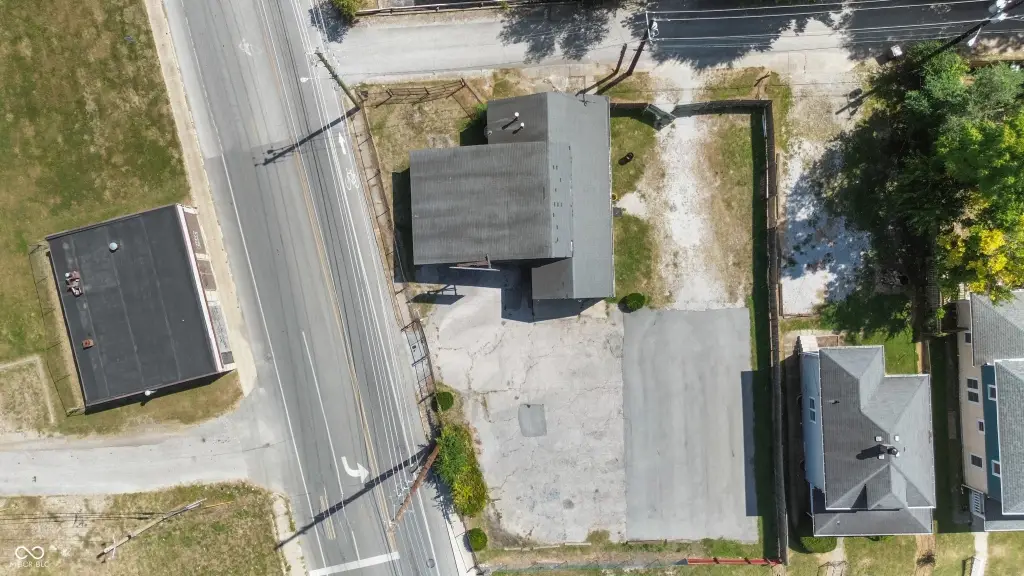
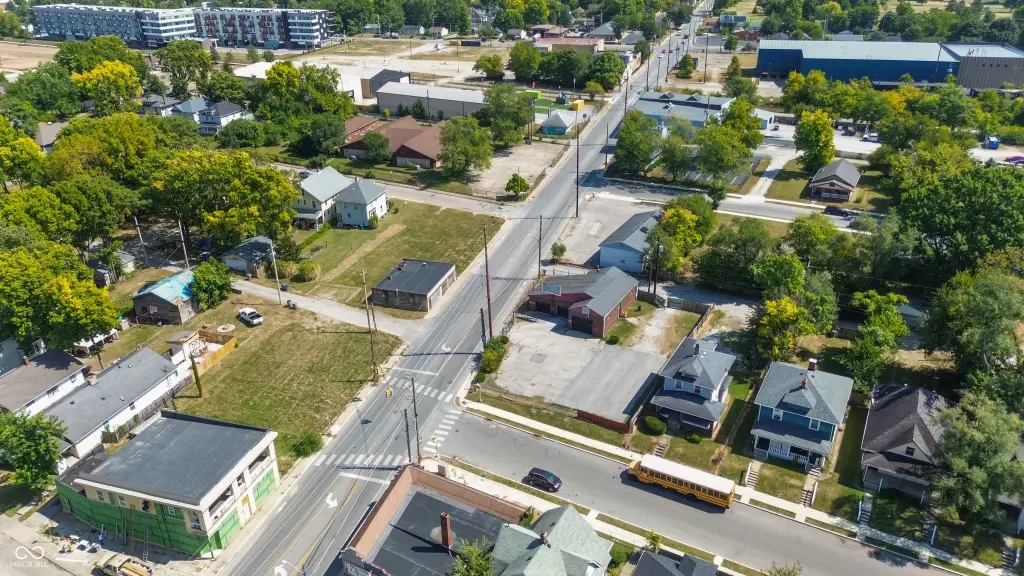
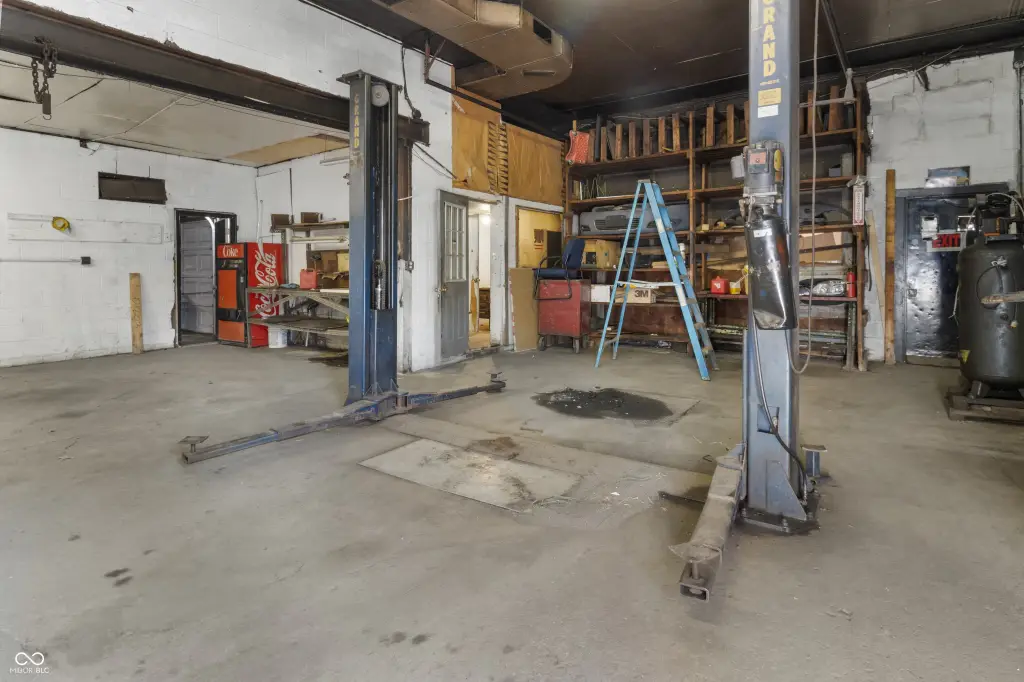
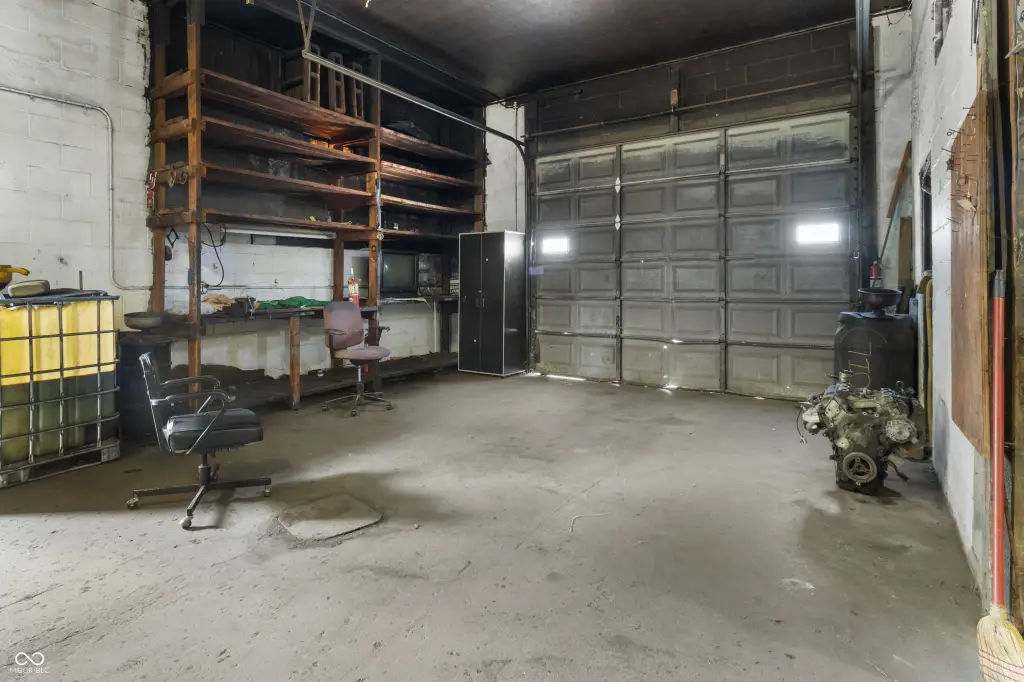
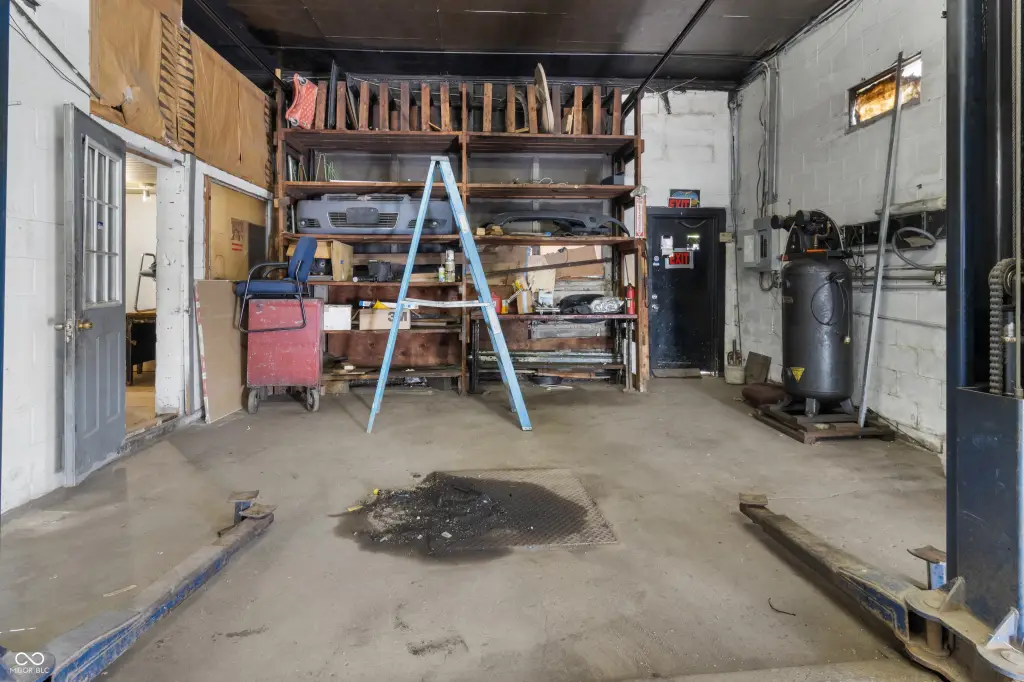
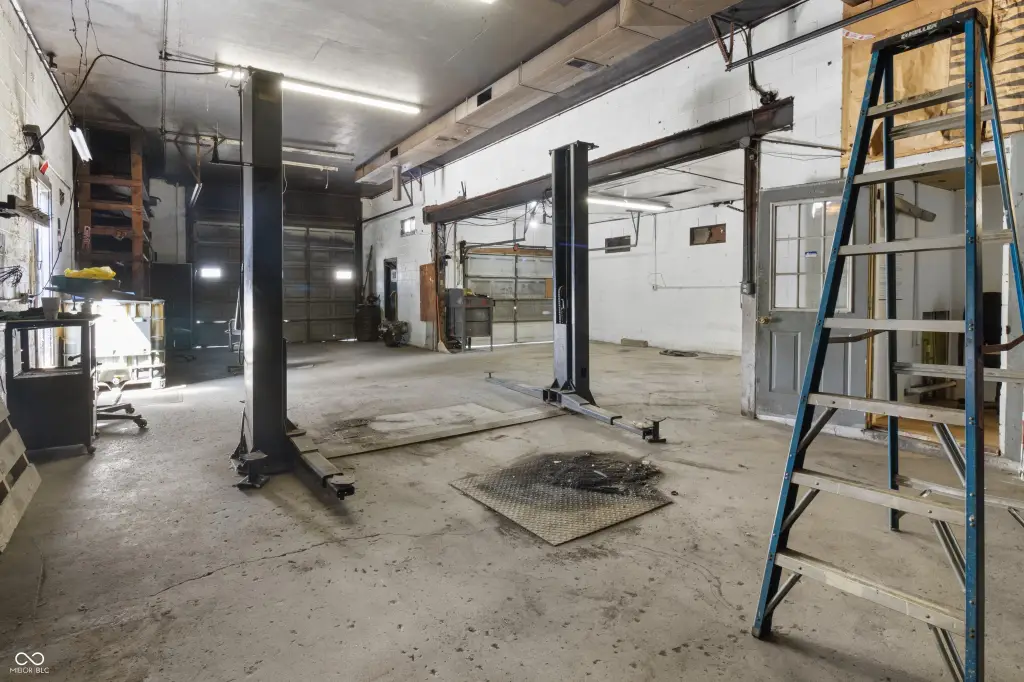
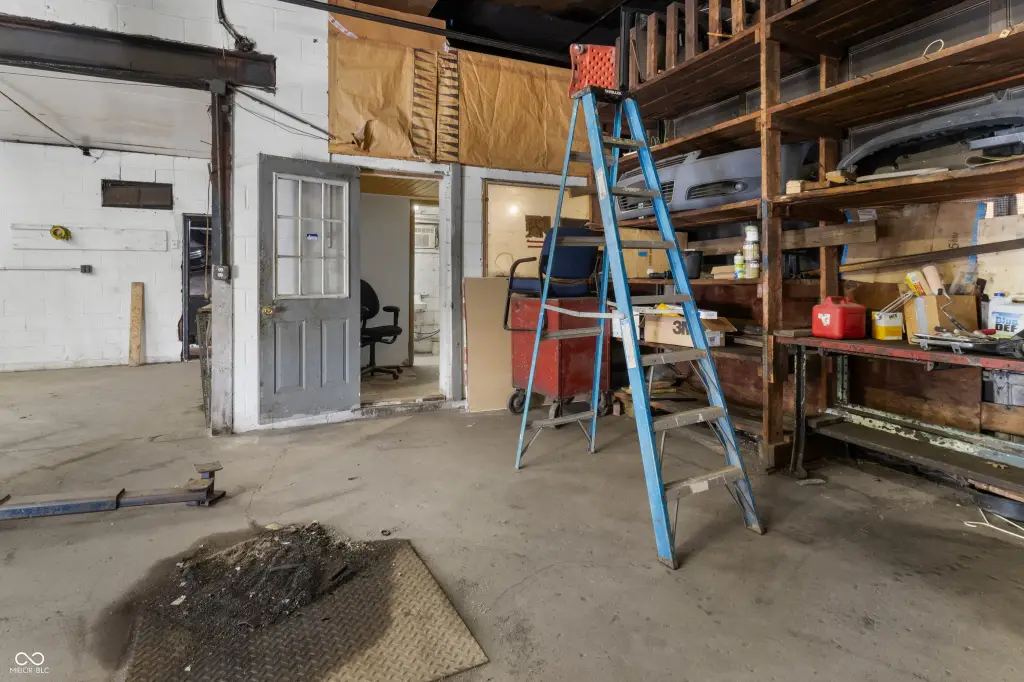
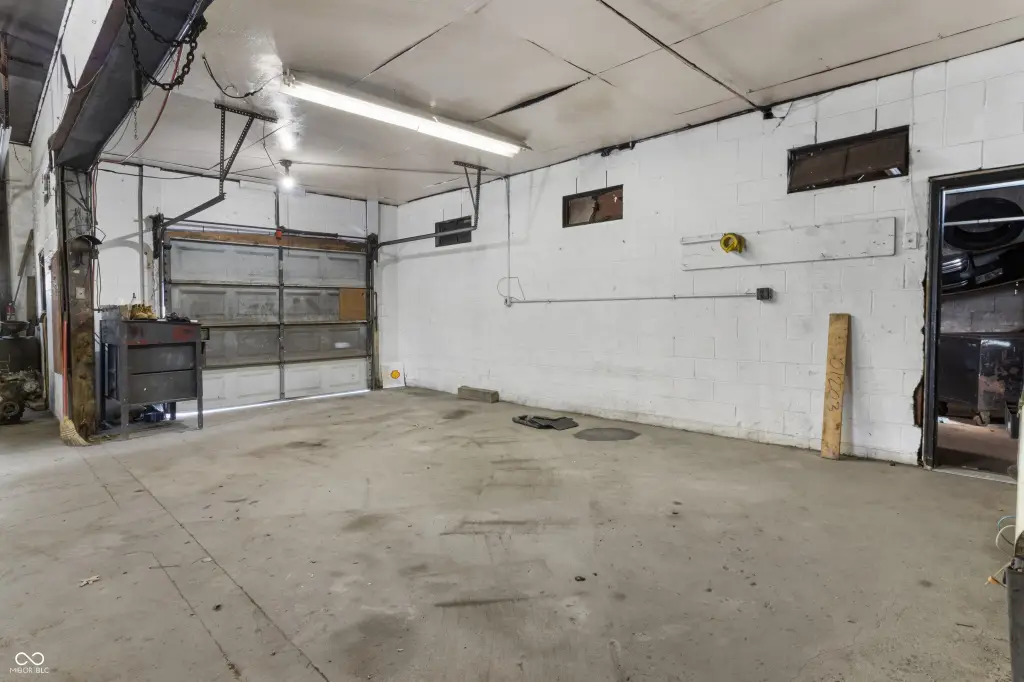
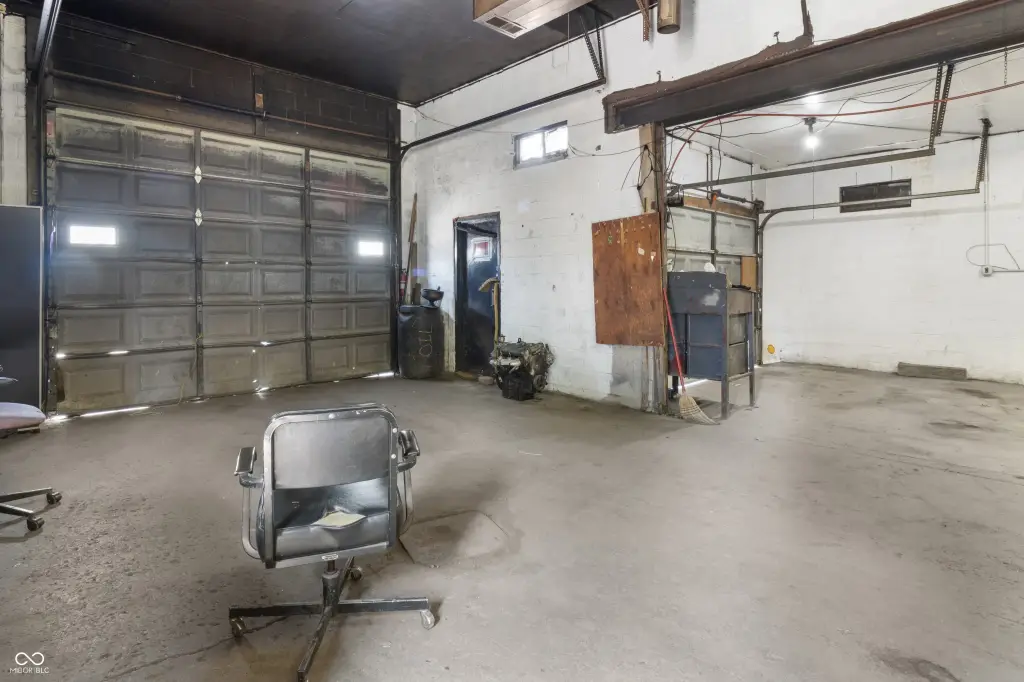
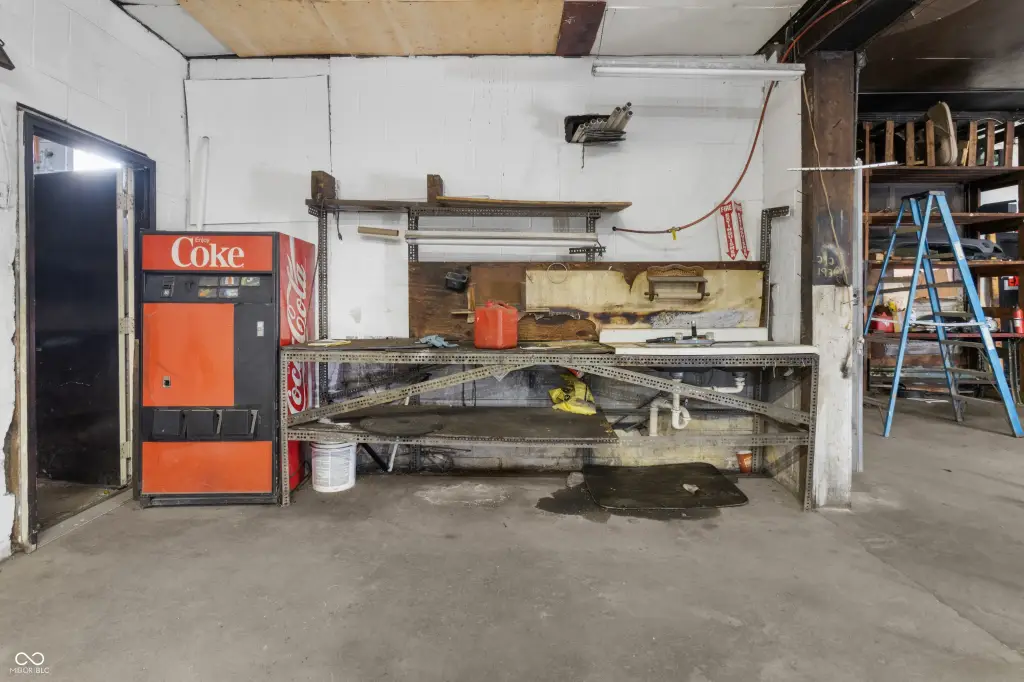
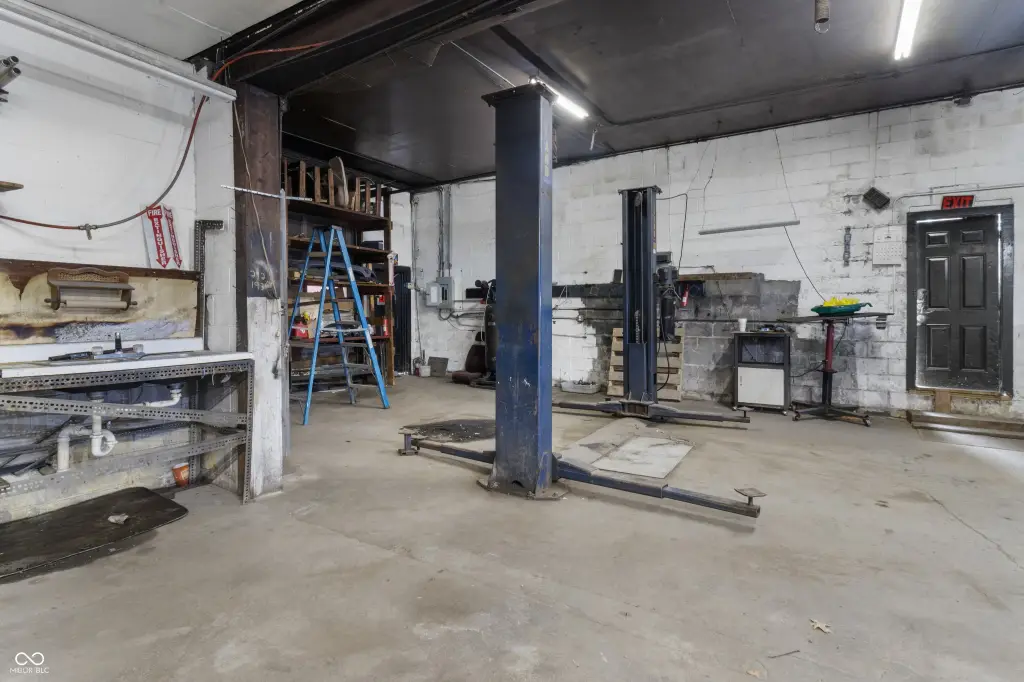
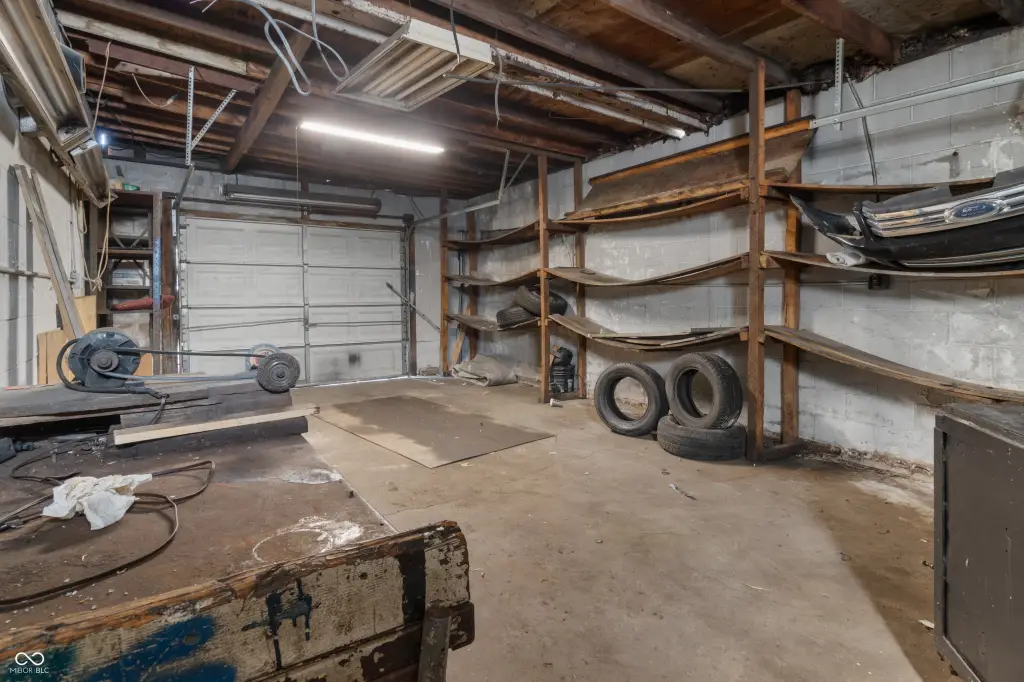
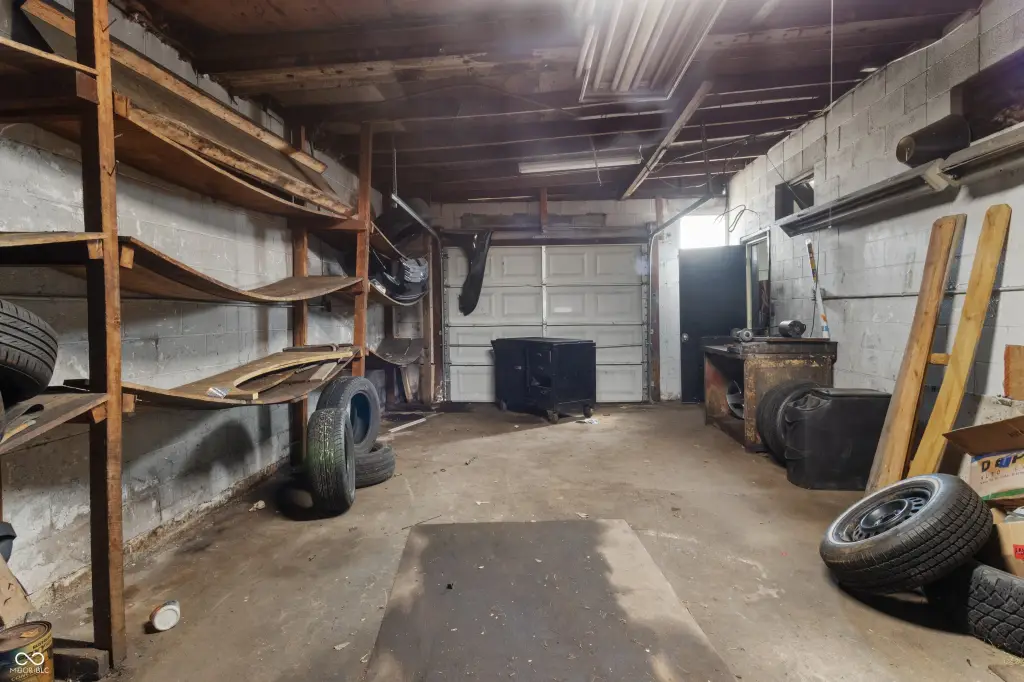
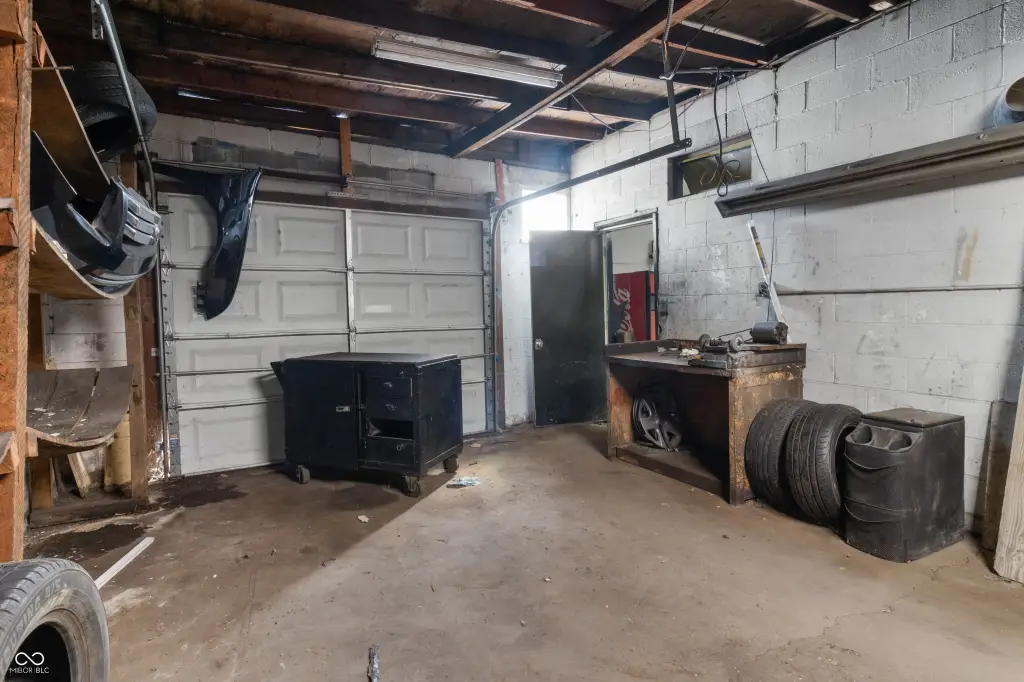
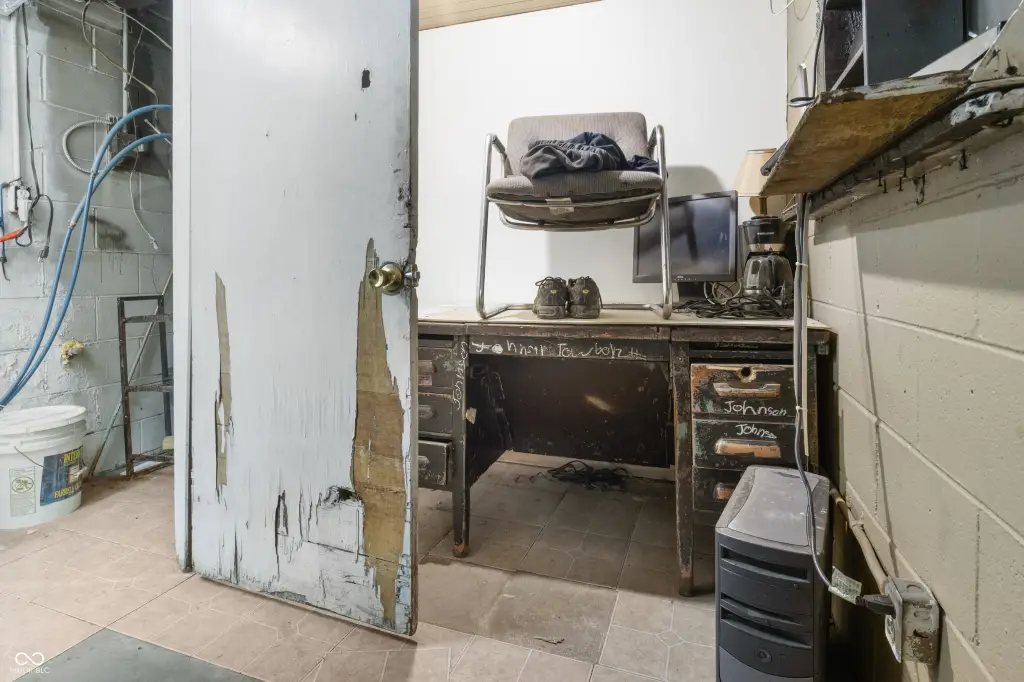
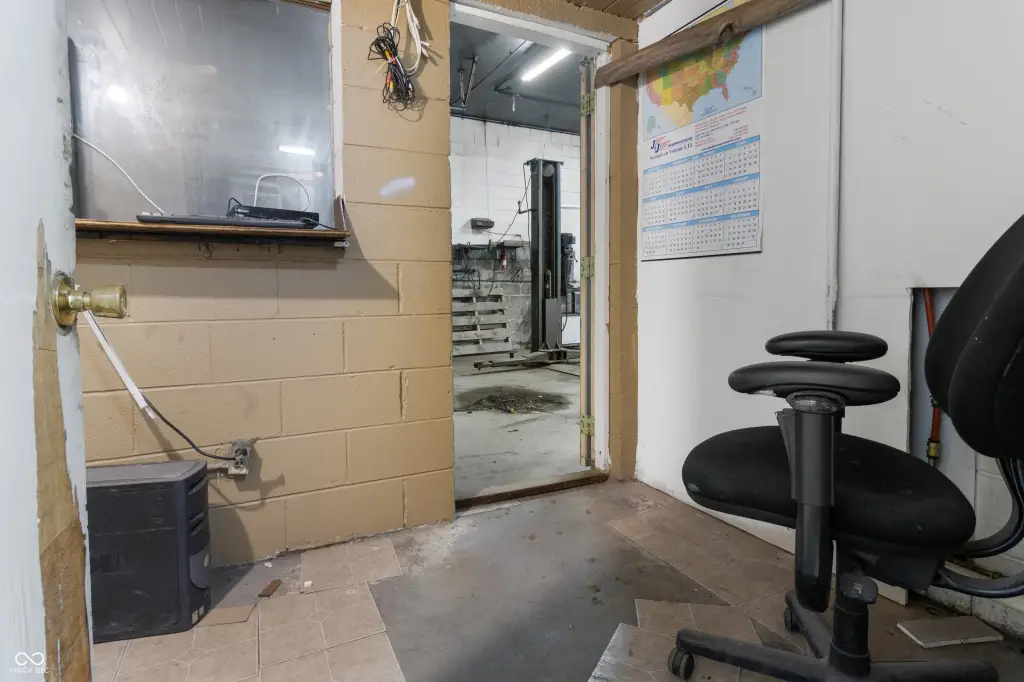
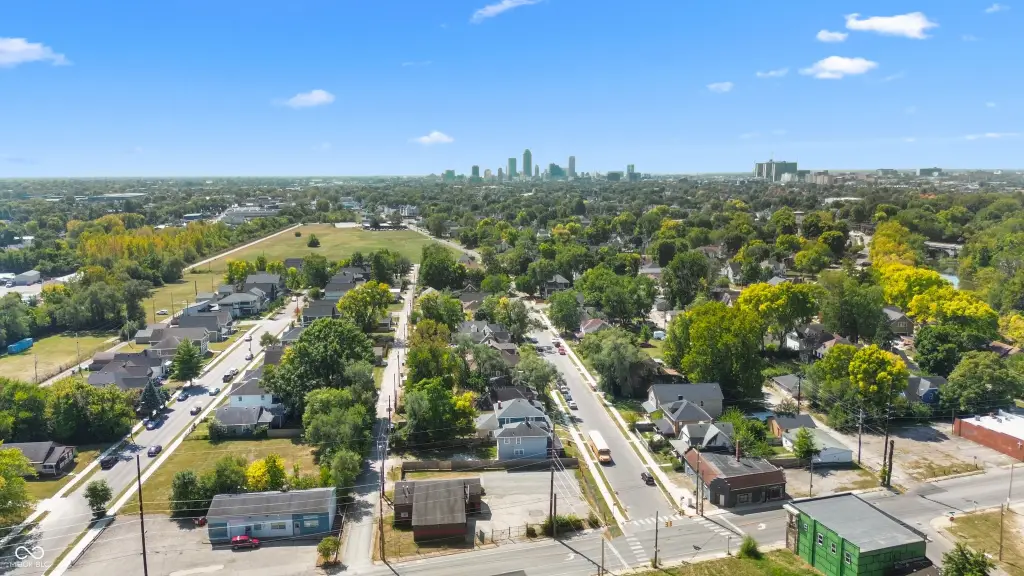
This single-story auto shop includes 1,902 square feet of building area, three car bays, and a car lift. The gated property spans two parcels totaling 0.22 acres, with fencing and built-in parking. Constructed in 1971, the building most recently operated as a towing and auto service center.
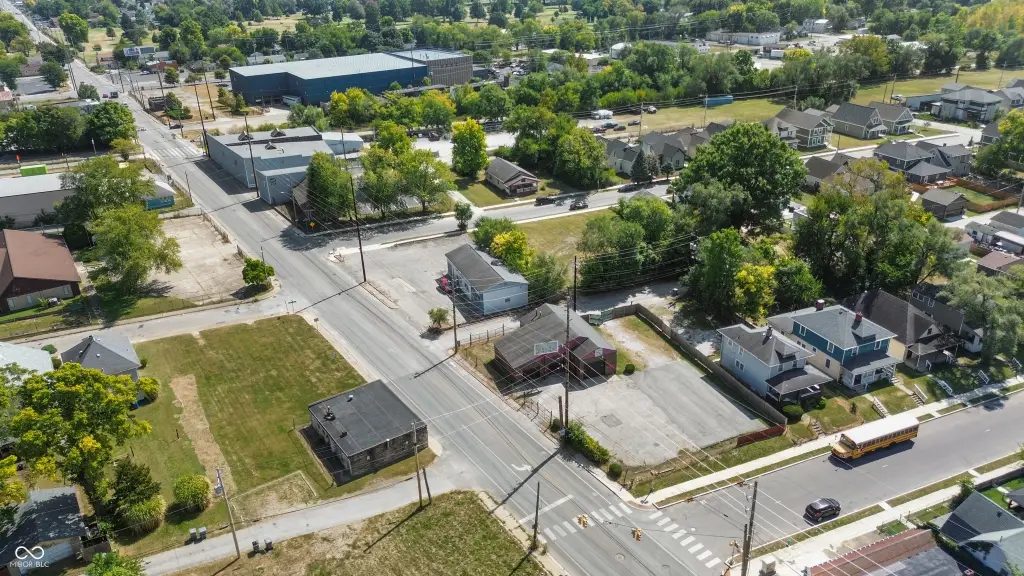
The property is located at 1001 E 30th Street in Indianapolis and sits adjacent to the Monon and Fall Creek Trails. C4 zoning supports the property’s existing automotive orientation, while the secured lot and bay layout provide a practical setup for continued garage use.
The property is located at 1001 E 30th Street in Indianapolis and sits adjacent to the Monon and Fall Creek Trails. C4 zoning supports the property’s existing automotive orientation, while the secured lot and bay layout provide a practical setup for continued garage use.
Key Highlights
- 1,902‑square‑foot single‑story building with 3 car bays
- C4 zoning for an automotive property
- Gated 9,531‑square‑foot (0.22‑acre) lot across two parcels
Financial Insights
Estimated NOI and Cap Rate
NOI / Yr
$20,466
Cap Rate
5.86%
Suggested Prices Based on Cap Rates
Cap Rate 5%
$409,320
$409.3K
Cap Rate 7%
$292,371
$292.4K
Cap Rate 9%
$227,400
$227.4K
Market Conditions
NOI Build-Up for 1,902 SF
Gross rent
$32.0K $16.80/SF
− Vacancy
−$2.7K −$1.43/SF
EGI
$29.2K $15.37/SF
− OpEx
−$8.8K −$4.61/SF
NOI
$20.5K $10.76/SF
Area
Indianapolis, IN
Vacancy
8.50%
Lease Rate
$16.80 /SF/Yr
Expense Ratio
30.00%
Simulate Cap Rate and NOI
Suggested Prices Based on Cap Rates
Cap Rate 5%
$409,320
Cap Rate 7%
$292,371
Cap Rate 9%
$227,400
Alternative Uses
Best Use
Retail
$292.4K
$255.8K – $341.1K
NOI $20,466 @ 7.0% cap · market cap 5.86%
Second Best
Industrial
$135.4K
$118.5K – $158.0K
NOI $9,481 @ 7.0% cap · market cap 2.72%
Theoretical Best
Office A
$473.4K
$414.3K – $552.3K
NOI $33,140 @ 7.0% cap · market cap 9.50%
Zoning and permitted uses should be independently verified with authorities.
How Realmo checks its estimates
Property Analytics
Unlock full access to Insights
Subscribe to Realmo Intelligence
Open Analytics
Current Use
Lease Details
3
Service bays
Yes
Fenced yard
Location Intelligence
Trade Area within ½ mile
345
Businesses Nearby
Well-served
Demand for This Use
Explore this area
Business Placement
Demographics for 46205, IN
27,531
Population
14,756
Households
1.9
Avg Household Size
34
Median Age
51%
College-Educated
93%
High-School Grad
6.2 sq mi
ZIP Area
4,440
Density / Sq Mi
$65,756
Median Household Income
$48,138
Median Earnings
$1,087
Median Rent
$278,000
Median Home Value
Check the figures for this property
Cap Rate, Value Estimation, Potential NOI and more
View Realmo Analytics
Market
Vacancy Rate% for Retail in Indianapolis, IN

Questions? Ask Rey
Realmo’s AI knows this listing — price, zoning, demand, history. Ask anything.


Similar Off Market Nearby
- Stage 1 Tuning — 2455 central ave, indianapolis, in 46205
- In Traffic Towing And Roadside Assistances LLC & We Buy Junk Cars — 30 Winthrop Ave, Indianapolis, IN 46205
- Rod's Customs LLC — 1360 E 30th St, Indianapolis, IN 46205
- E&t repair LLC — 2201 E 30th St #46218, Indianapolis, IN 46218
- E&t repair — 2201 e 30th st #46218, indianapolis, in 46218
Frequently Asked Questions
What type of property is this?
Auto shop - C4-zoned automotive property with a gated site, built-in parking, and a three-bay configuration.
Where is this auto shop located?
The property is located at 1001 E 30th Street Indianapolis, IN.
What is the asking price?
The asking price for this property is $349,000.
What are key features of this property?
This property features: 1,902‑square‑foot single‑story building with 3 car bays; C4 zoning for an automotive property; Gated 9,531‑square‑foot (0.22‑acre) lot across two parcels


