Restaurant Property with
For Sale
$995,000
Pending
10 Shore Road, York, ME 03909
York, ME
Property Size3,275 SF
Days on Market183
Property Features for 10 Shore Road
General Information
Property type
Commercial Sale
Property subtype
Retail
Standard status
Pending
Size
3,275 SF
Building Details
Year built
1953
Listing Agency:
Wells, Maine · Better Homes and Gardens Real Estate
(207) 646-5131
Listed By:
Gene Corey
(207) 363-6687
Added: Apr 12
Changed: Aug 24
Last Checked: Oct 11 at 3:06AM
MLS# 1657521
Copyright © 2026 Better Homes and Gardens-The Masiello Group. All rights reserved. All information provided by the listing agent/broker is deemed reliable but is not guaranteed and should be independently verified.
Investment Insights
Based on property information with market context.
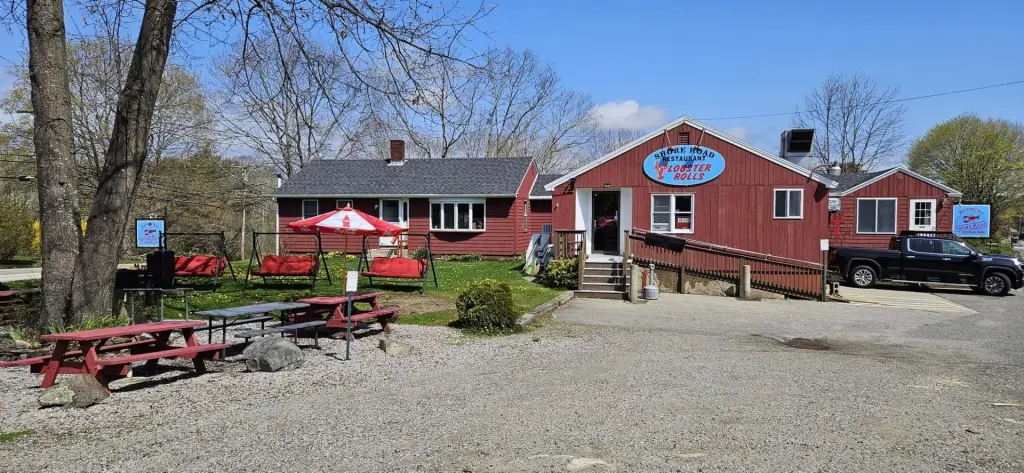
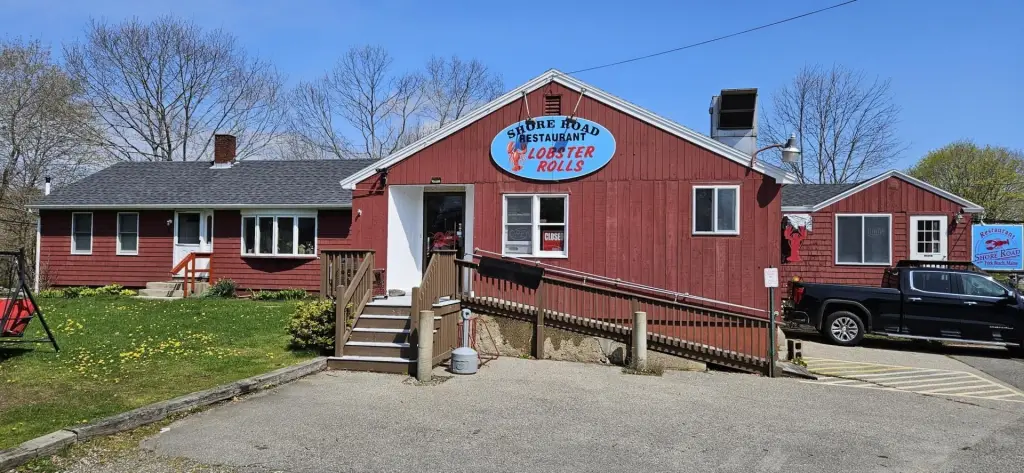
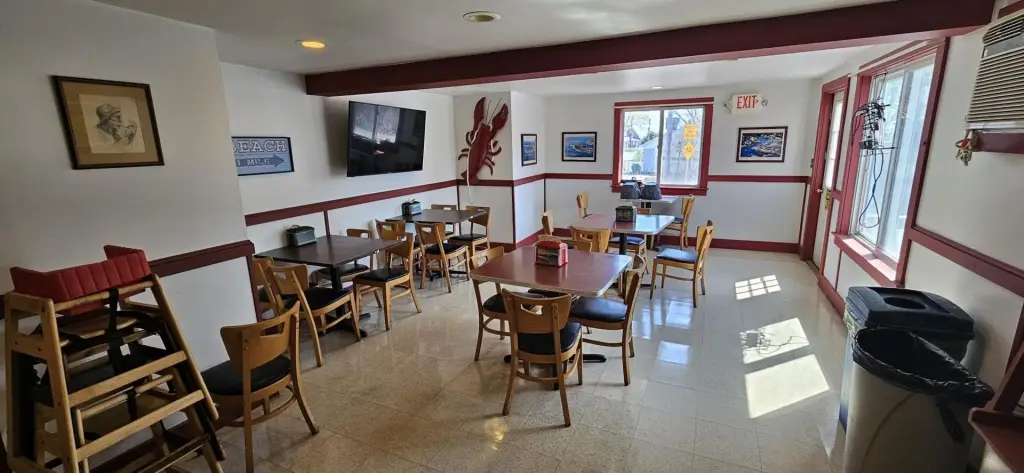
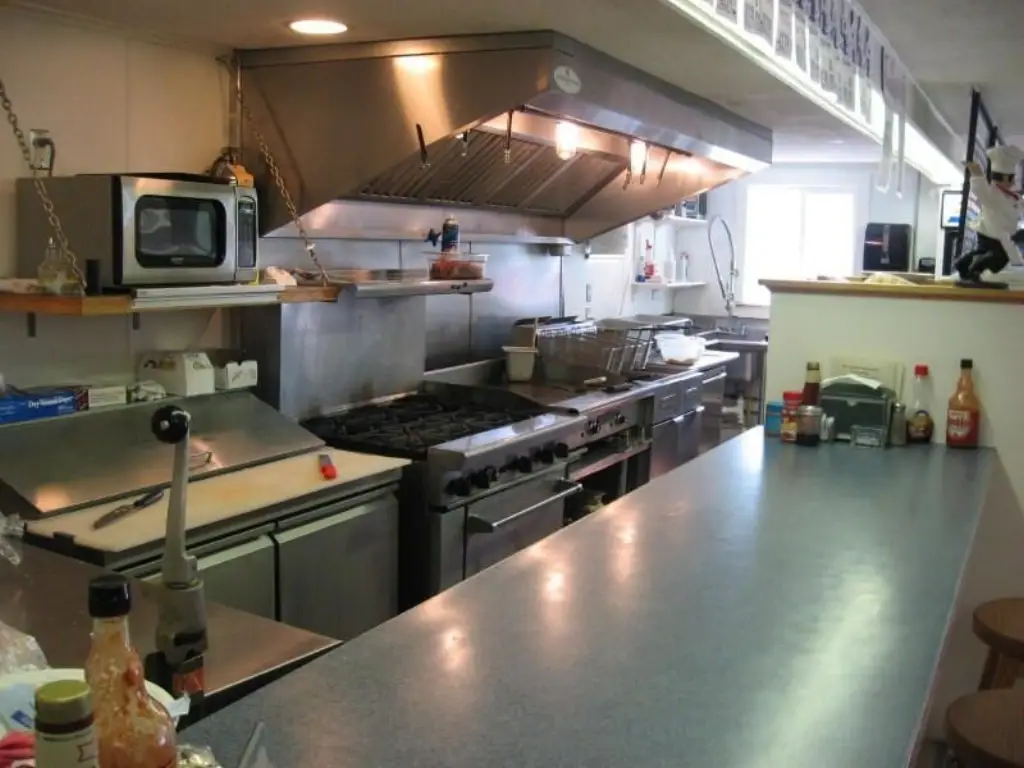
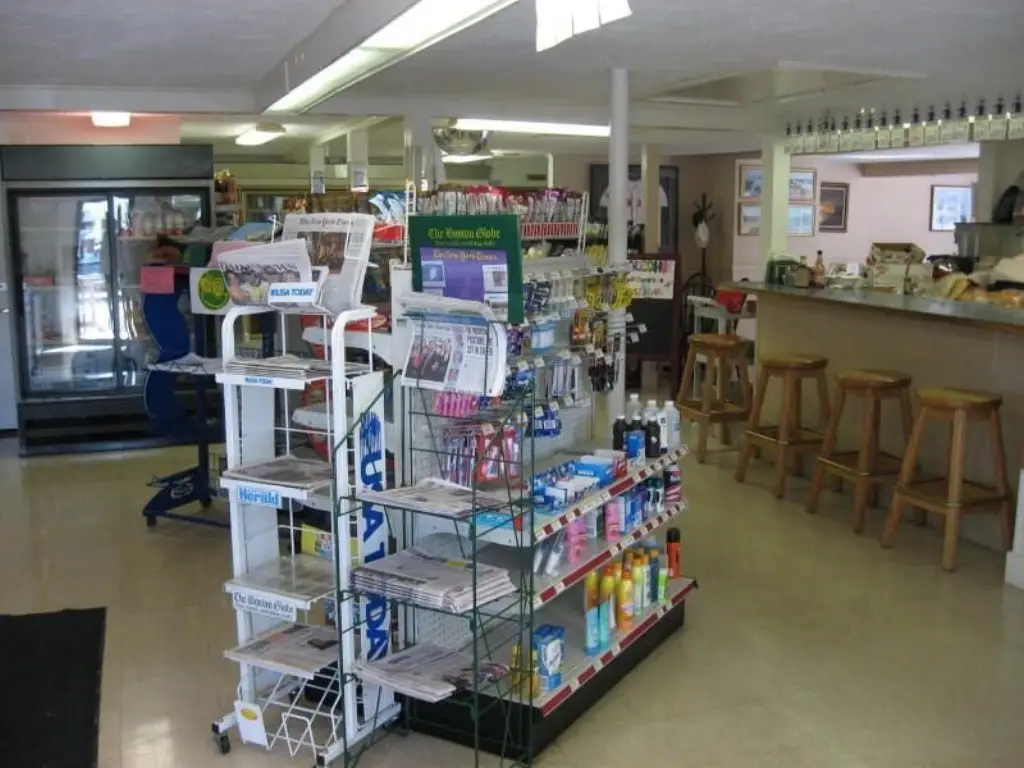
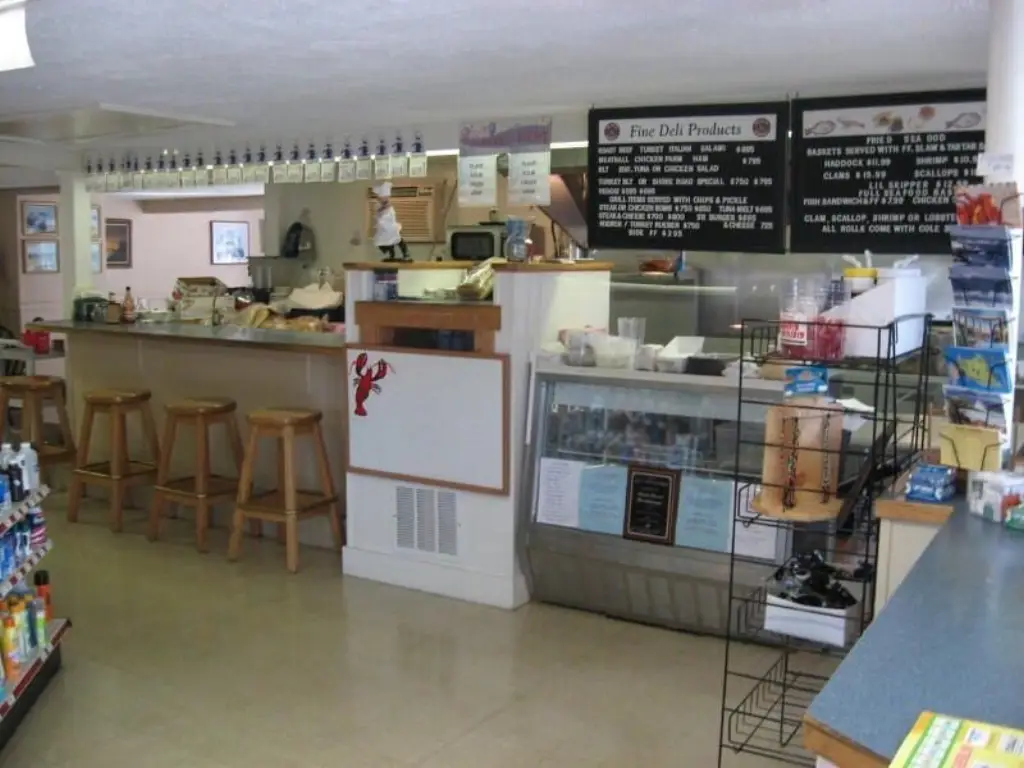
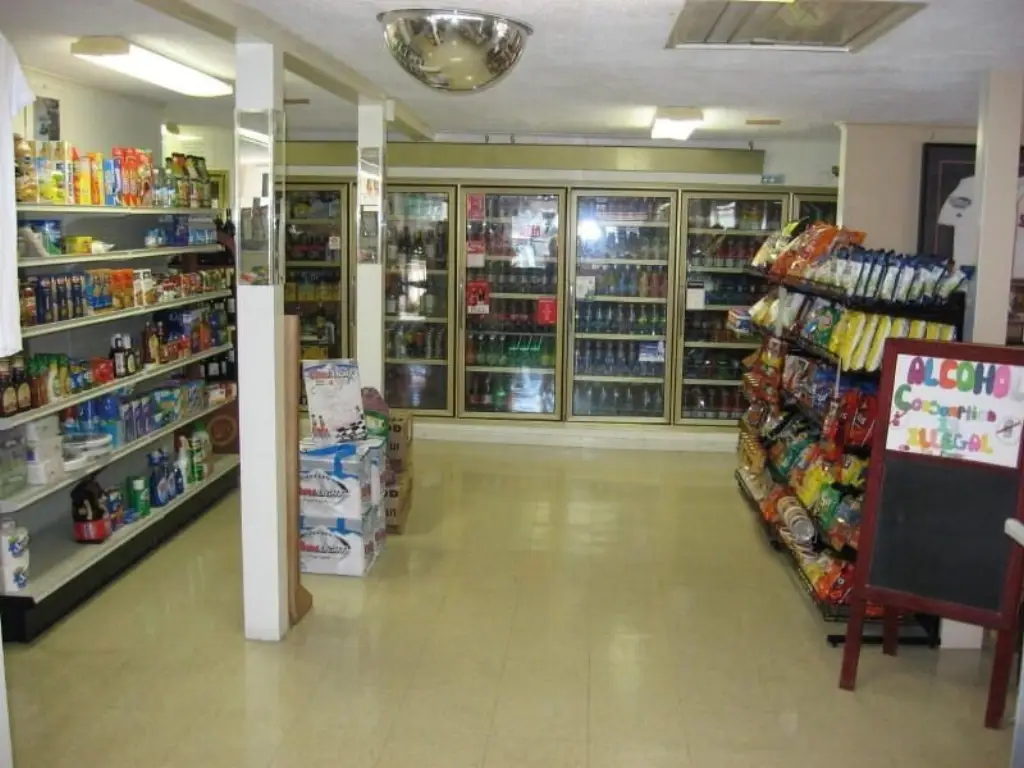
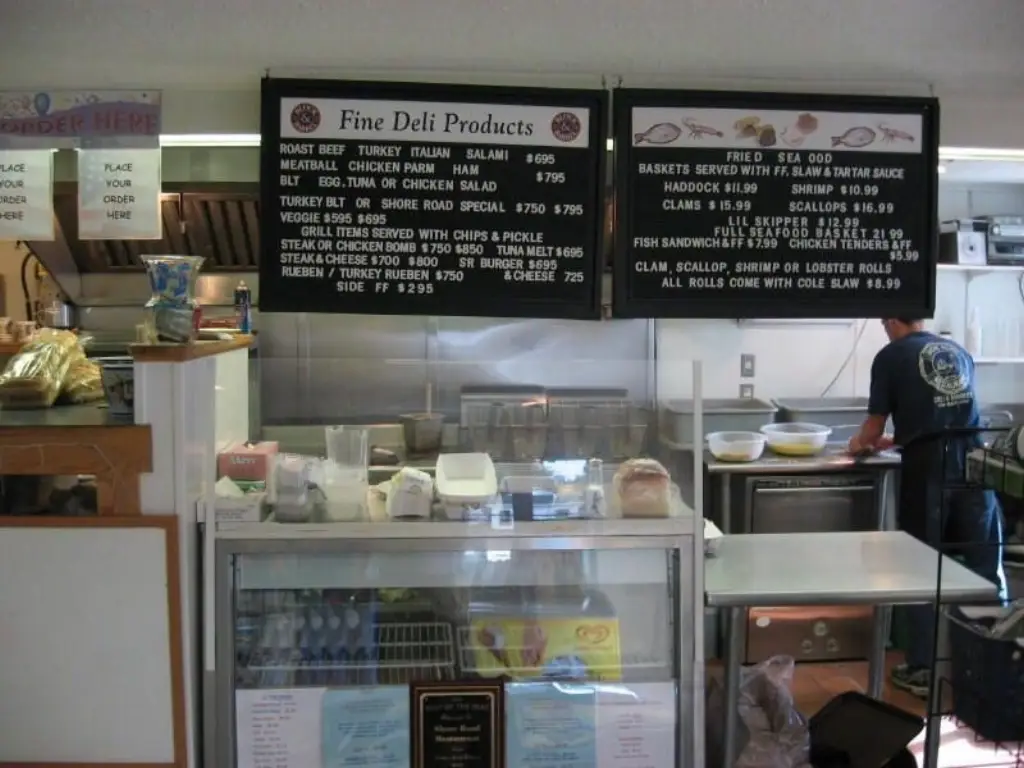
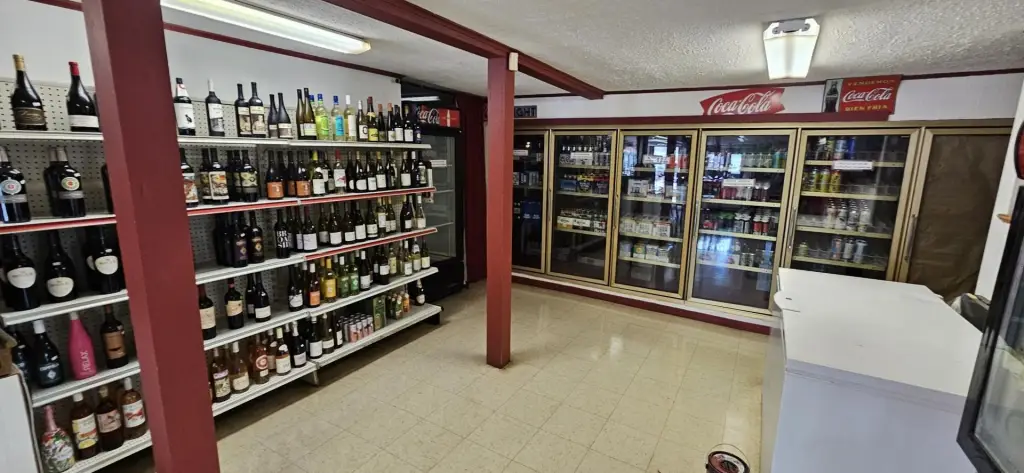
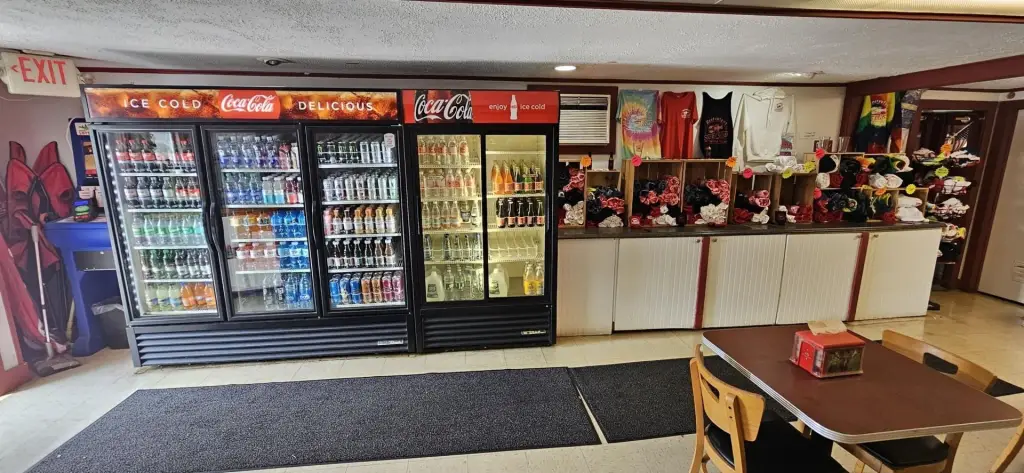
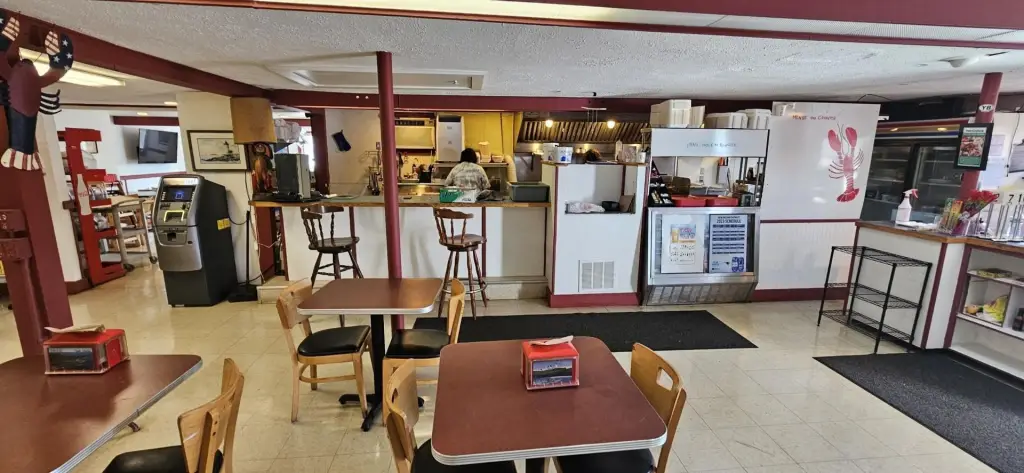
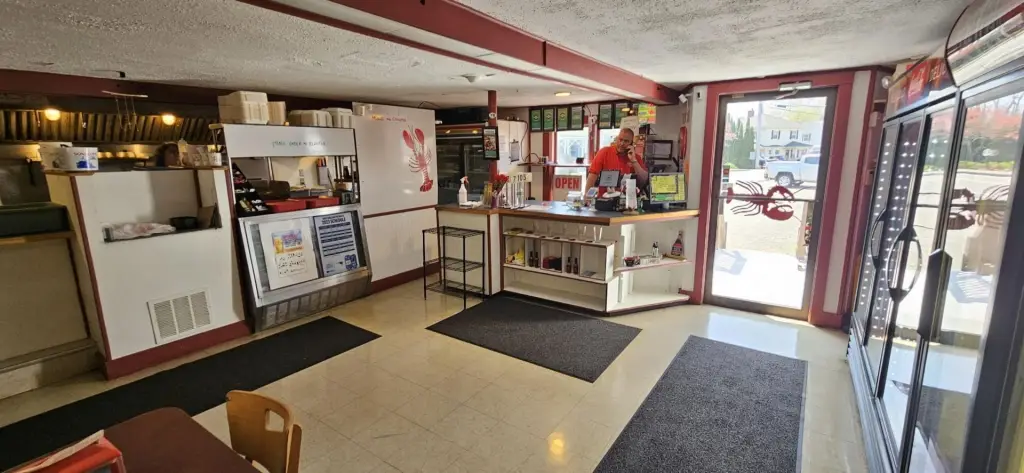
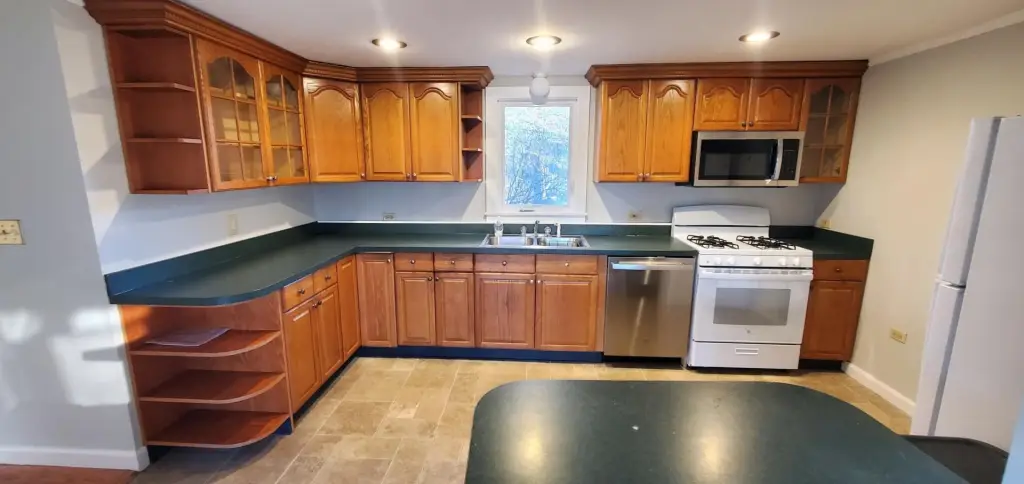
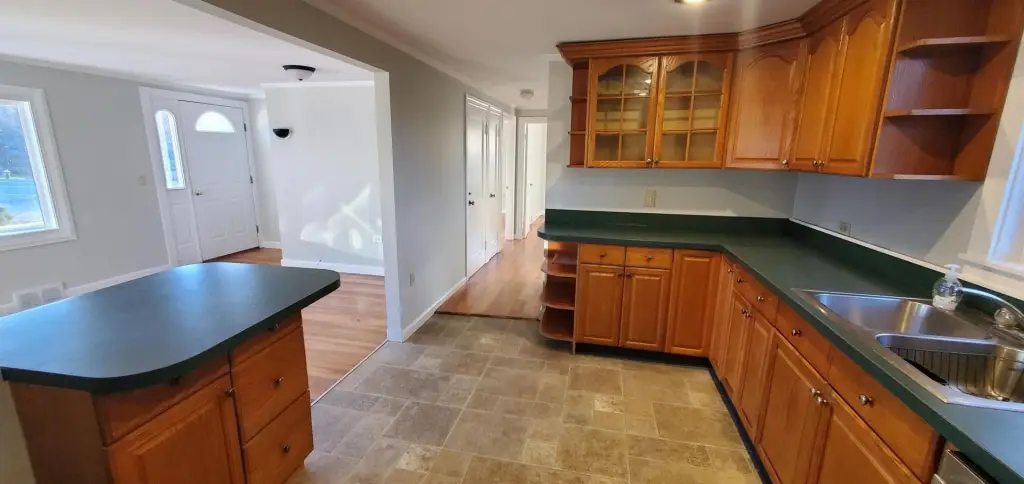
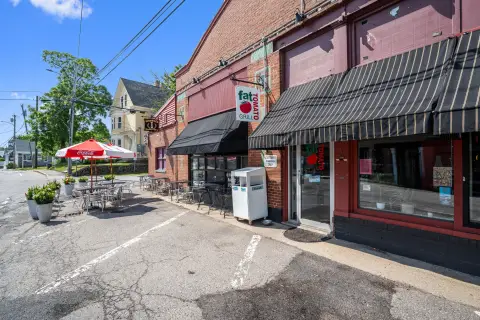
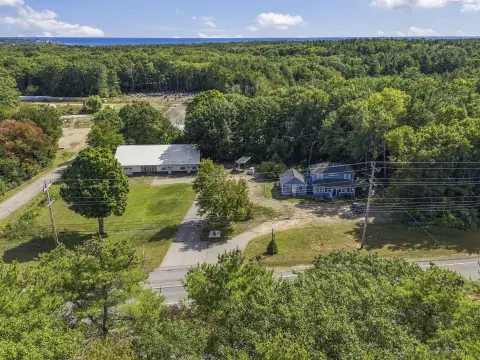
This 3,275-square-foot commercial property, built in 1953, combines a restaurant, take-out operation, and convenience store with an attached residence. The existing configuration supports multiple established uses within one property and includes access to town water and town sewer.
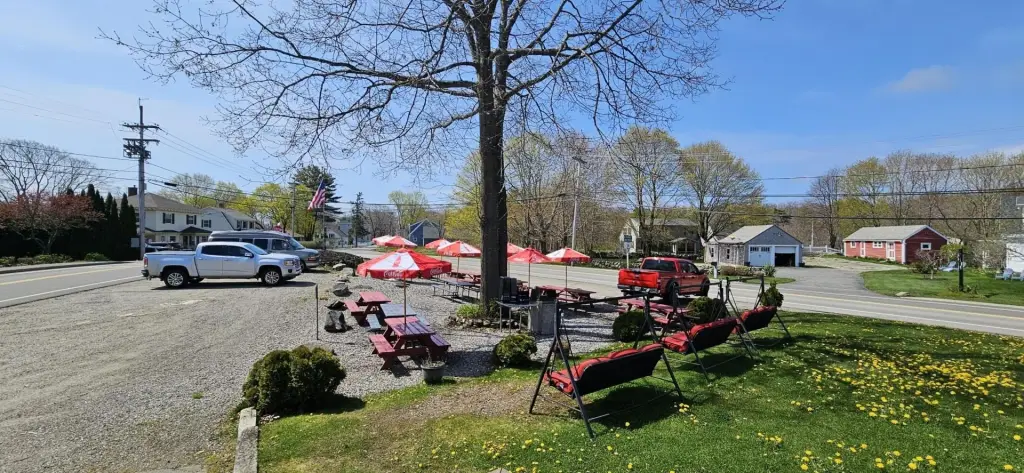
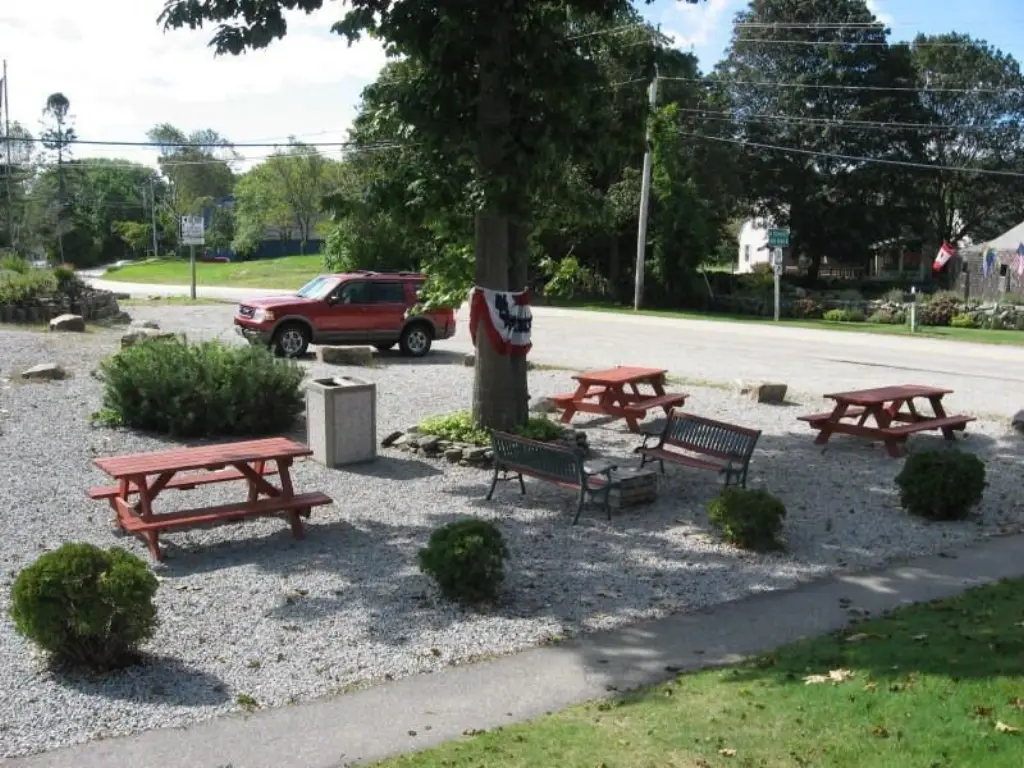
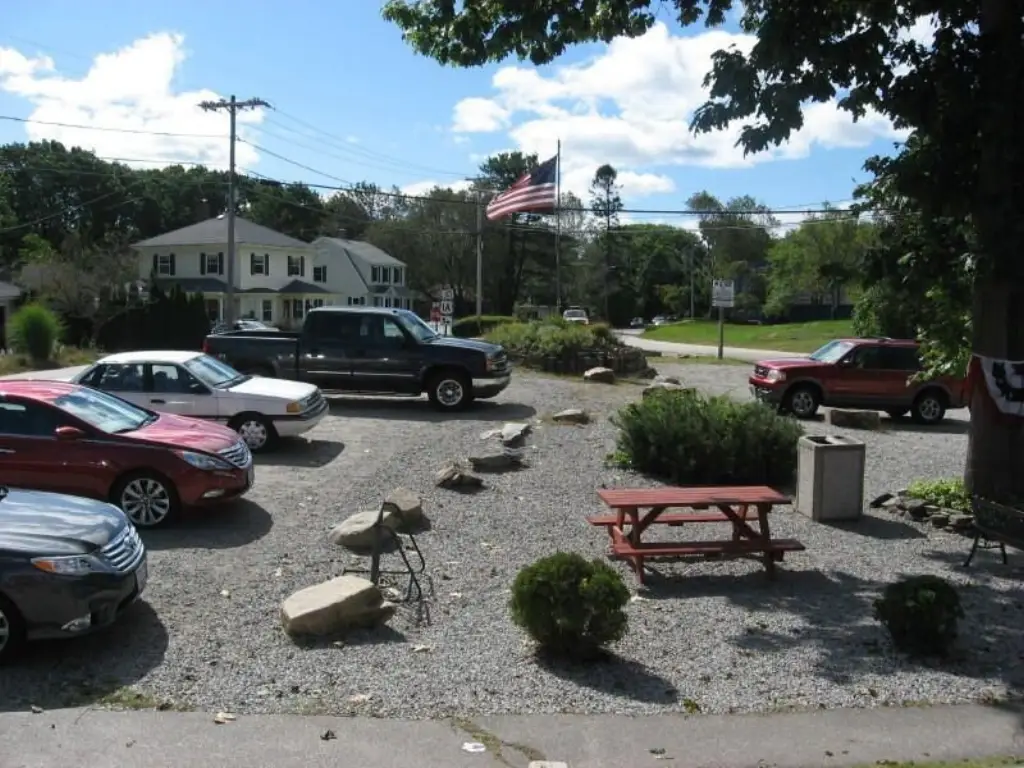
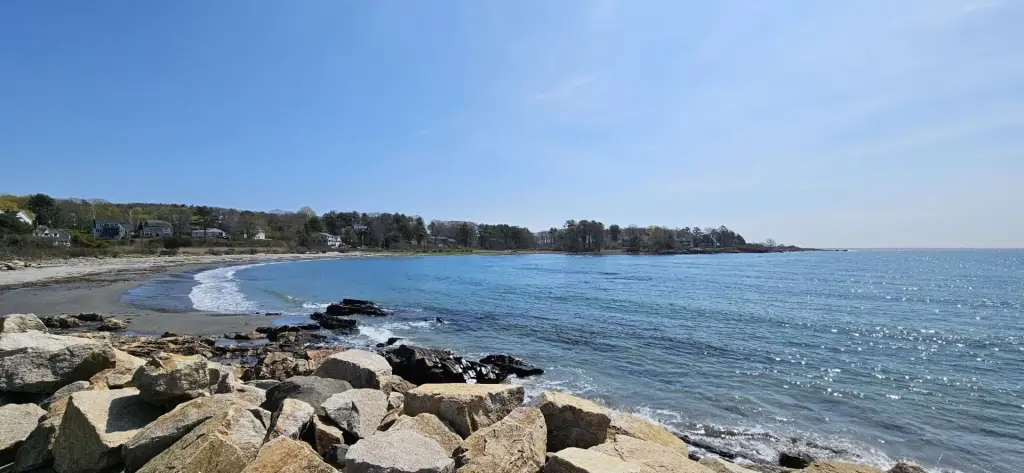
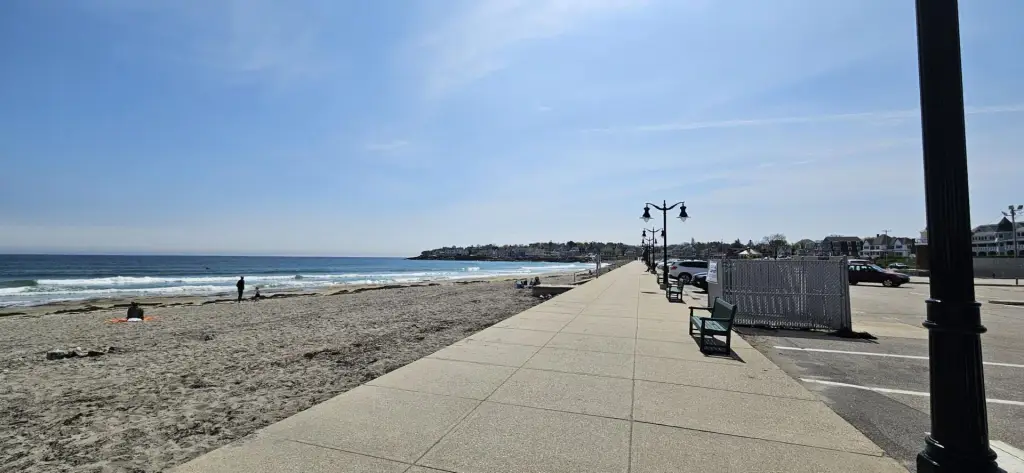
The property is located in York Beach, within walking distance of Cape Neddick Beach and Short Sands Beach. CD4 zoning provides a redevelopment path for five new residential homes without planning board approval, subject to the stated interpretation from York Code Enforcement.
The property is located in York Beach, within walking distance of Cape Neddick Beach and Short Sands Beach. CD4 zoning provides a redevelopment path for five new residential homes without planning board approval, subject to the stated interpretation from York Code Enforcement.
Key Highlights
- 3,275 SF property with restaurant, take‑out, convenience store, and attached residence
- Built in 1953
- CD4 zoning supports redevelopment for 5 new residential homes
Financial Insights
Estimated NOI and Cap Rate
NOI / Yr
$39,771
Cap Rate
4.00%
Suggested Prices Based on Cap Rates
Cap Rate 5%
$795,420
$795.4K
Cap Rate 7%
$568,157
$568.2K
Cap Rate 9%
$441,900
$441.9K
Market Conditions
NOI Build-Up for 3,275 SF
Gross rent
$62.1K $18.96/SF
− Vacancy
−$5.3K −$1.61/SF
EGI
$56.8K $17.35/SF
− OpEx
−$17.0K −$5.20/SF
NOI
$39.8K $12.14/SF
Area
York County, ME
Vacancy
8.50%
Lease Rate
$18.96 /SF/Yr
Expense Ratio
30.00%
Simulate Cap Rate and NOI
Suggested Prices Based on Cap Rates
Cap Rate 5%
$795,420
Cap Rate 7%
$568,157
Cap Rate 9%
$441,900
Alternative Uses
Best Use
Retail
$568.2K
$497.1K – $662.9K
NOI $39,771 @ 7.0% cap · market cap 4.00%
Second Best
Specialty Retail
$565.9K
$495.1K – $660.2K
NOI $39,610 @ 7.0% cap · market cap 3.98%
Theoretical Best
Office A
$1.04M
$908.4K – $1.21M
NOI $72,671 @ 7.0% cap · market cap 7.30%
Zoning and permitted uses should be independently verified with authorities.
Property Analytics
Unlock full access to Insights
Subscribe to Realmo Intelligence
Open Analytics
Current Use
Lease Details
Yes
Utilities to site
Location Intelligence
Trade Area within ½ mile
48
Businesses Nearby
Well-served
Demand for This Use
Explore this area
Business Placement
Demographics for 03909, ME
10,938
Population
7,101
Households
1.5
Avg Household Size
53
Median Age
50%
College-Educated
98%
High-School Grad
35.2 sq mi
ZIP Area
311
Density / Sq Mi
$108,889
Median Household Income
$55,540
Median Earnings
$1,438
Median Rent
$589,400
Median Home Value
Check the figures for this property
Cap Rate, Value Estimation, Potential NOI and more
View Realmo Analytics
Market
Vacancy Rate% for Retail in Northeast region

Questions? Ask Rey
Realmo’s AI knows this listing — price, zoning, demand, history. Ask anything.


Frequently Asked Questions
What type of property is this?
Conventional restaurant - Existing food-service and convenience uses are combined with an attached residence and access to town water and sewer.
Where is this conventional restaurant located?
The property is located at 10 Shore Road York, ME.
What is the asking price?
The asking price for this property is $995,000.
What are key features of this property?
This property features: 3,275 SF property with restaurant, take‑out, convenience store, and attached residence; Built in 1953; CD4 zoning supports redevelopment for 5 new residential homes


