Two-Level Storefront

For Sale
$275,000
732 E Cayuga Street, Bellaire, MI 49615
Commercial/Industrial, Bellaire, MI
Property Size2,400 SF
Lot Size0.46 Acres
Price / SF$114.58
Days on Market87
Property Features for 732 E Cayuga Street
General Information
Property type
Commercial Sale
Property subtype
Office
Zoning
Commercial
Window features
Wood Frames
Elementary school district
Bellaire
Middle school district
Bellaire
High school district
Bellaire
Directions
From 88/S Division, Travel East on E Cayuga and building will be on the Right, just before Fairground Rd
Subdivision
Kearney
Standard status
Active
APN
05-41-030-002-15
Size
2,400 SF
Lot size
0.46 Acres
Taxes and HOA fees
Tax Description
PARCEL B..COM AT THE NE COR OF SEC 30; TH S 00 DEG W 33 FT ALG E SEC LINE TO S LINE OF E CAYUGA.....
Legal Description
PARCEL B..COM AT THE NE COR OF SEC 30; TH S 00 DEG W 33 FT ALG E SEC LINE TO S LINE OF E CAYUGA.....
Utilities
Heating system
Natural Gas, Forced Air
Amenities
front porch
Building Details
Year built
1920
Building materials
Wood Frame
Roof type
Shingle
Listing Agency:
Pat O'Brien & Associates - Charlevoix
(231) 547-7701
Listed By:
Adam Boyce
(231) 330-5035
Added: Jul 12
Changed: Sep 14
Last Checked: Oct 6 at 5:06AM
MLS# 478684
Copyright © 2026 Northern Michigan MLS. All rights reserved. All information provided by the listing agent/broker is deemed reliable but is not guaranteed and should be independently verified.
Investment Insights
Based on property information with market context.
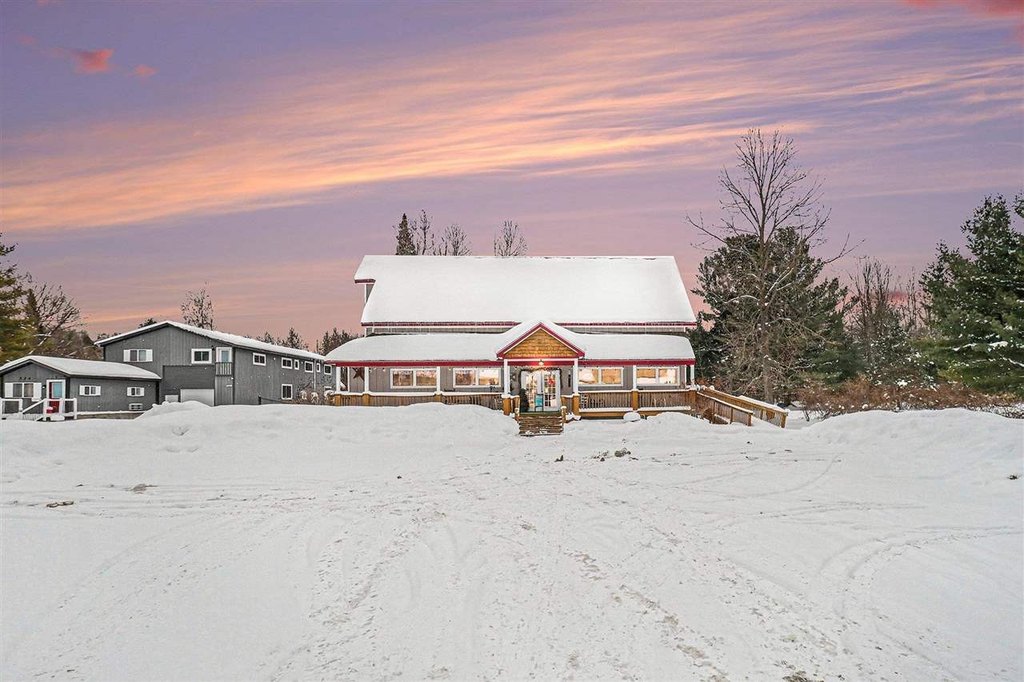
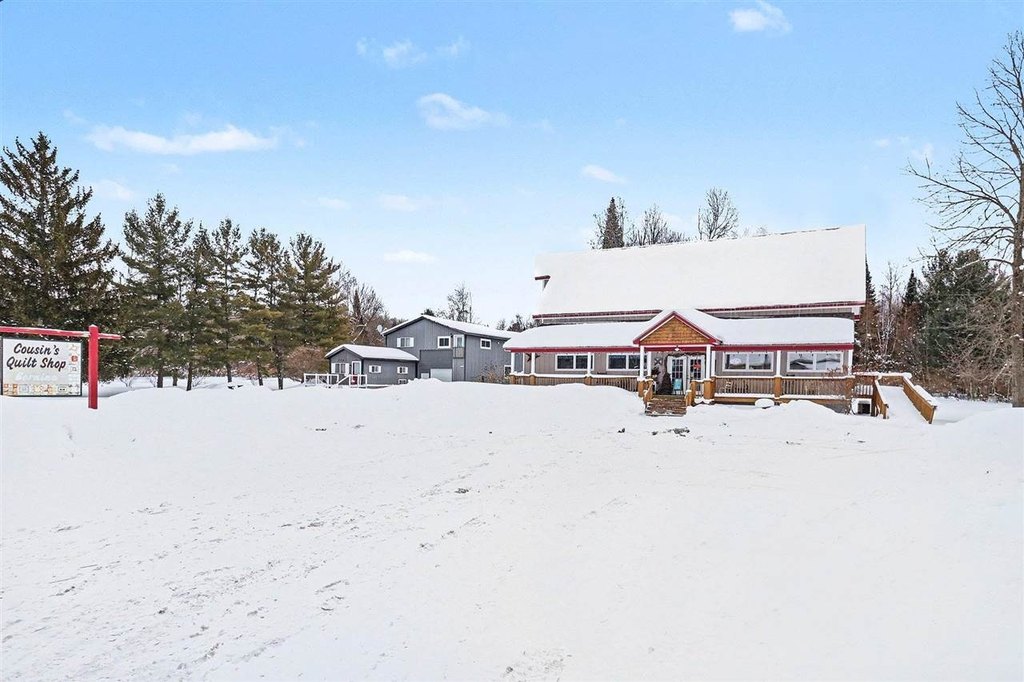
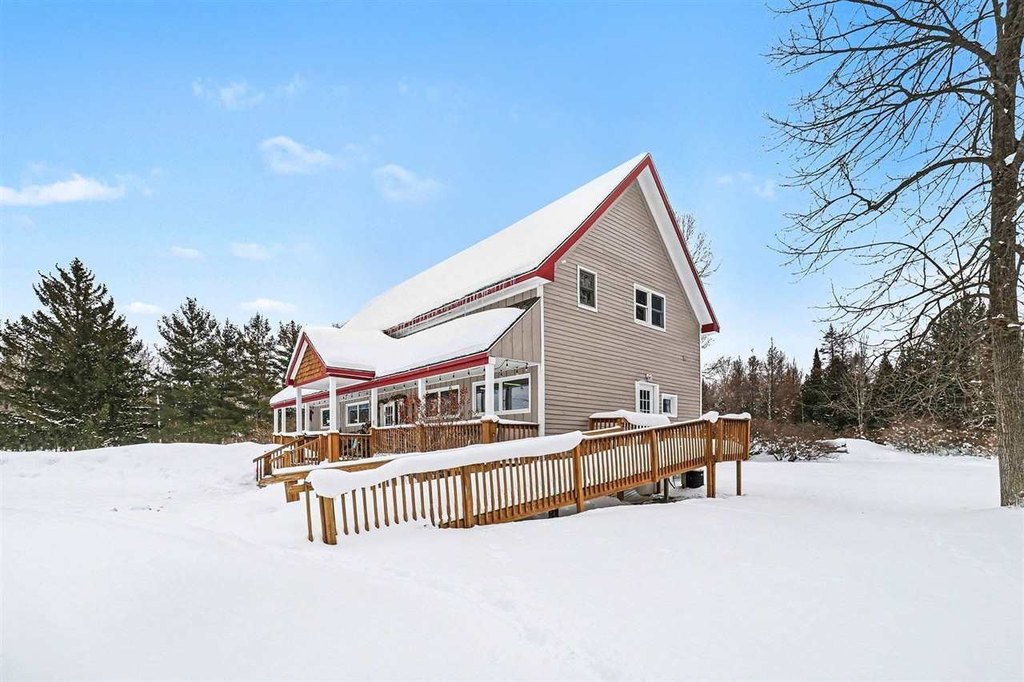
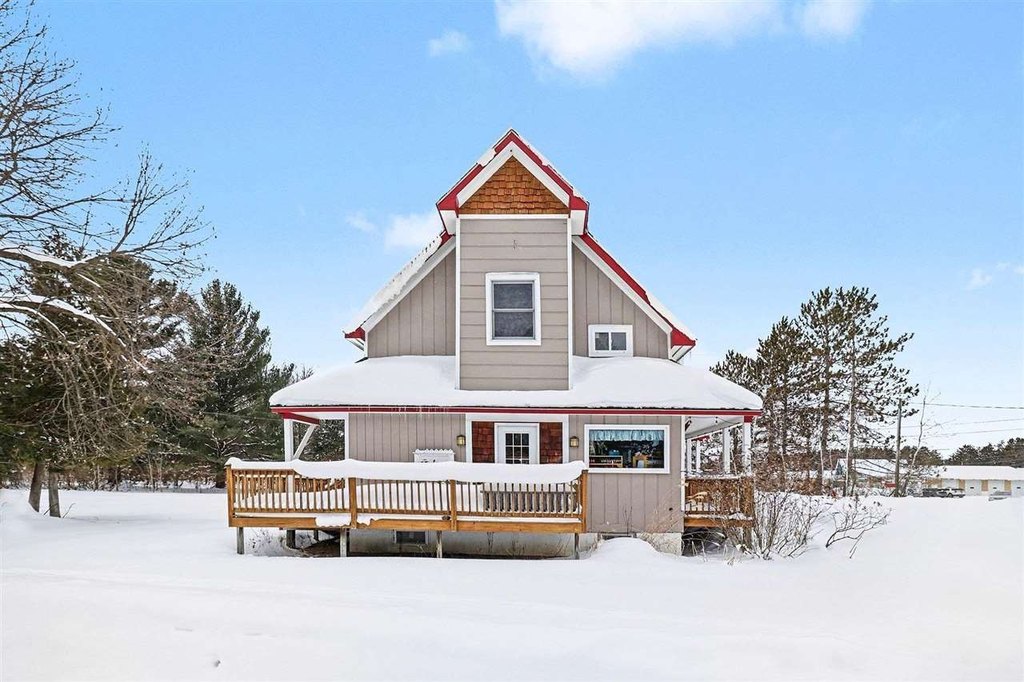
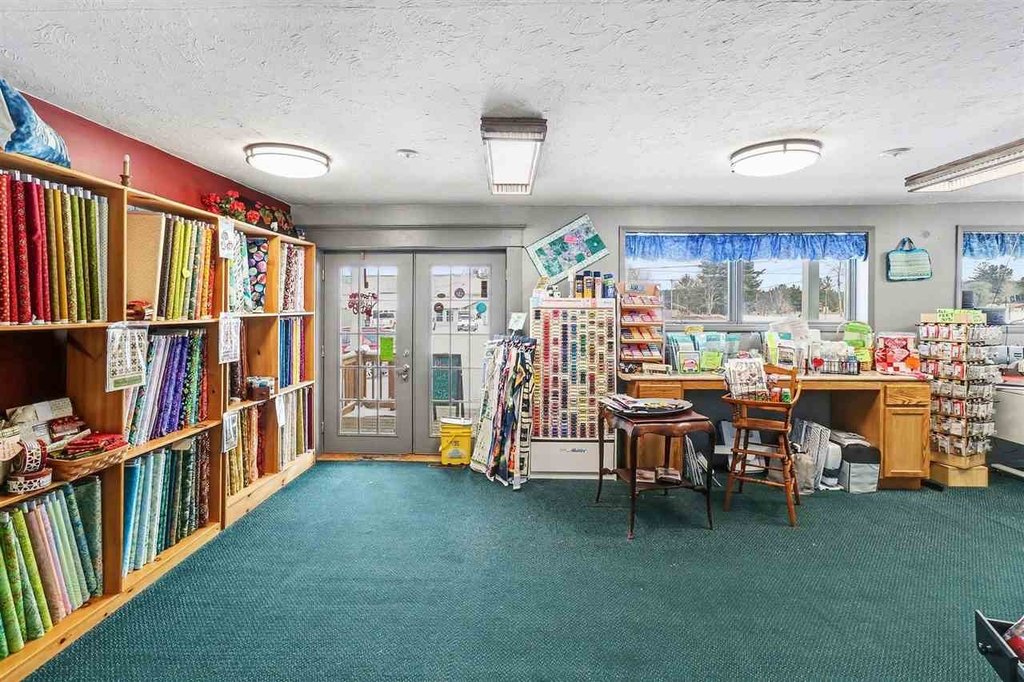
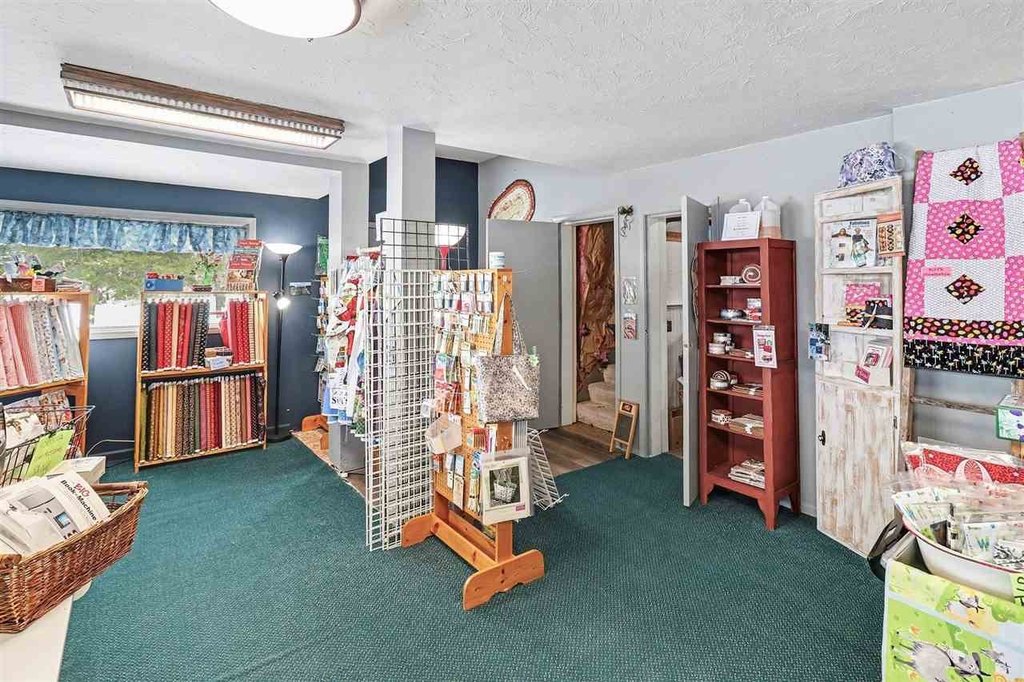
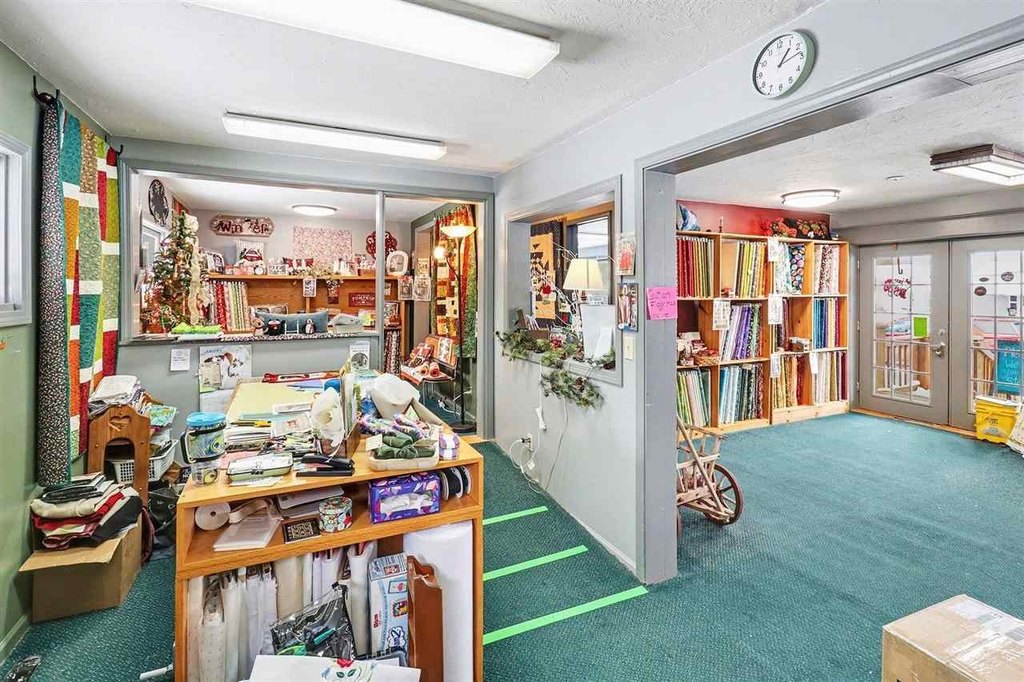
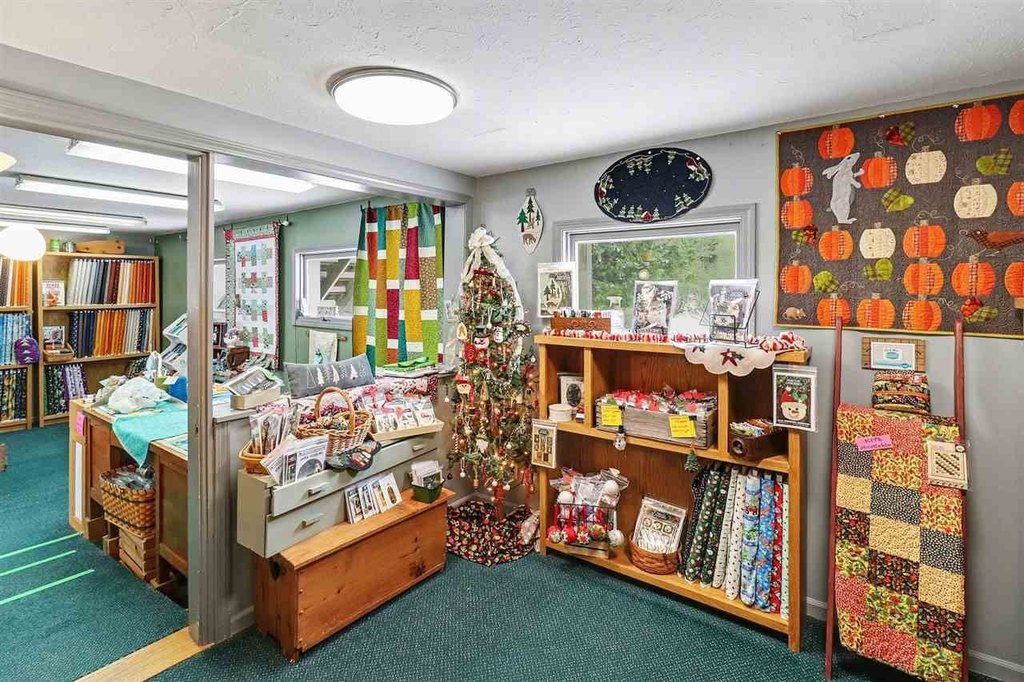
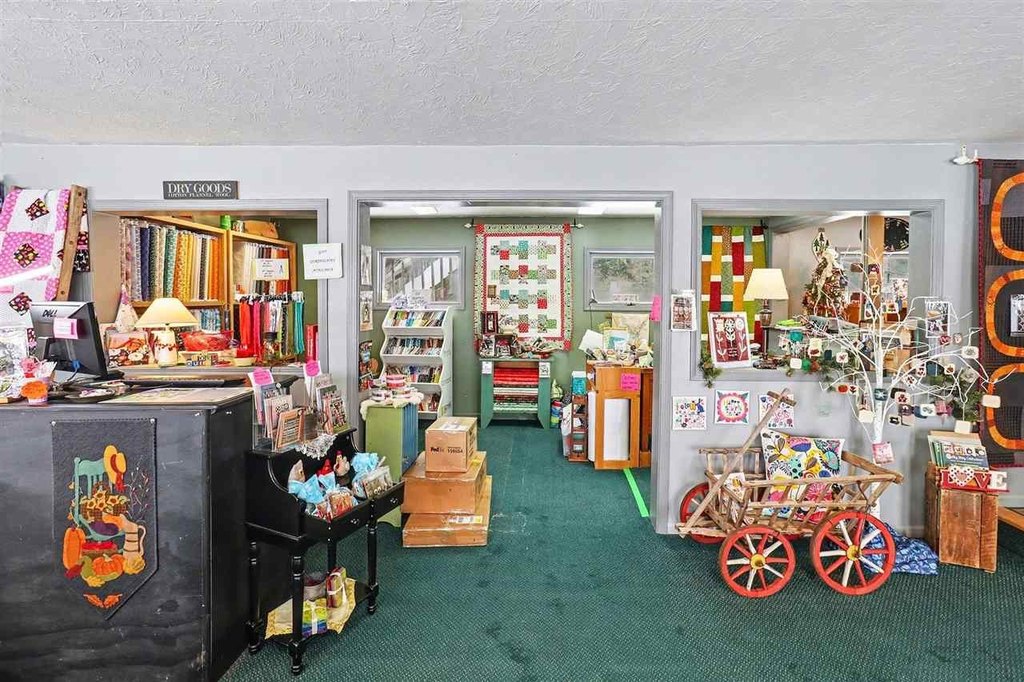
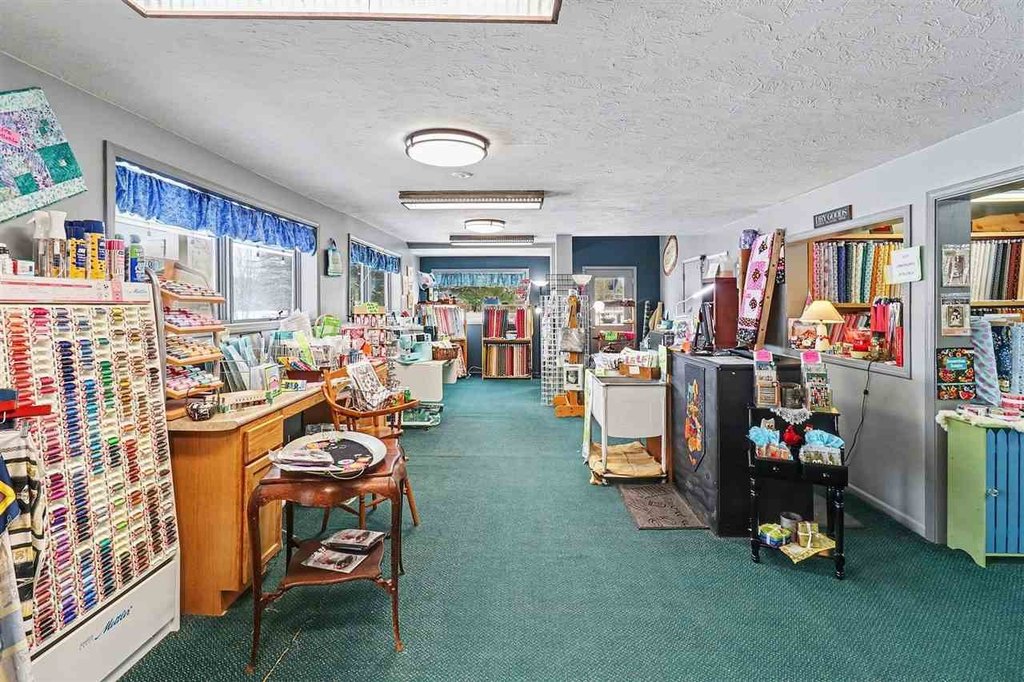
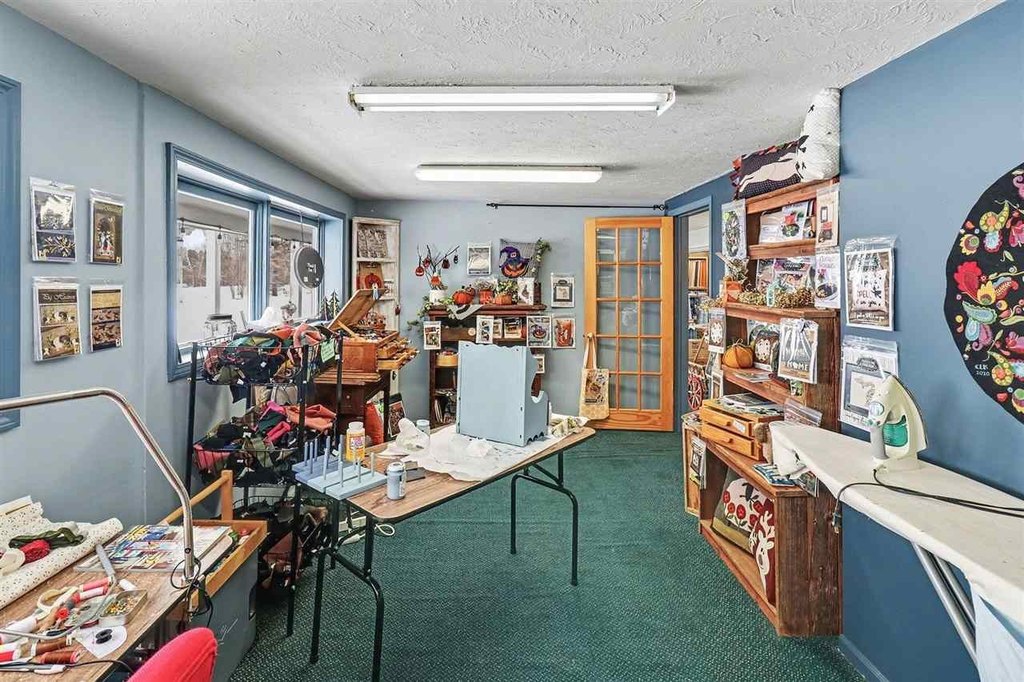
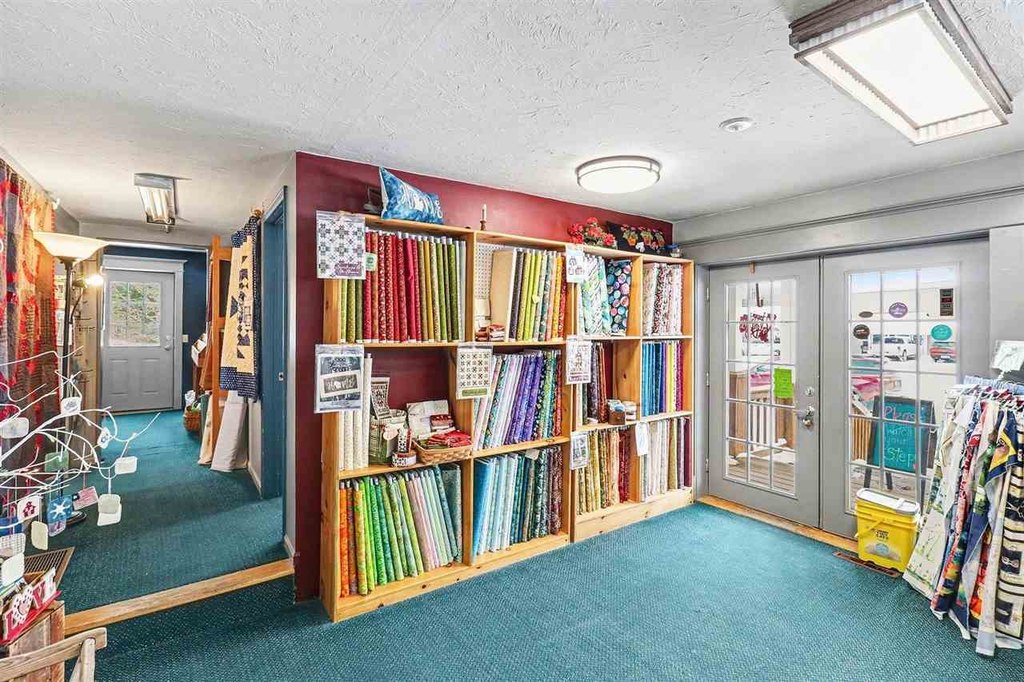
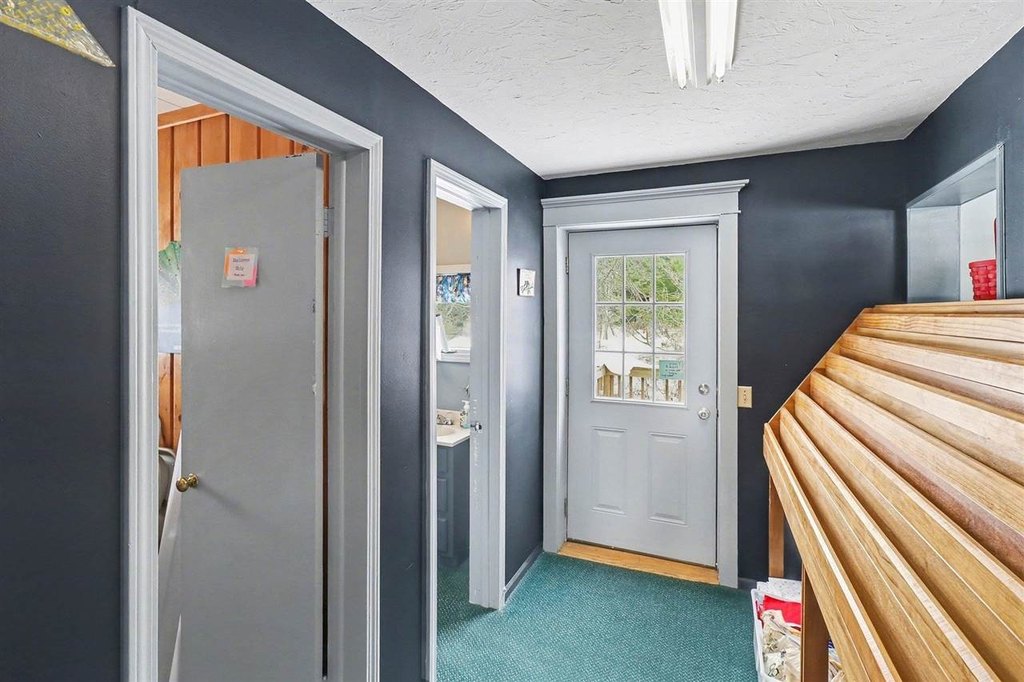
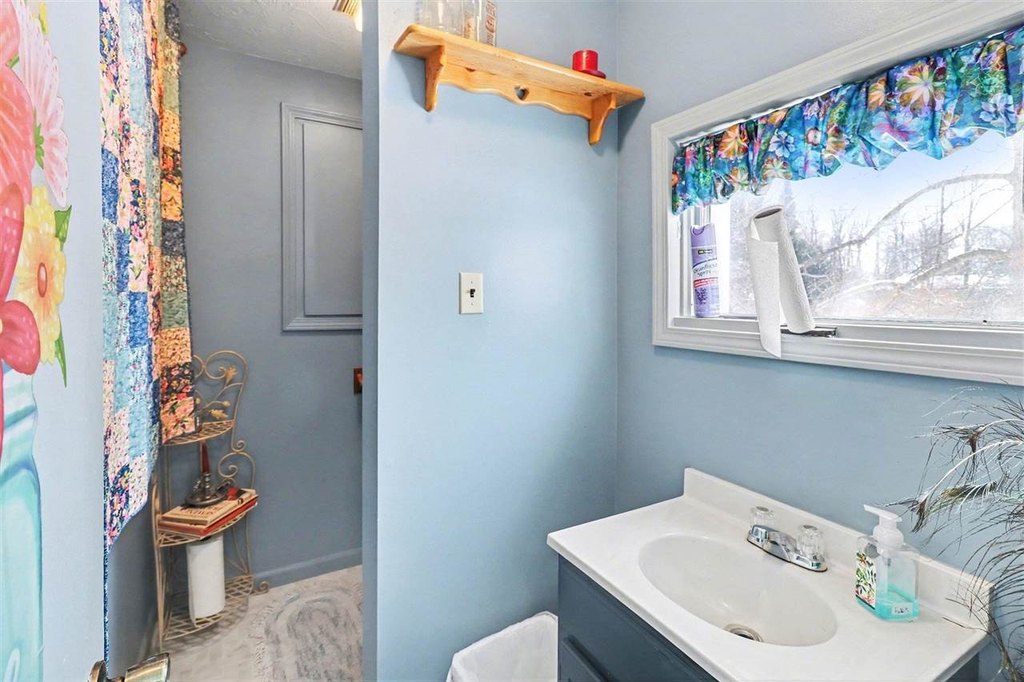
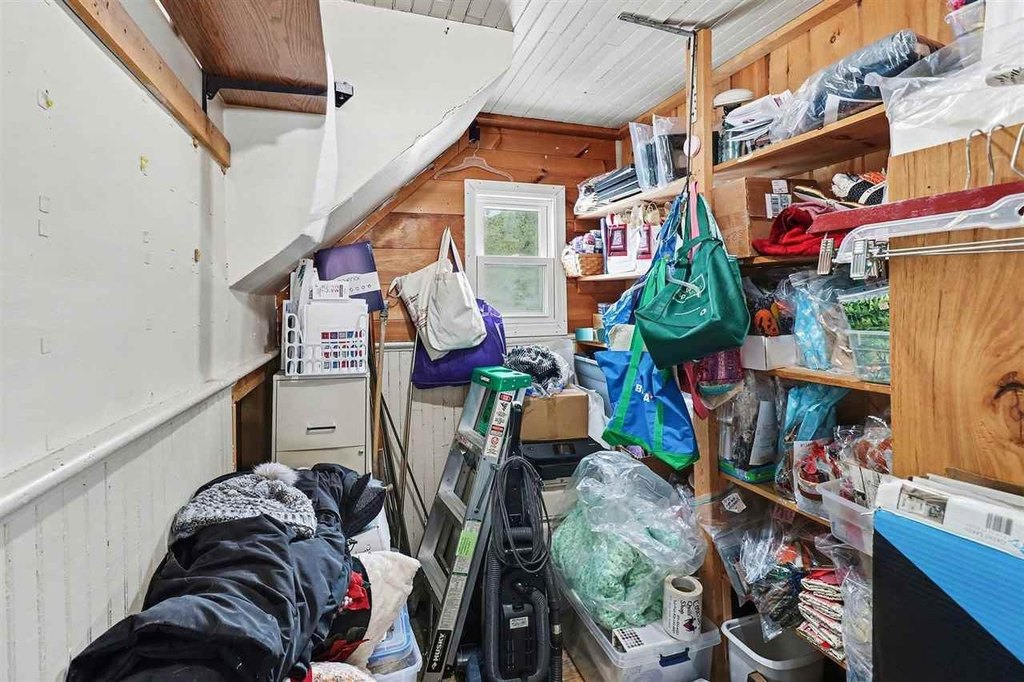
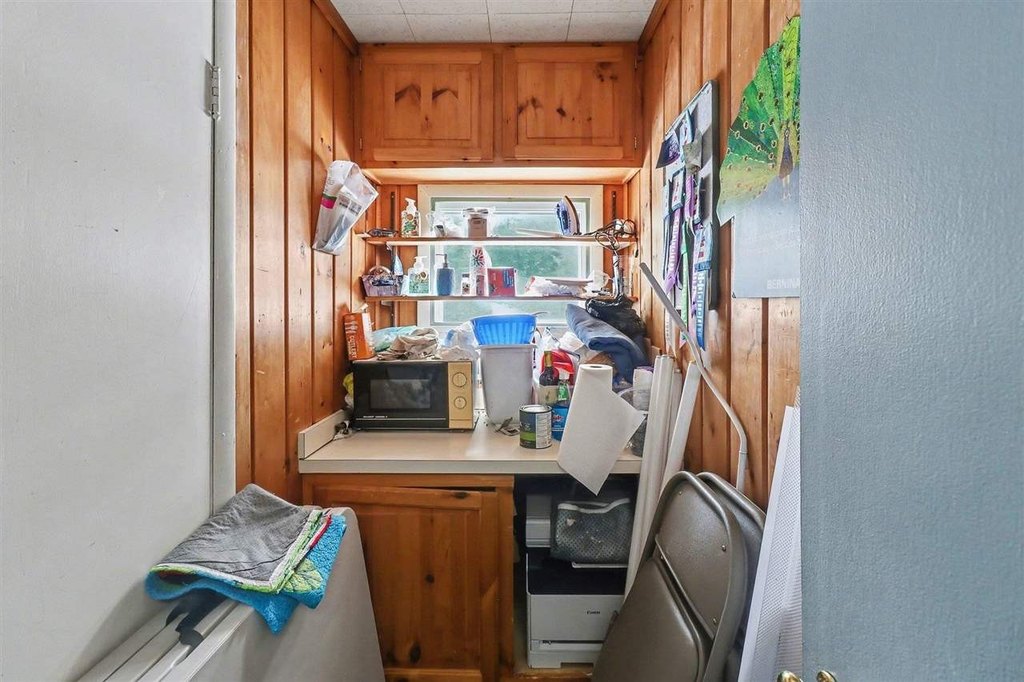
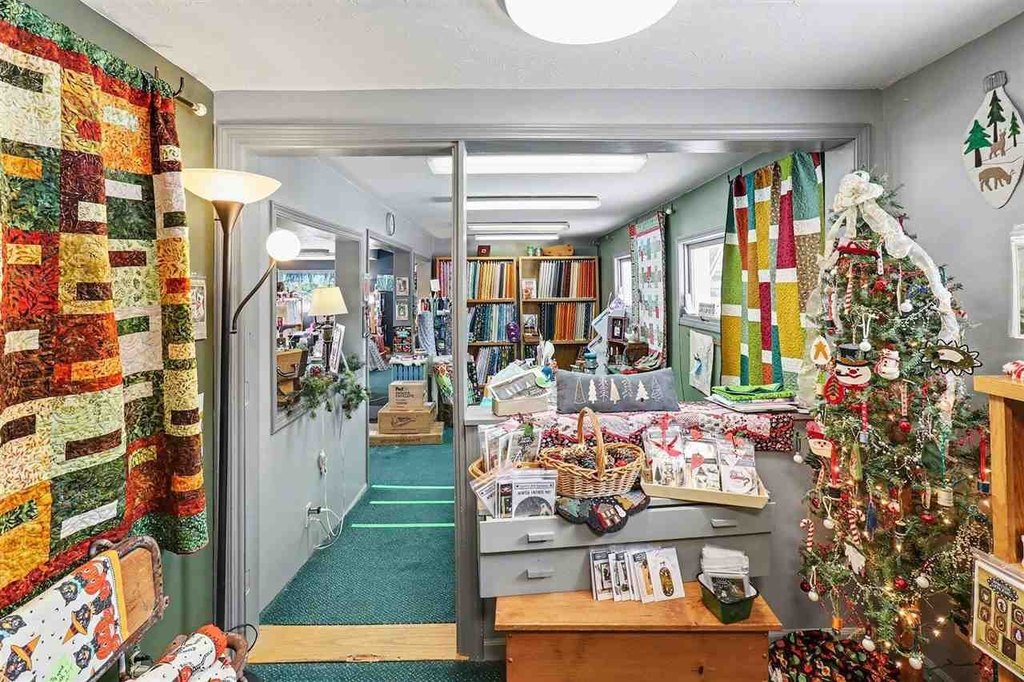
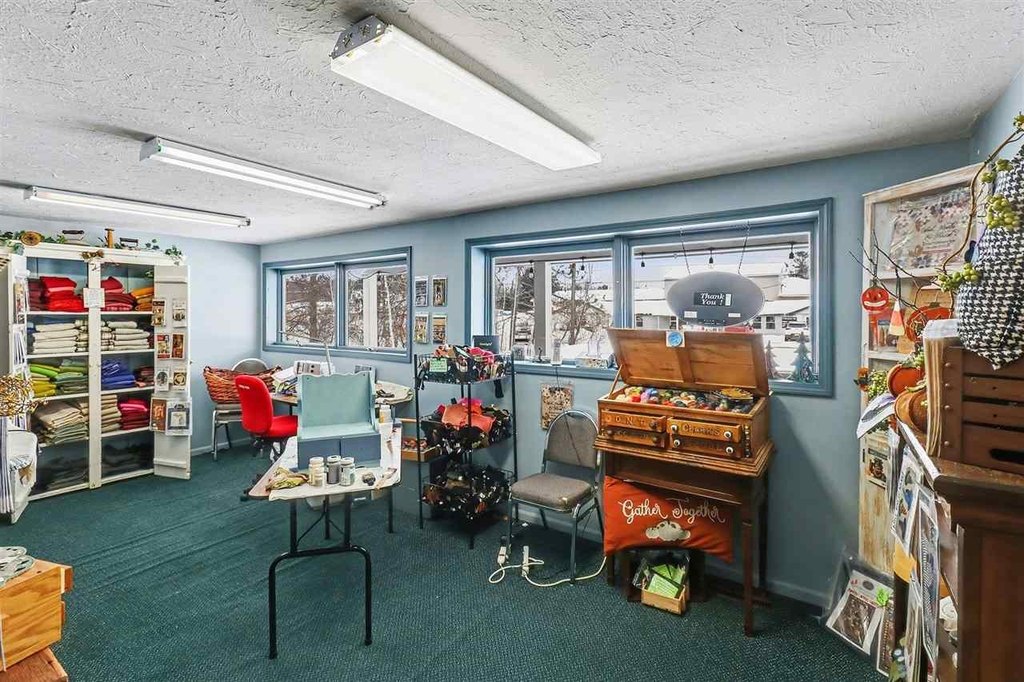
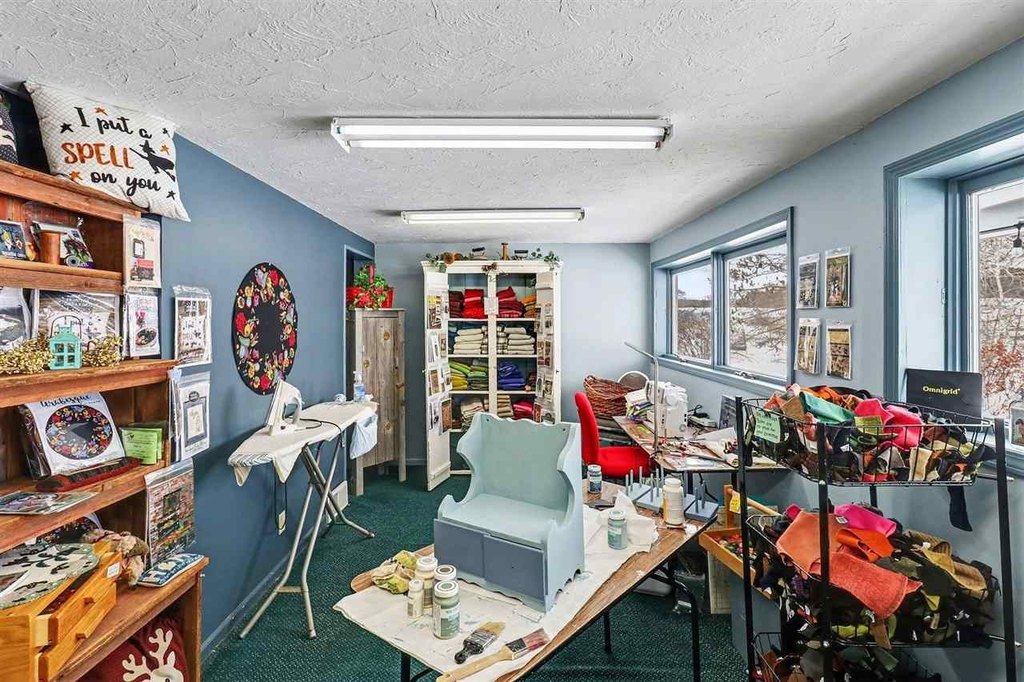
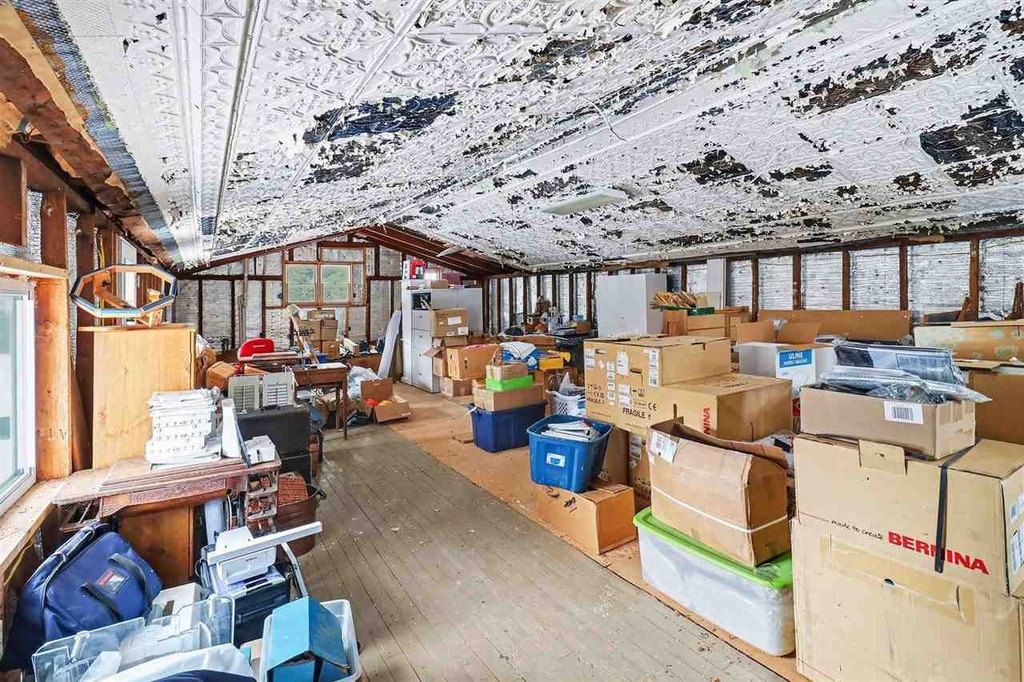
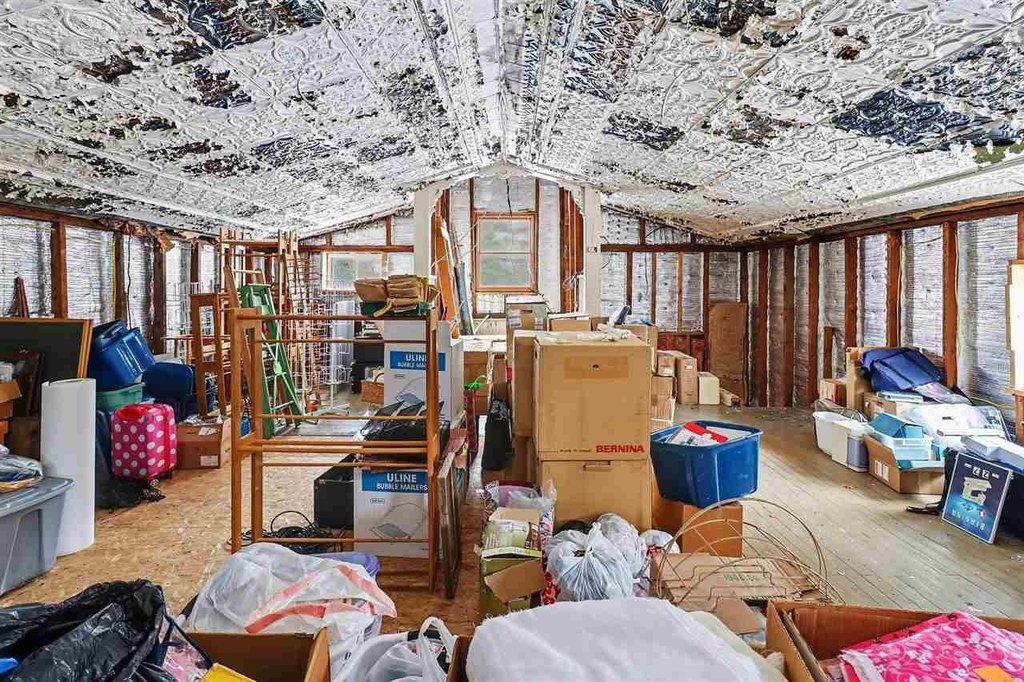
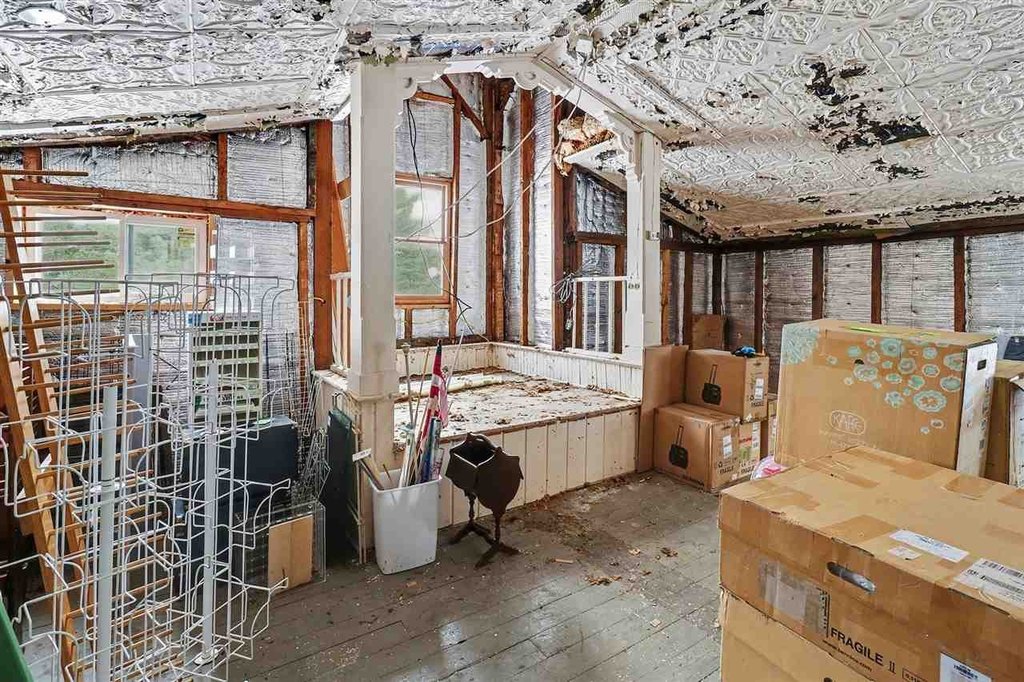
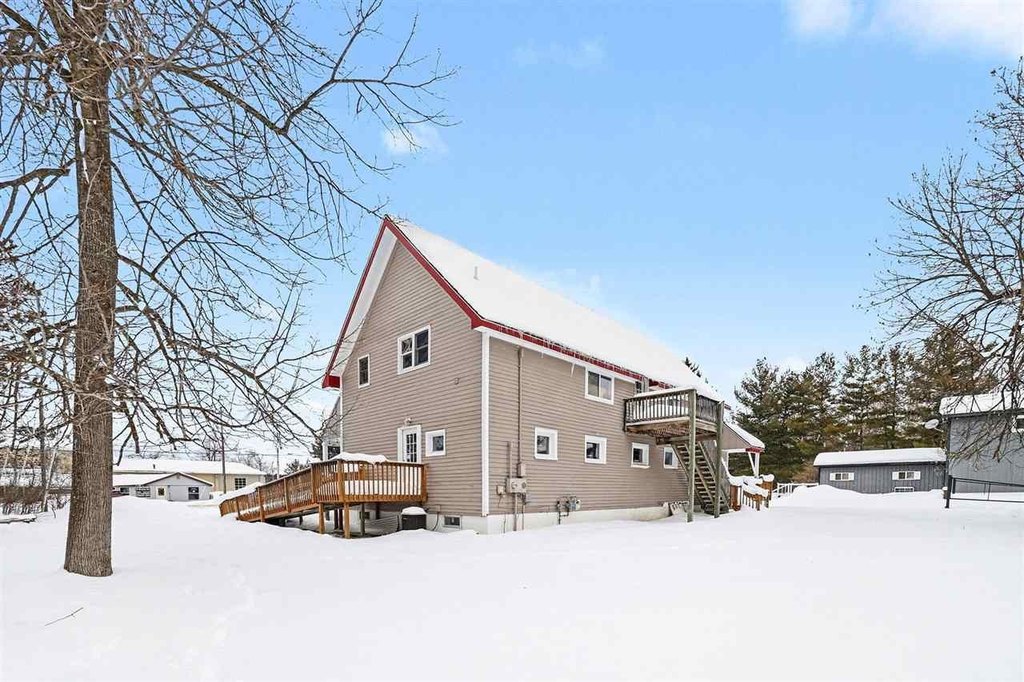
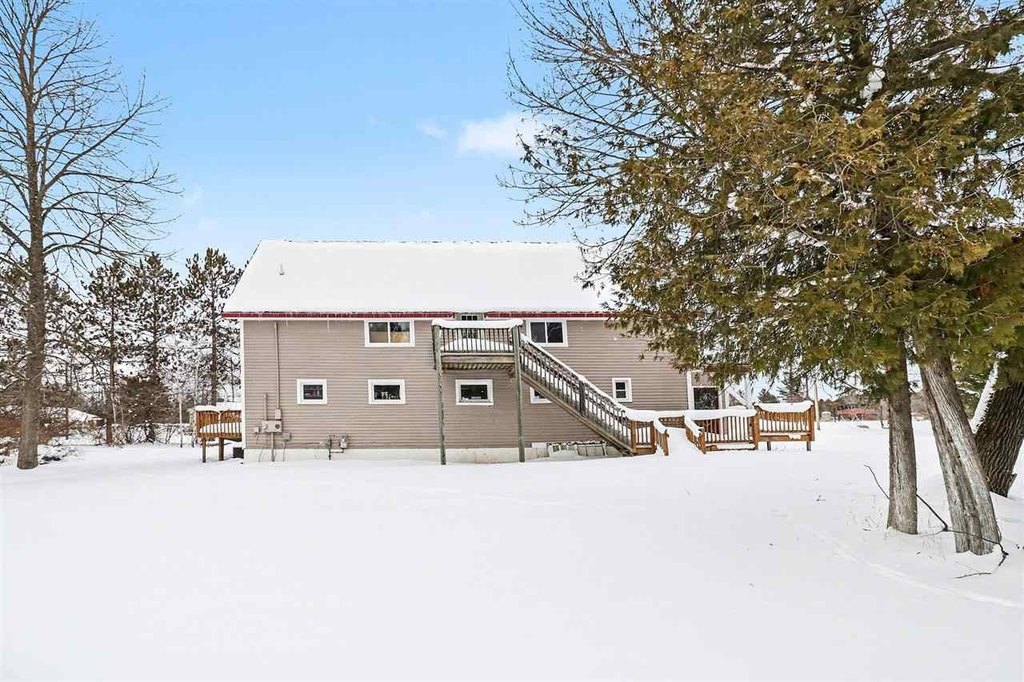
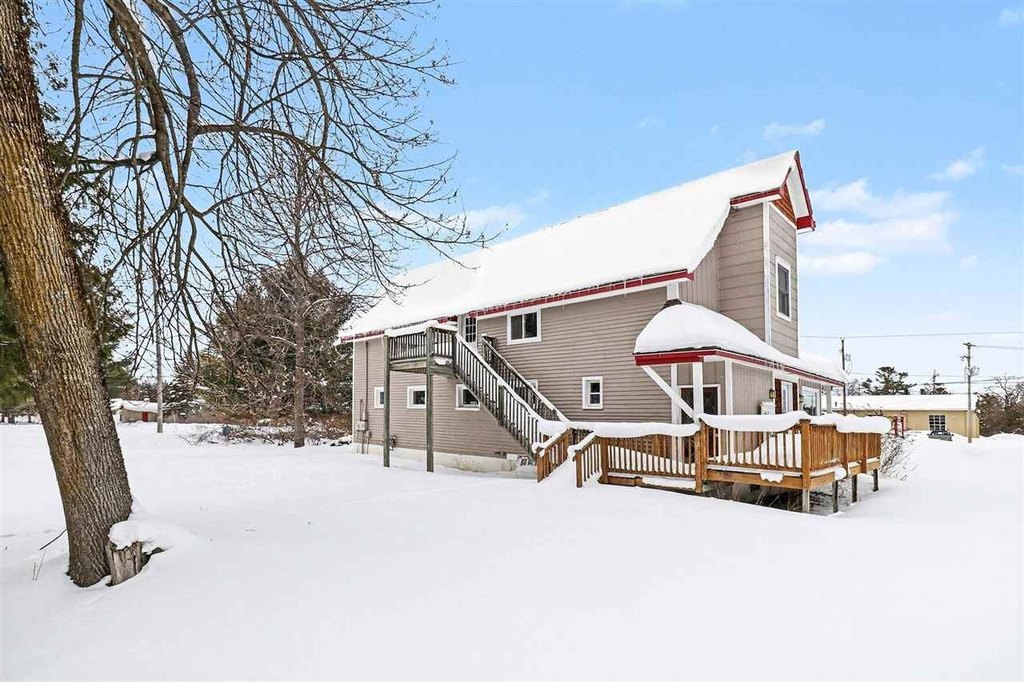
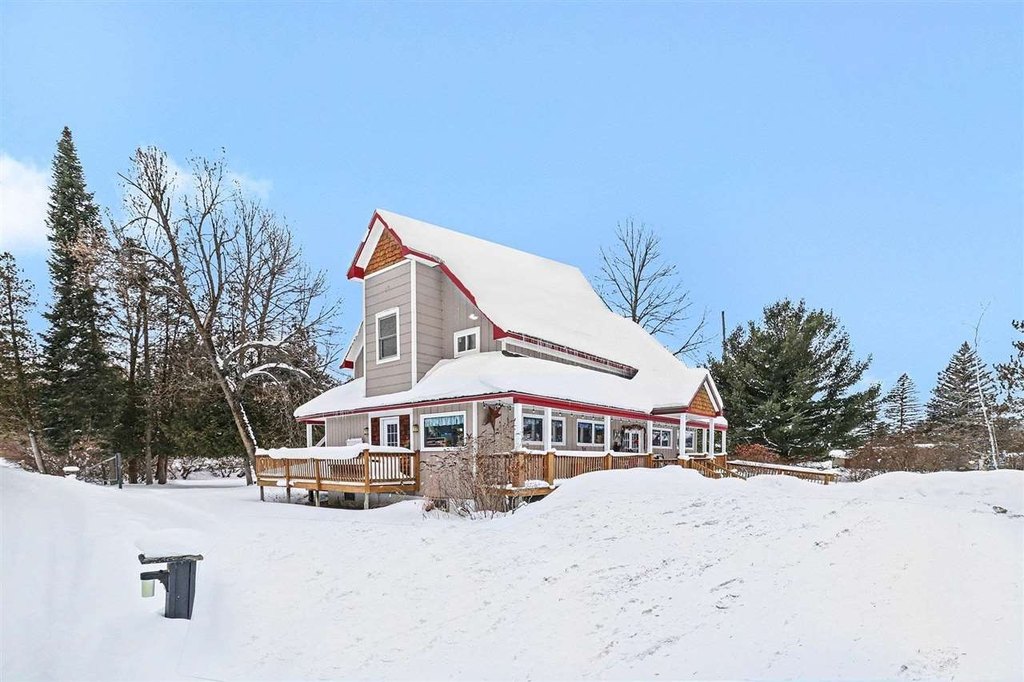
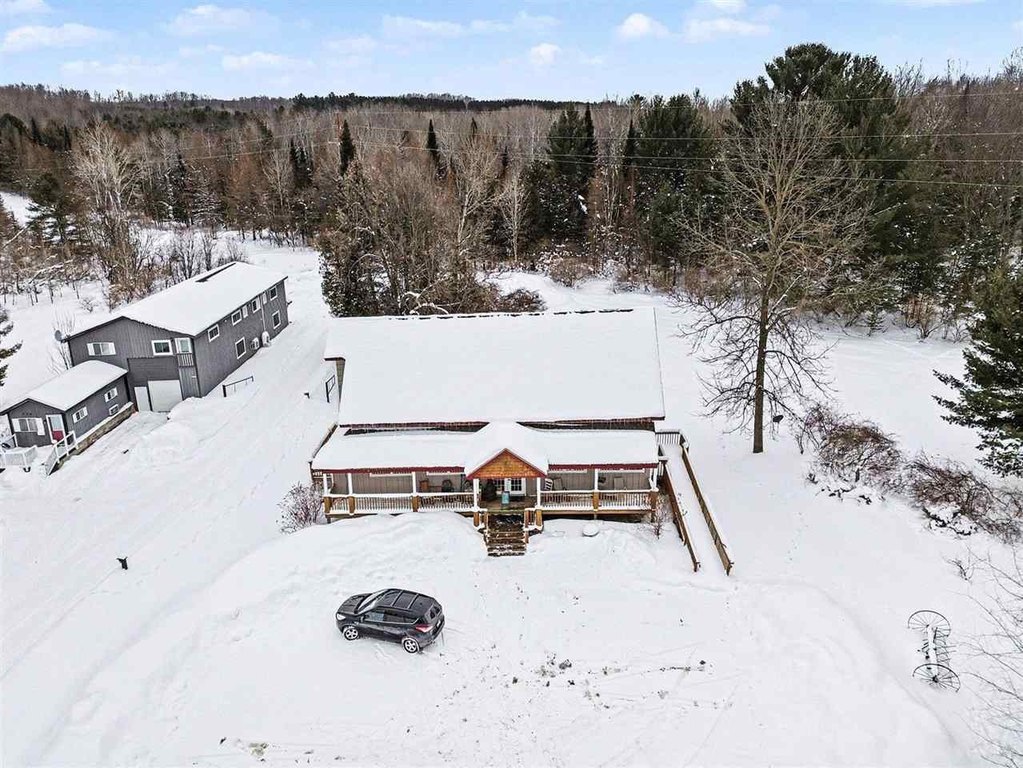
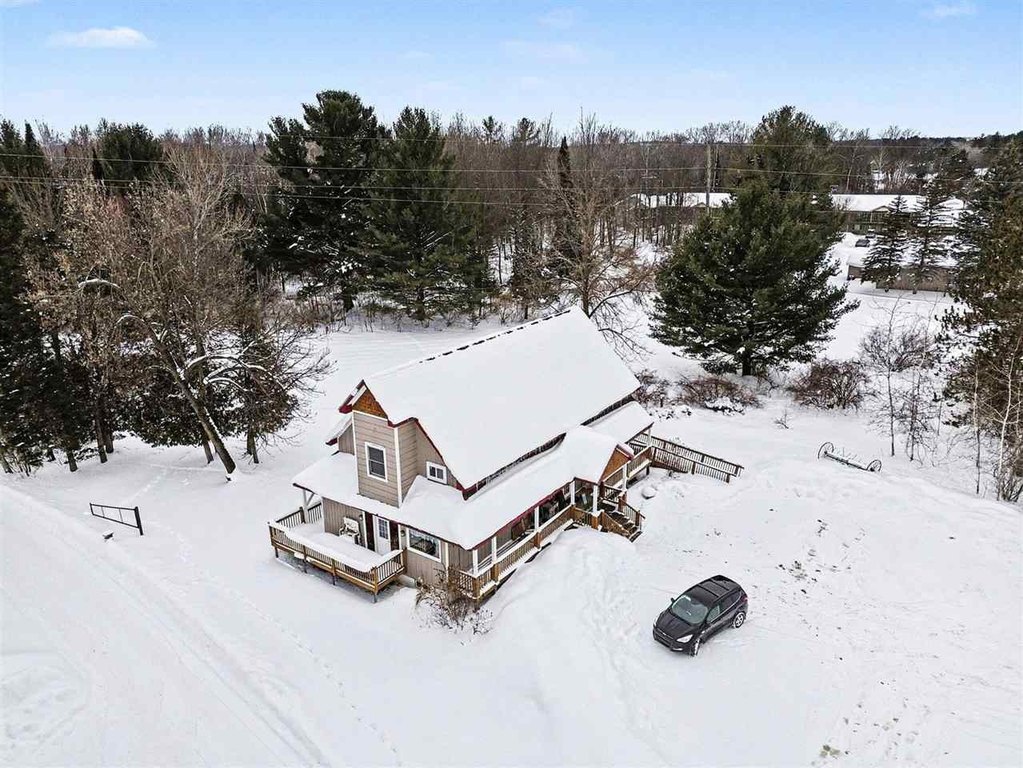
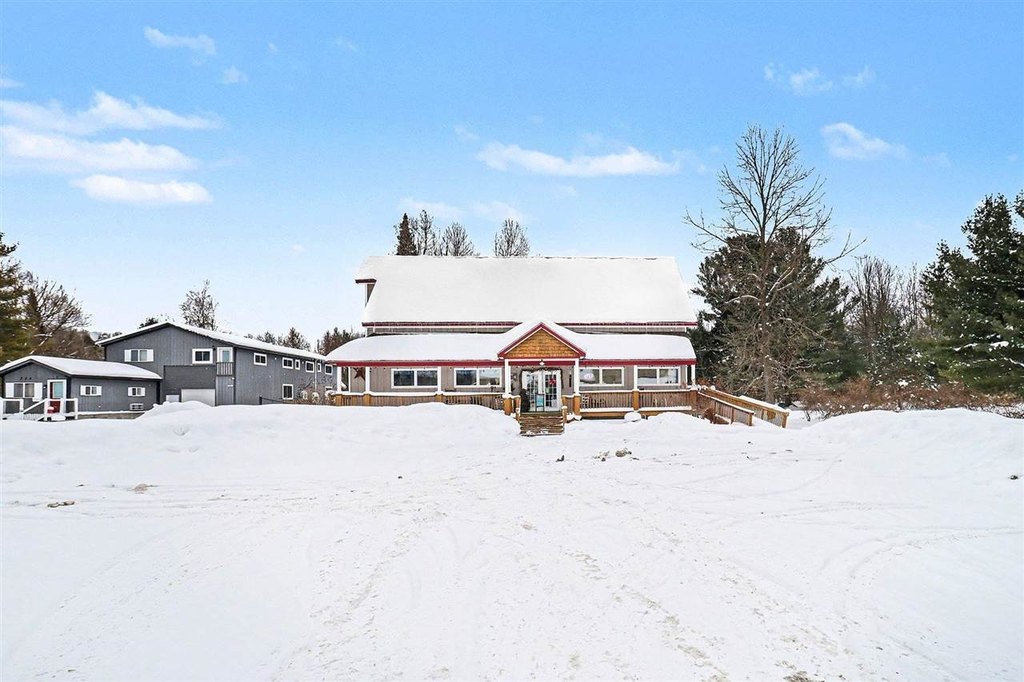
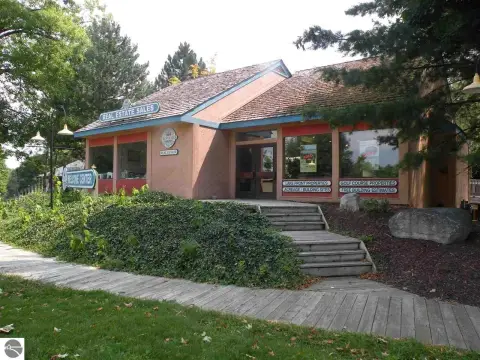
This 2,400-square-foot wood-frame storefront building provides two levels of commercial space. The main floor contains approximately 1,200 square feet of finished area, while the upper floor offers approximately 1,200 square feet of unfinished space for additional configuration. A front porch adds covered exterior space, and the property has a shingle roof. Built in 1920, the building is heated by natural gas forced air.
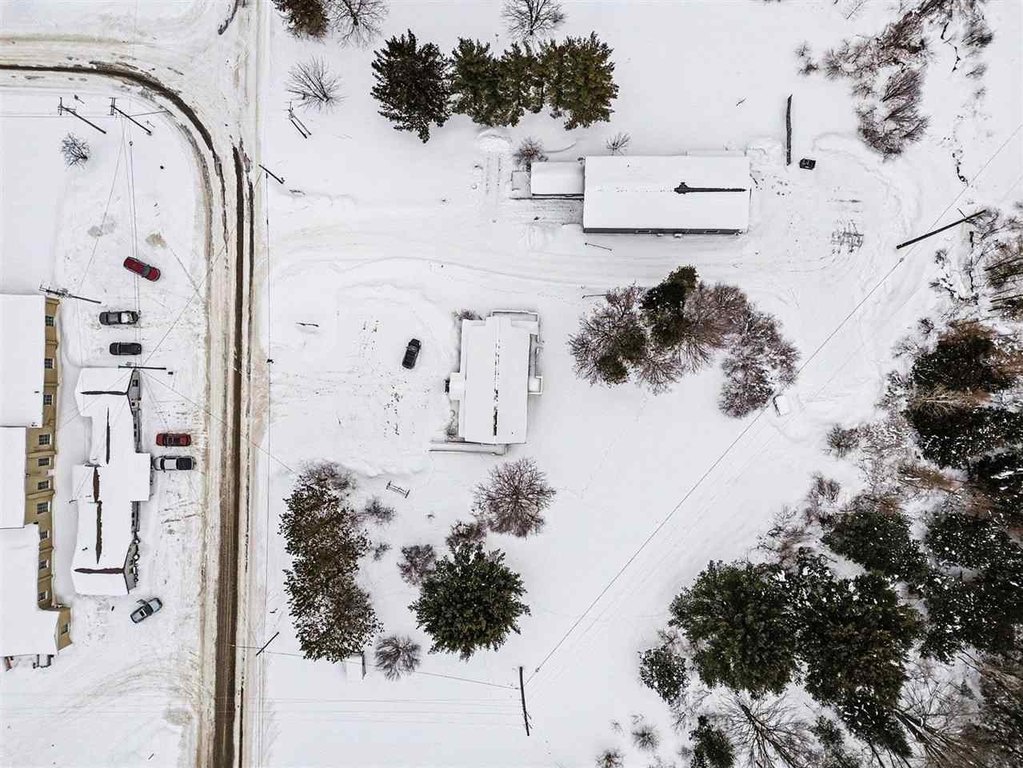
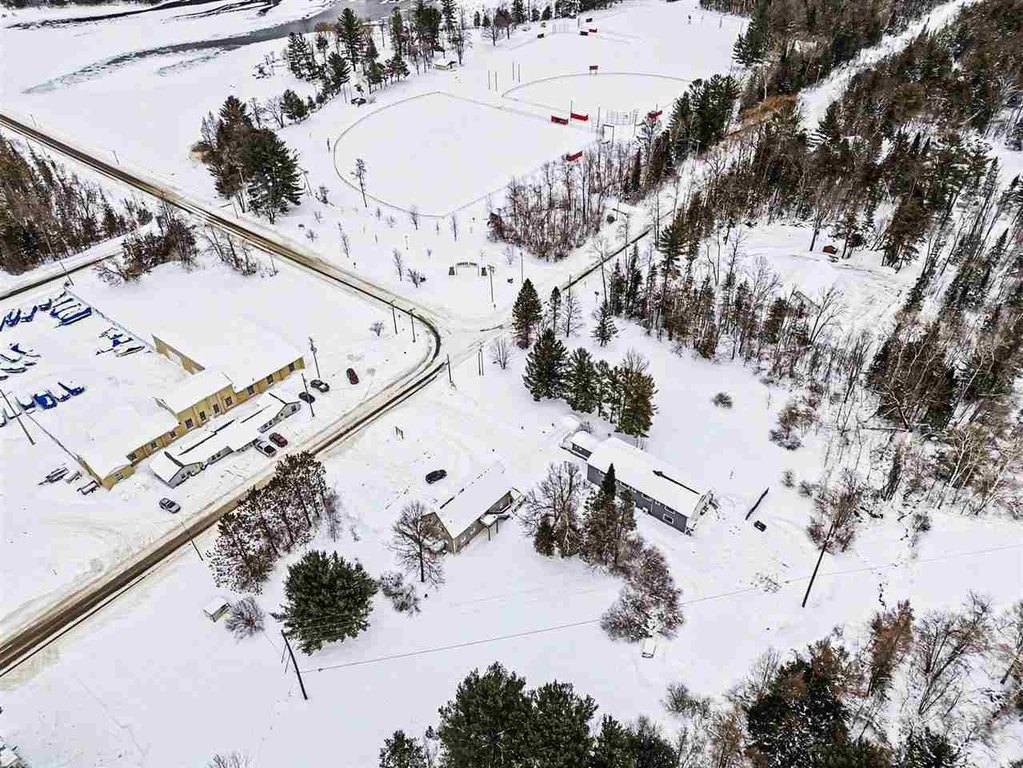
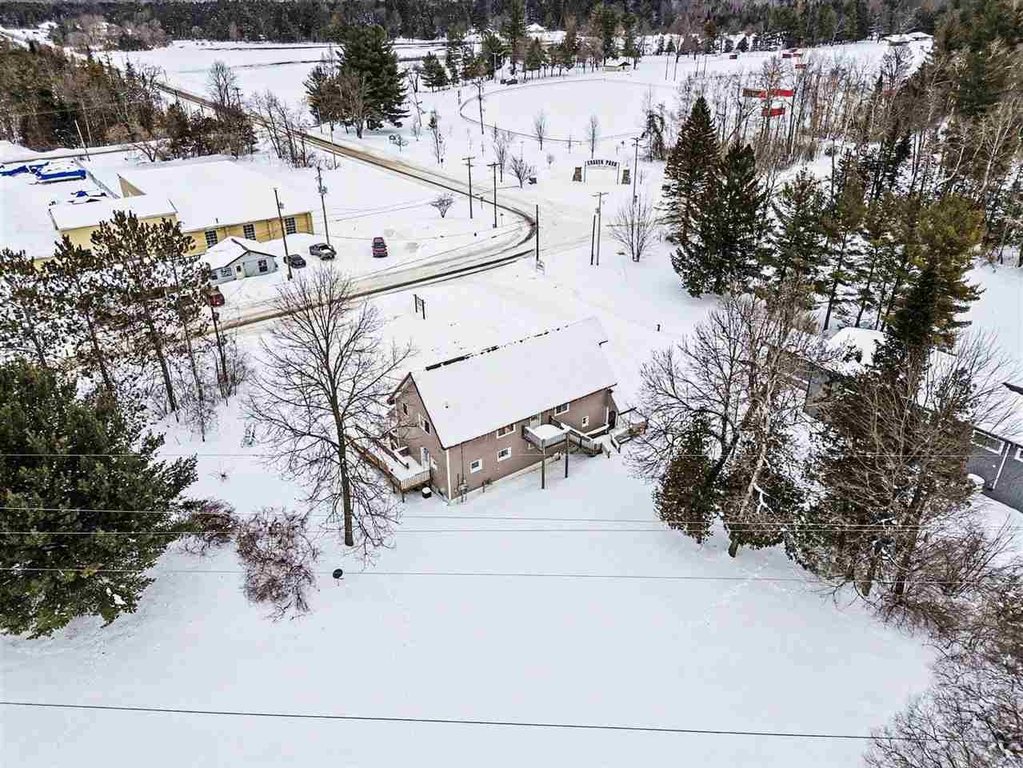
The property is located at 732 E Cayuga Street in Bellaire, across from Craven Park. Commercial zoning supports the property’s current classification, with village water, sewer, natural gas, electric, and cable internet available. Its placement near the park and within the village provides a setting for retail, boutique, or professional office use, subject to applicable approvals.
The property is located at 732 E Cayuga Street in Bellaire, across from Craven Park. Commercial zoning supports the property’s current classification, with village water, sewer, natural gas, electric, and cable internet available. Its placement near the park and within the village provides a setting for retail, boutique, or professional office use, subject to applicable approvals.
Key Highlights
- 2,400‑square‑foot building with approximately 1,200 square feet on each level
- Main level includes approximately 1,200 square feet of finished space
- Upper level offers approximately 1,200 square feet of unfinished area
Financial Insights
Estimated NOI and Cap Rate
NOI / Yr
$24,914
Cap Rate
9.06%
Suggested Prices Based on Cap Rates
Cap Rate 5%
$498,280
$498.3K
Cap Rate 7%
$355,914
$355.9K
Cap Rate 9%
$276,822
$276.8K
Market Conditions
NOI Build-Up for 2,400 SF
Gross rent
$37.2K $15.48/SF
− Vacancy
−$1.6K −$0.65/SF
EGI
$35.6K $14.83/SF
− OpEx
−$10.7K −$4.45/SF
NOI
$24.9K $10.38/SF
Area
Antrim County, MI
Vacancy
4.20%
Lease Rate
$15.48 /SF/Yr
Expense Ratio
30.00%
Simulate Cap Rate and NOI
Suggested Prices Based on Cap Rates
Cap Rate 5%
$498,280
Cap Rate 7%
$355,914
Cap Rate 9%
$276,822
Alternative Uses
Best Use
Retail
$355.9K
$311.4K – $415.2K
NOI $24,914 @ 7.0% cap · market cap 9.06%
Second Best
Office B
$351.4K
$307.5K – $410.0K
NOI $24,599 @ 7.0% cap · market cap 8.95%
Theoretical Best
Office A
$427.1K
$373.7K – $498.3K
NOI $29,897 @ 7.0% cap · market cap 10.87%
Zoning and permitted uses should be independently verified with authorities.
Property Analytics
Unlock full access to Insights
Subscribe to Realmo Intelligence
Open Analytics
Current Use
Lease Details
Yes
Utilities to site
Location Intelligence
Trade Area within ½ mile
151
Businesses Nearby
Well-served
Demand for This Use
Explore this area
Business Placement
Demographics for 49615, MI
4,161
Population
3,575
Households
1.2
Avg Household Size
57
Median Age
44%
College-Educated
97%
High-School Grad
68.4 sq mi
ZIP Area
61
Density / Sq Mi
$78,750
Median Household Income
$38,635
Median Earnings
$775
Median Rent
$257,000
Median Home Value
Check the figures for this property
Cap Rate, Value Estimation, Potential NOI and more
View Realmo Analytics
Market
Vacancy Rate% for Office in Midwest region

Questions? Ask Rey
Realmo’s AI knows this listing — price, zoning, demand, history. Ask anything.



Frequently Asked Questions
What type of property is this?
Storefront property - Commercial storefront with finished retail space, an unfinished upper level, and a covered front porch in central Bellaire.
Where is this storefront property located?
The property is located at 732 E Cayuga Street Bellaire, MI.
What is the asking price?
The asking price for this property is $275,000.
What are key features of this property?
This property features: 2,400‑square‑foot building with approximately 1,200 square feet on each level; Main level includes approximately 1,200 square feet of finished space; Upper level offers approximately 1,200 square feet of unfinished area