Commercial Townhouse Office
7297 ROUTE 29 Falls Church, VA 22042
For Sale
$570,000
Commercial Sale - FALLS CHURCH, VA
Property Size1,500 SF
Price / SF$380
Days on Market118
Property Features for 7297 ROUTE 29
General Information
Property type
Other
Property subtype
Office
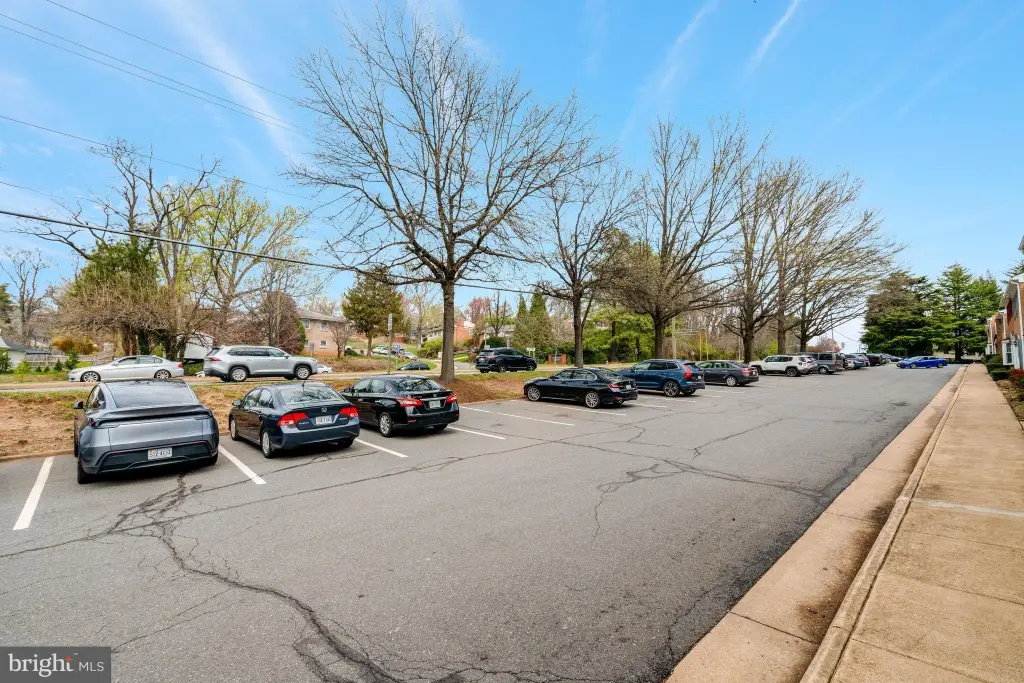
Parking
60
Parking features
Parking Lot, Assigned
Standard status
Active
Taxes and HOA fees
Tax Annual Amount
7116
Utilities
Heating system
Forced Air
Cooling system
Zoned, Central Air
Building Details
Year built
1979
Number of units
1
Building materials
Aluminum Siding, Brick
Listing Agency:
Berkshire Hathaway HomeServices PenFed Realty
(703) 281-8500
Listed By:
Lisa M Ducibella · License #0225073106
(703) 725-5225
Added: Apr 1
Changed: Jul 24
Last Checked: Jul 27 at 10:06AM
MLS# VAFX2297488
Copyright © 2026 Bright MLS. All rights reserved. All information provided by the listing agent/broker is deemed reliable but is not guaranteed and should be independently verified.
Investment Insights
Based on property information with market context.
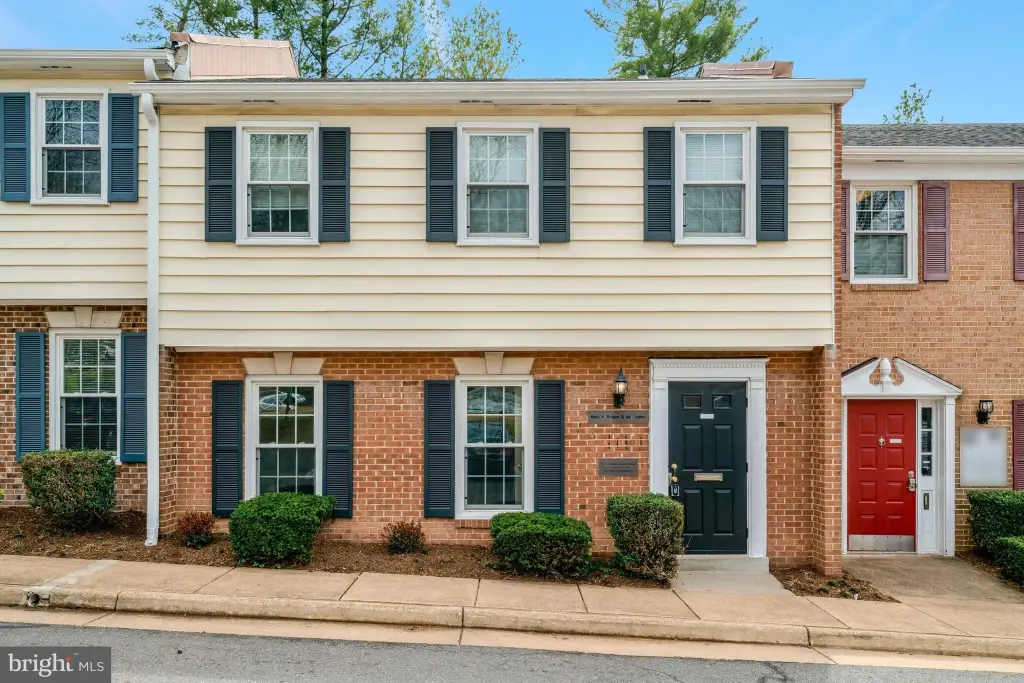
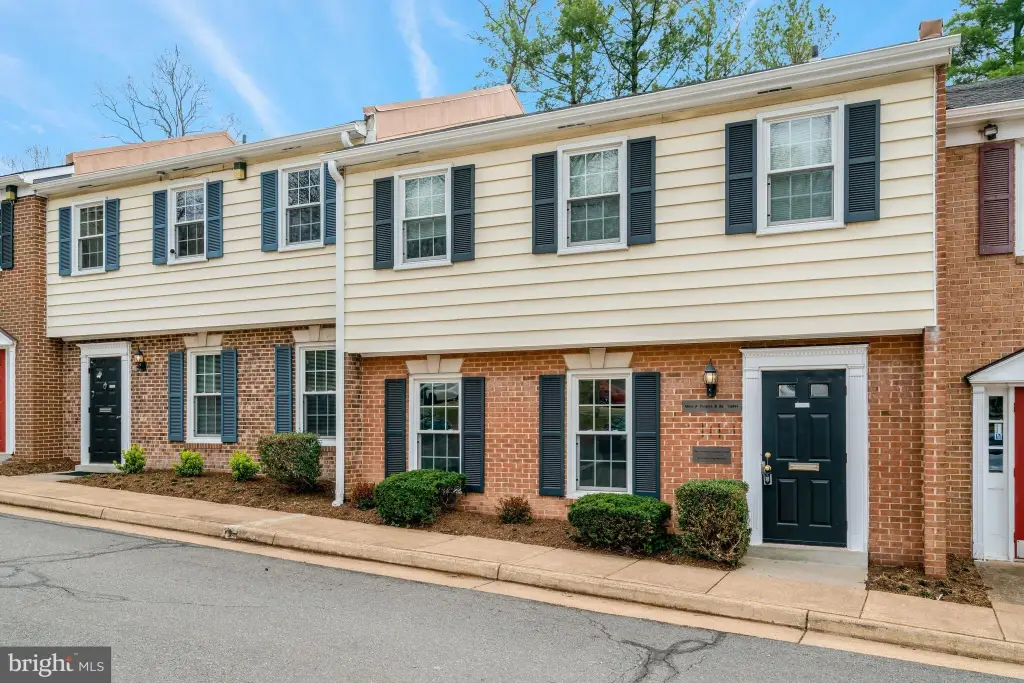
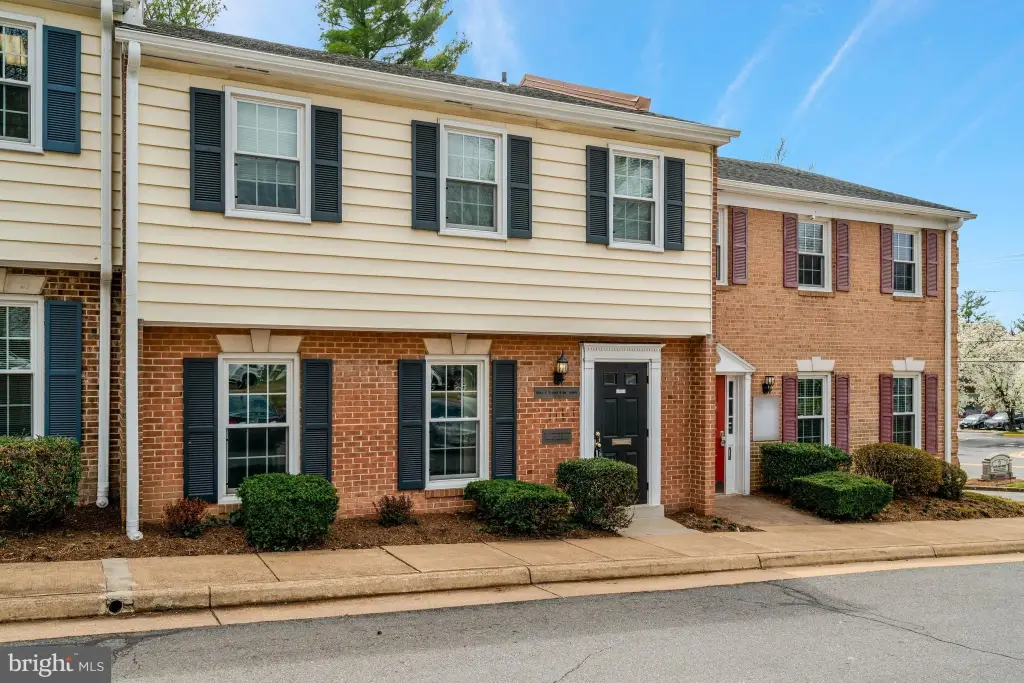
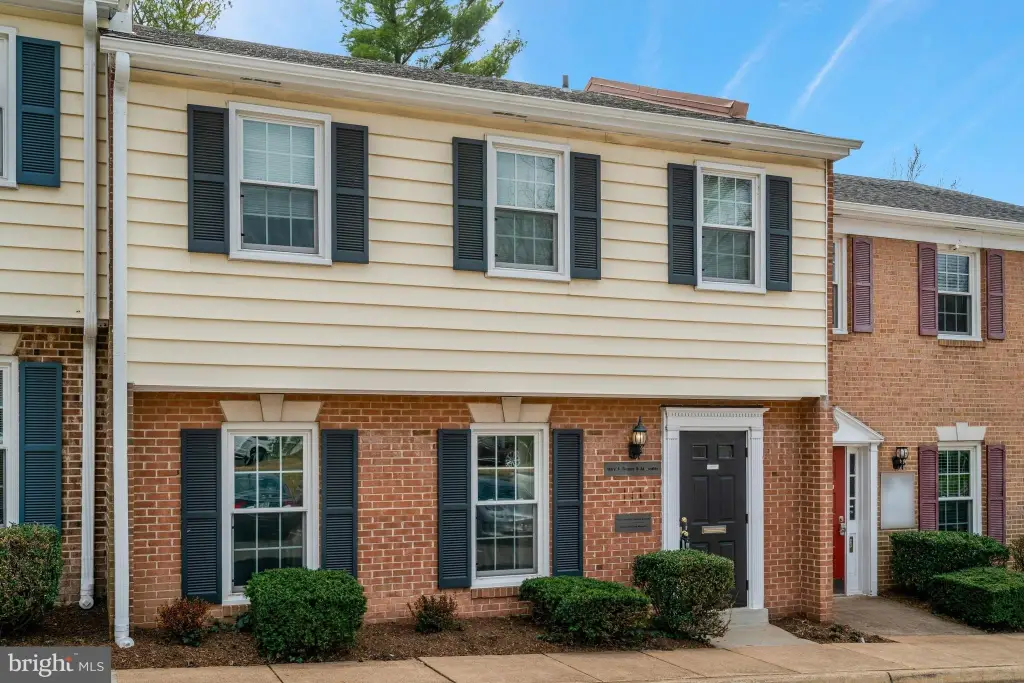
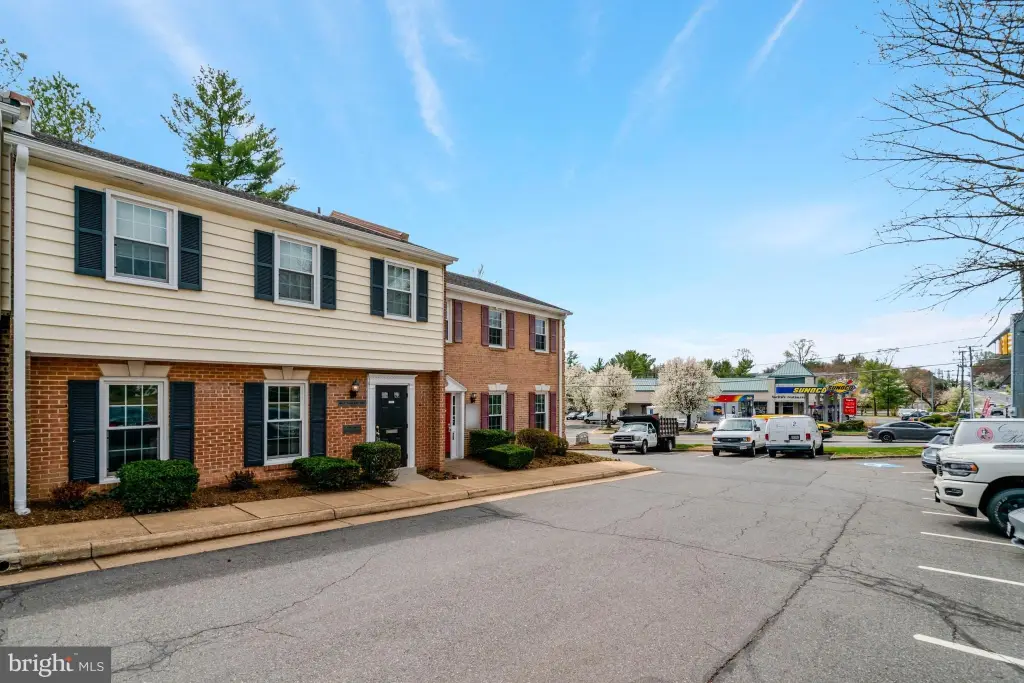
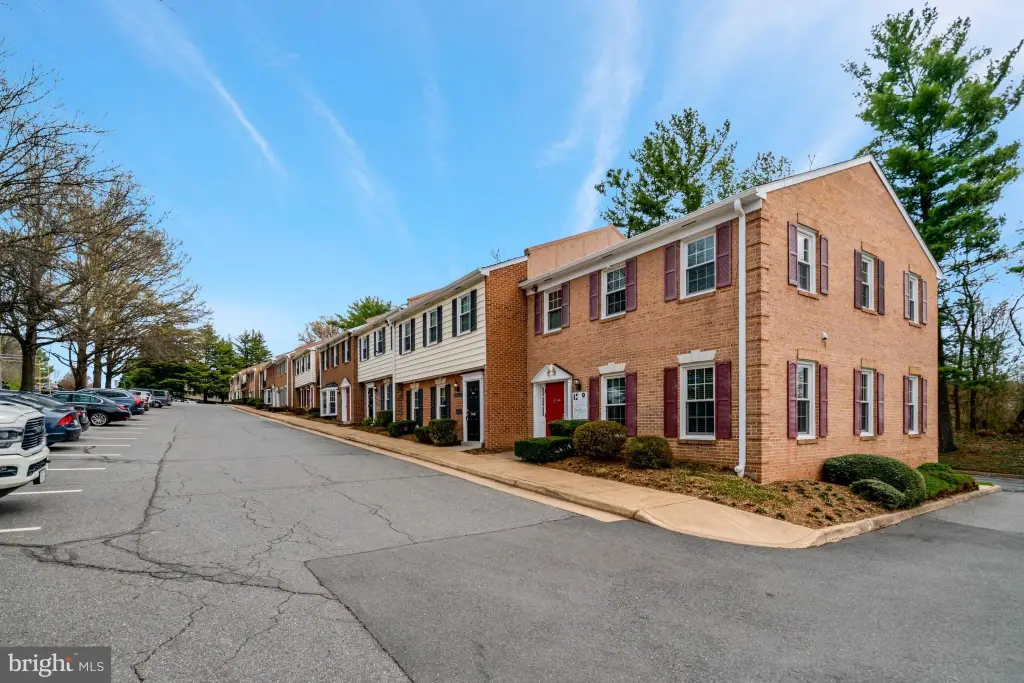
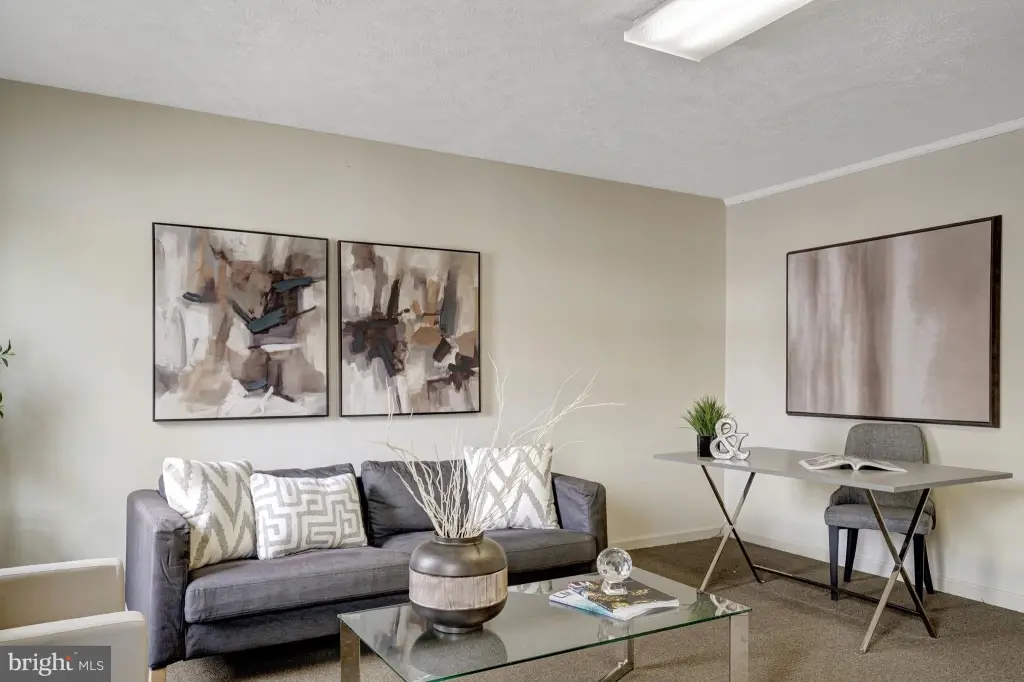
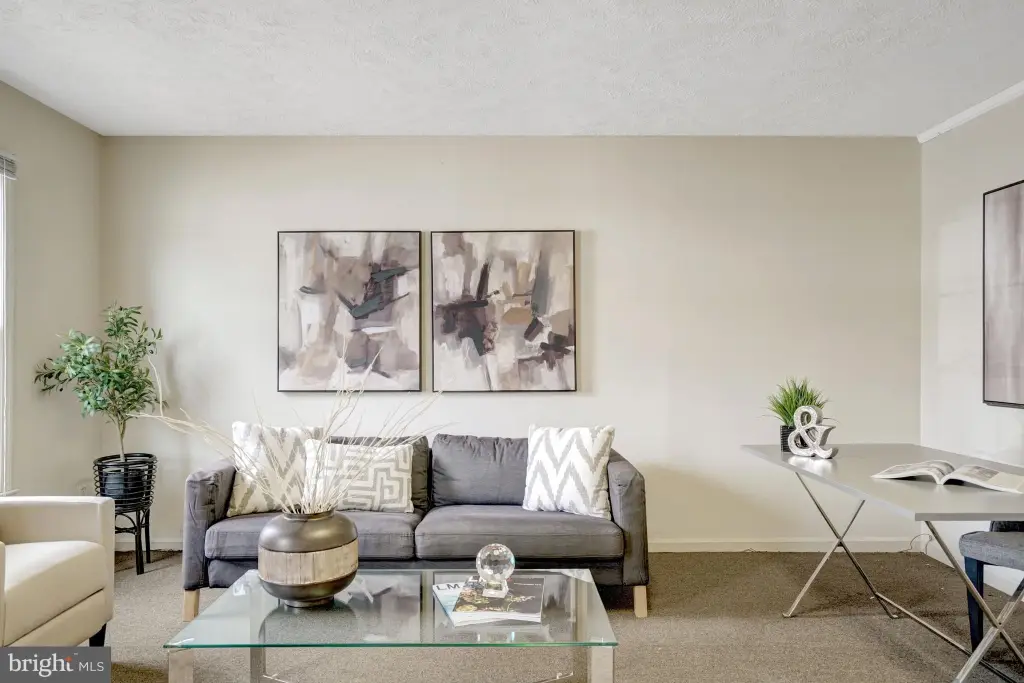
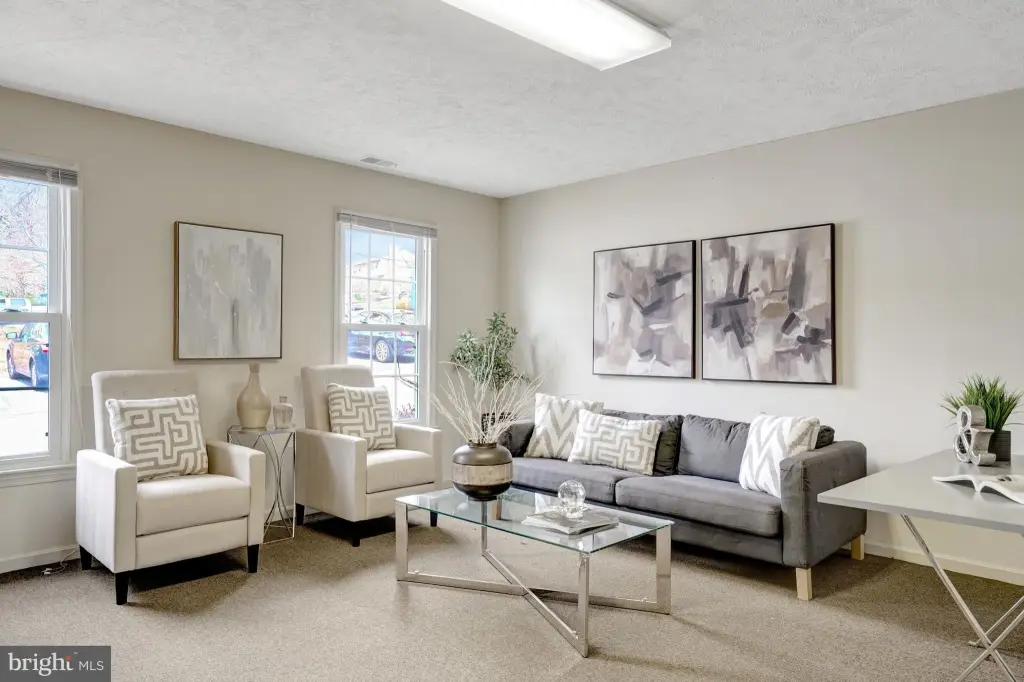
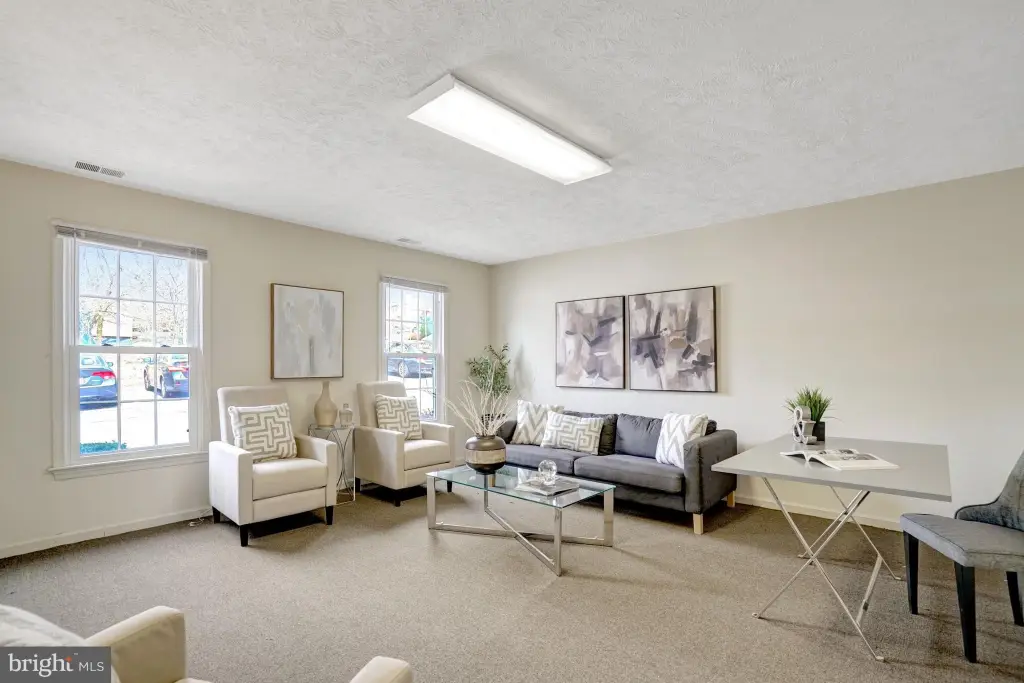
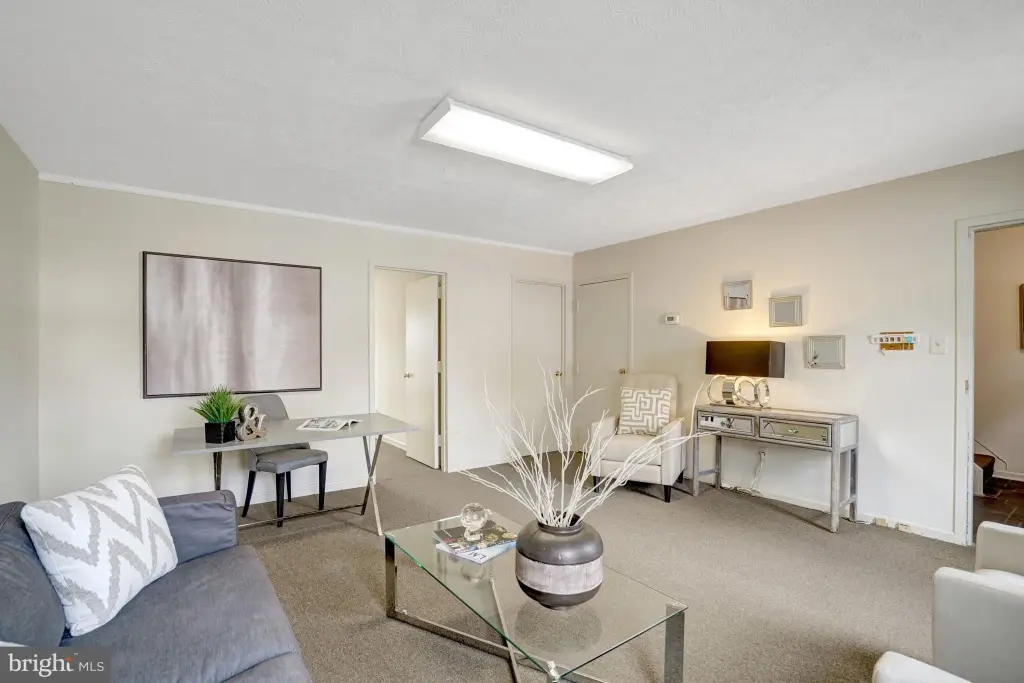
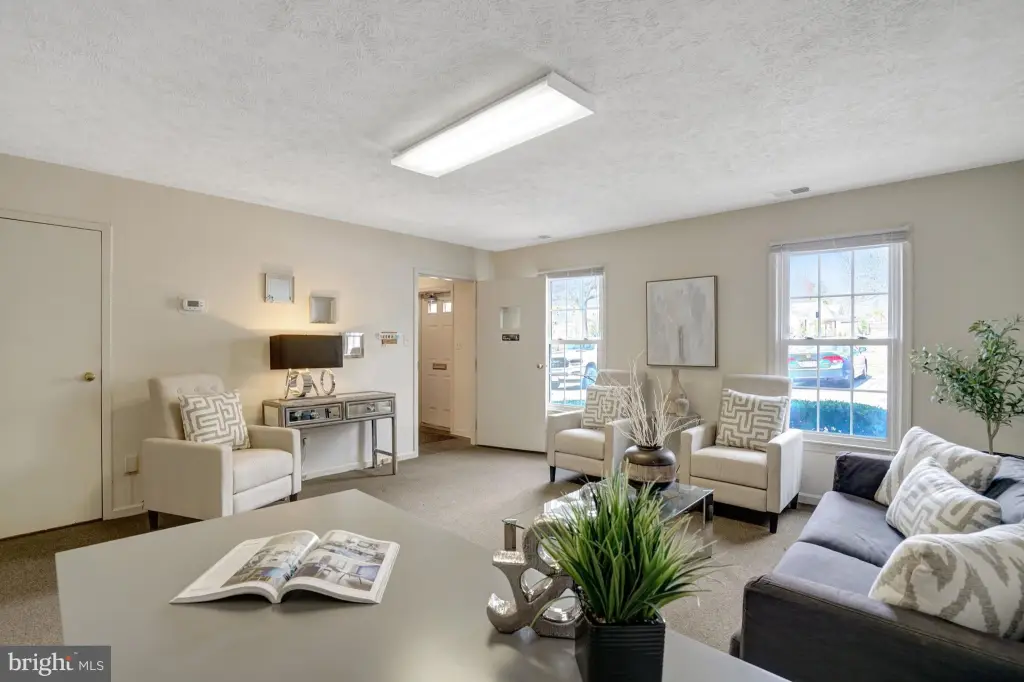
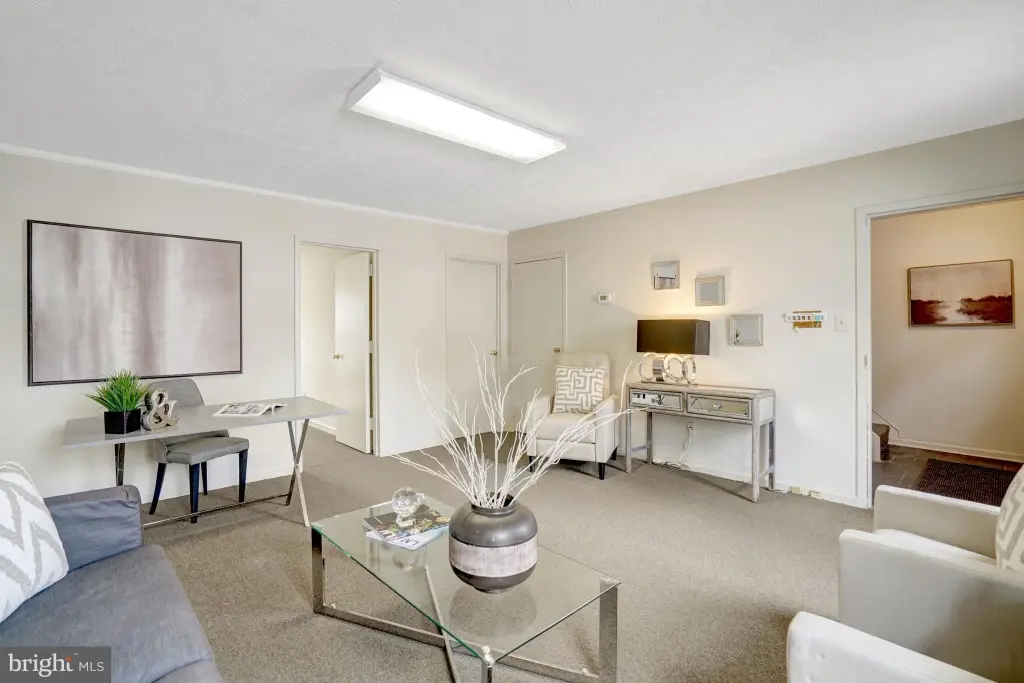
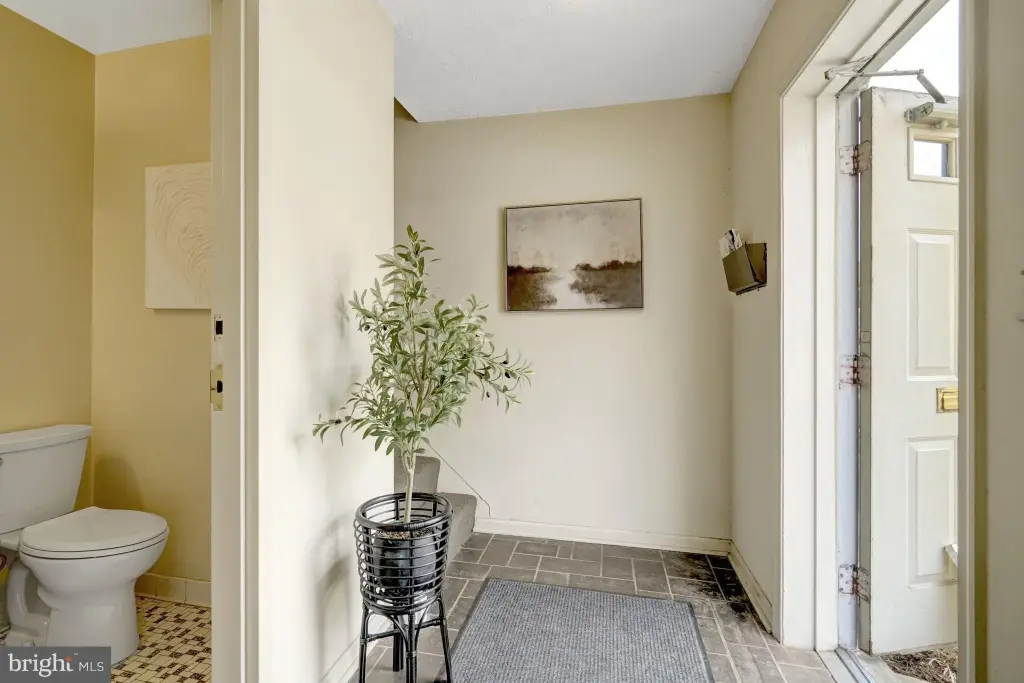
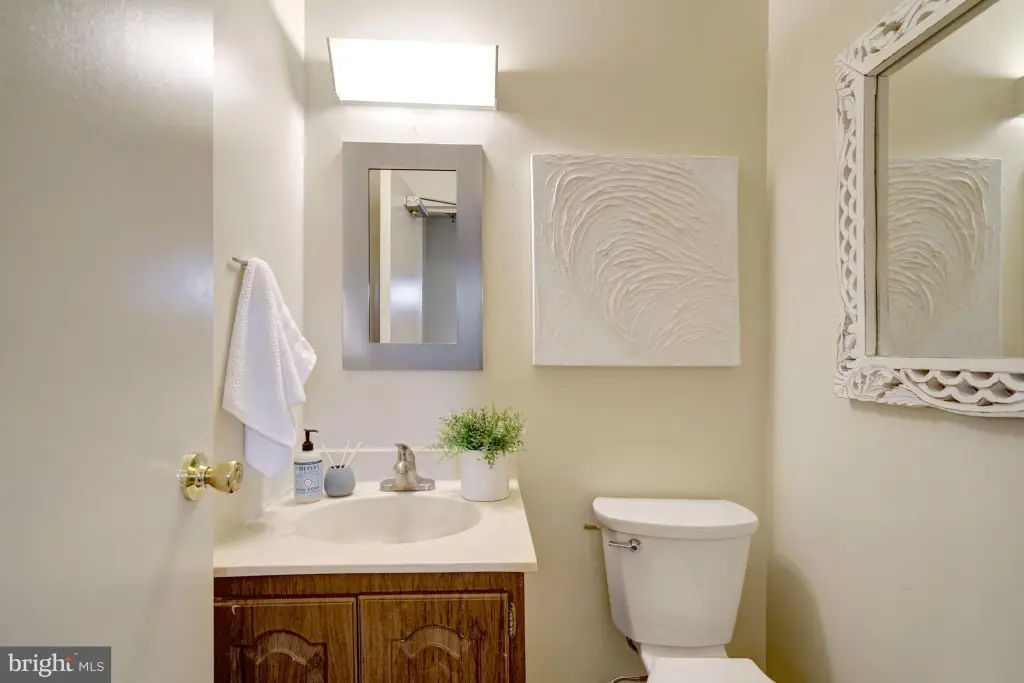
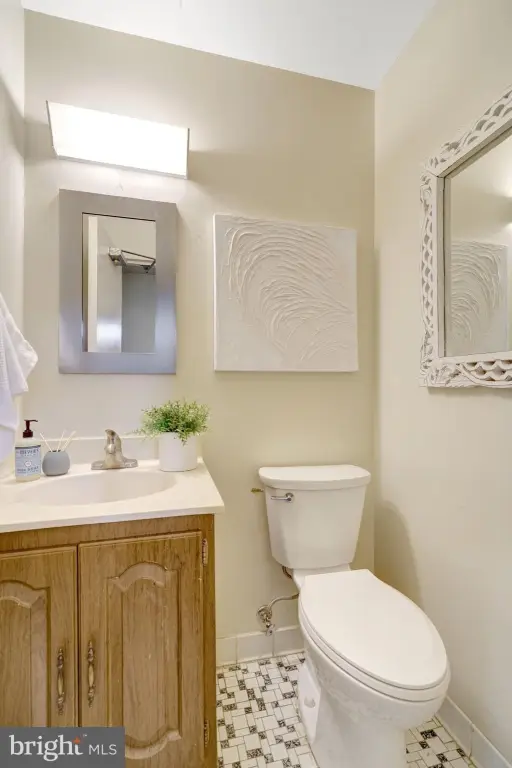
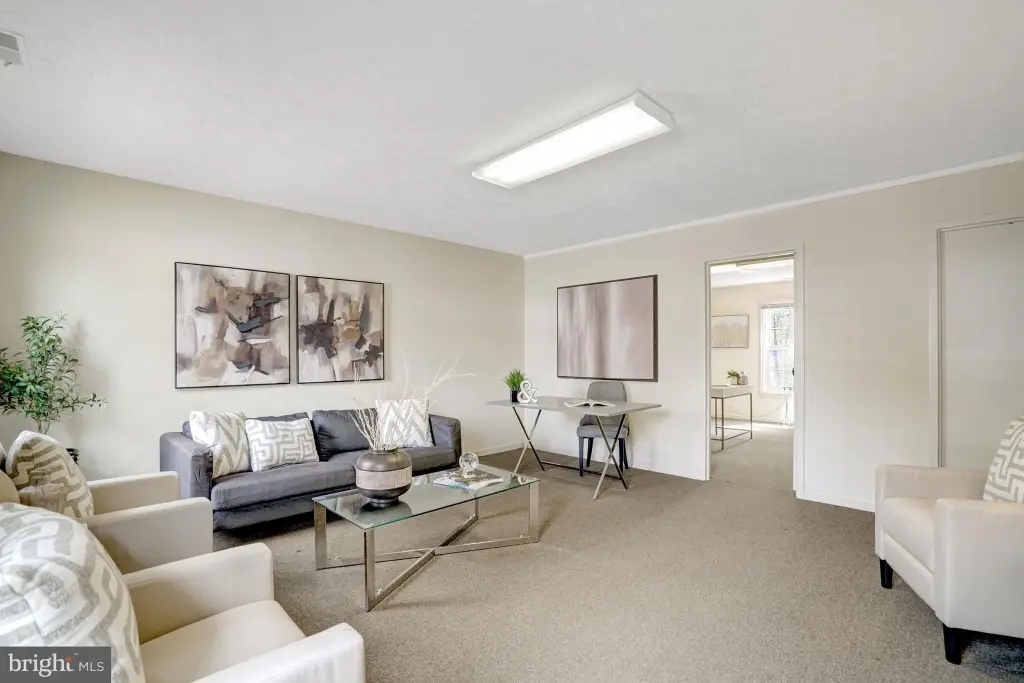
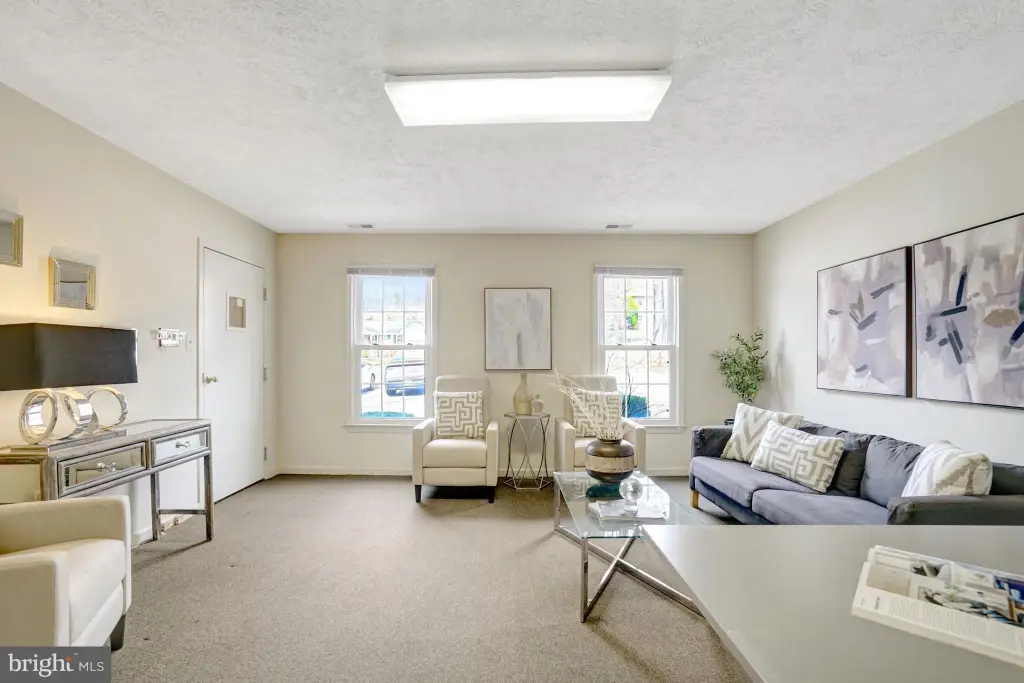
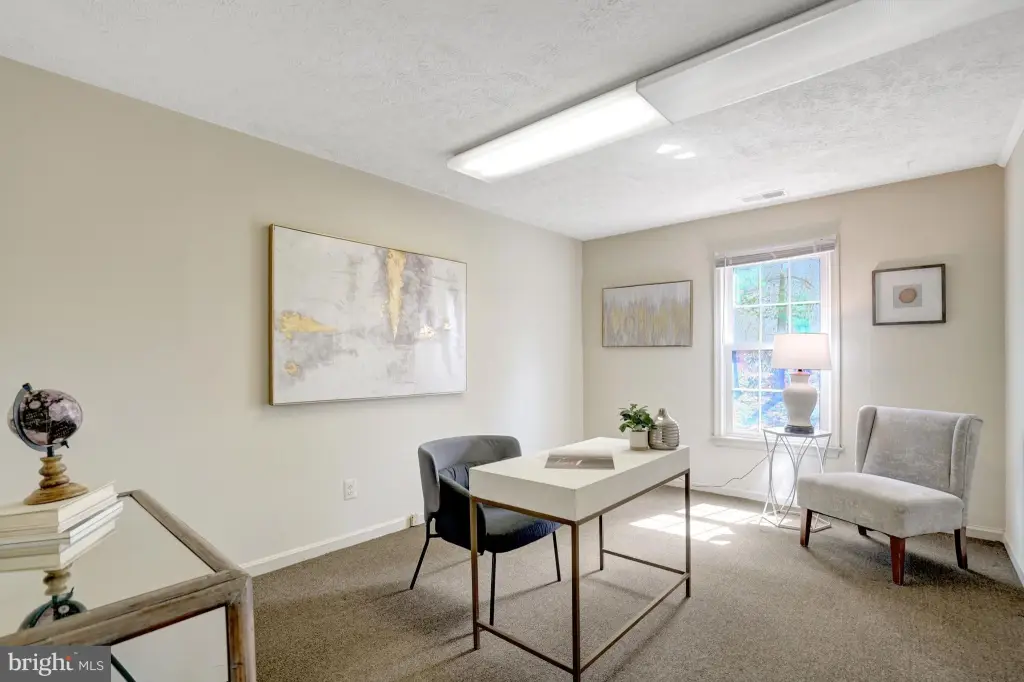
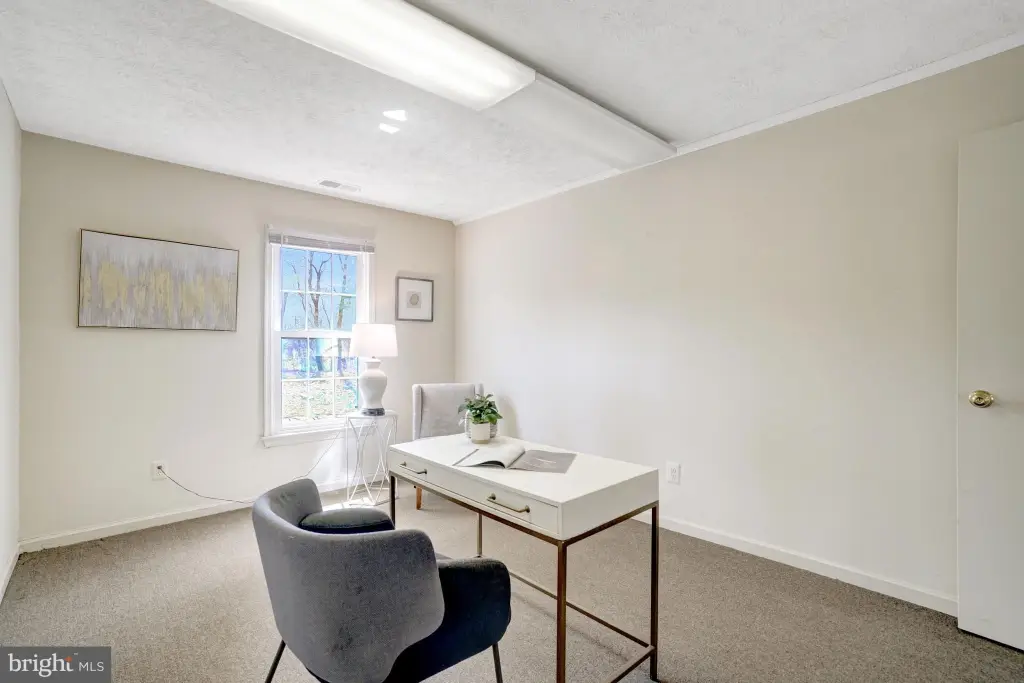
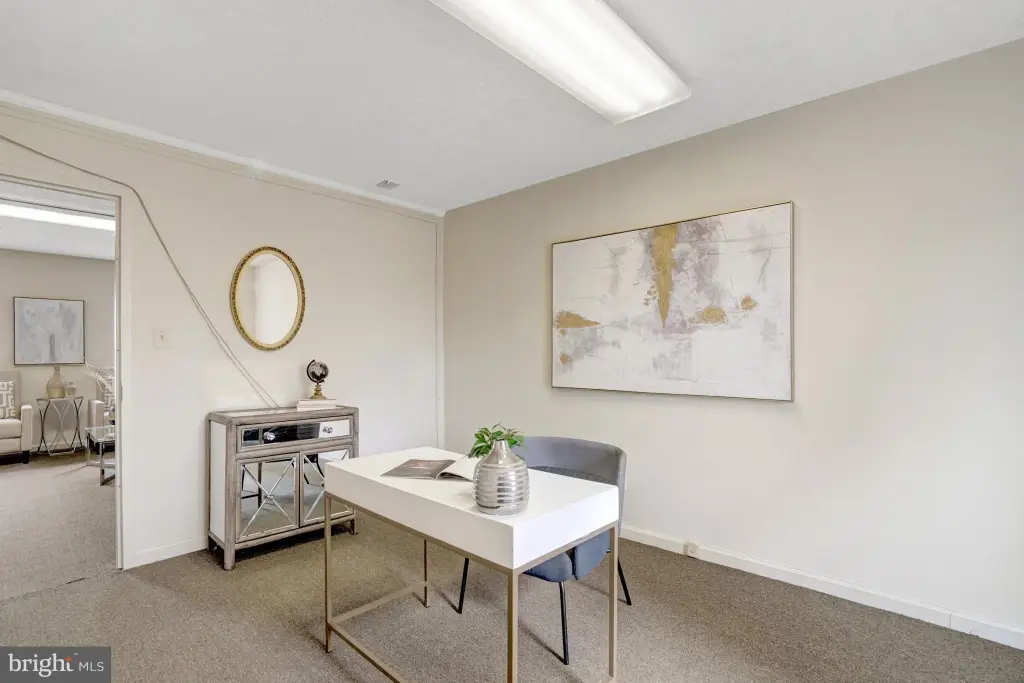
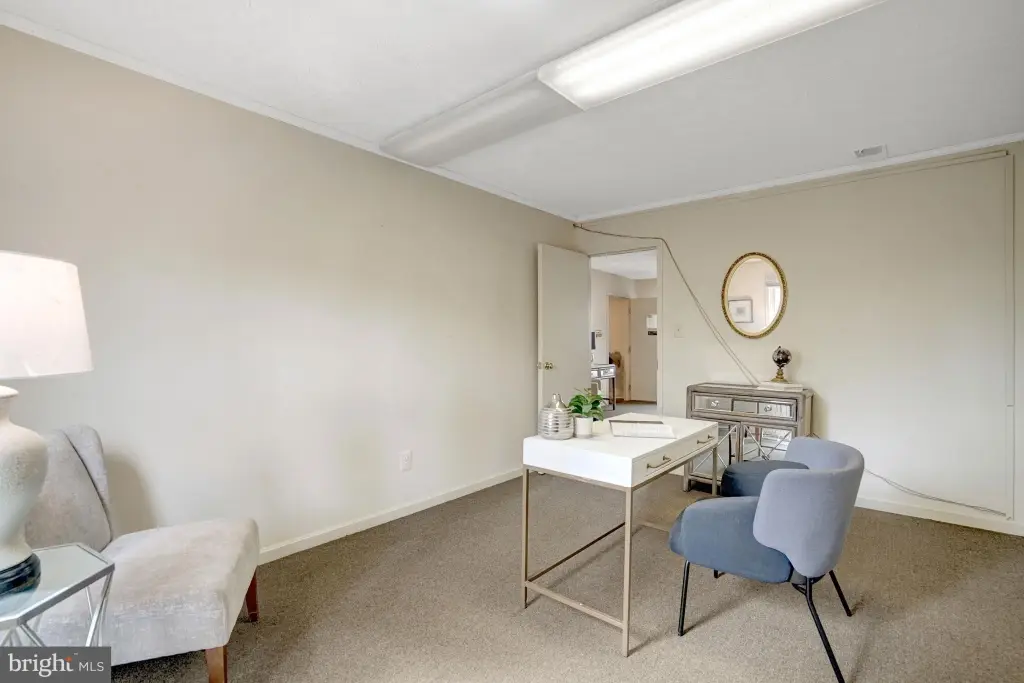
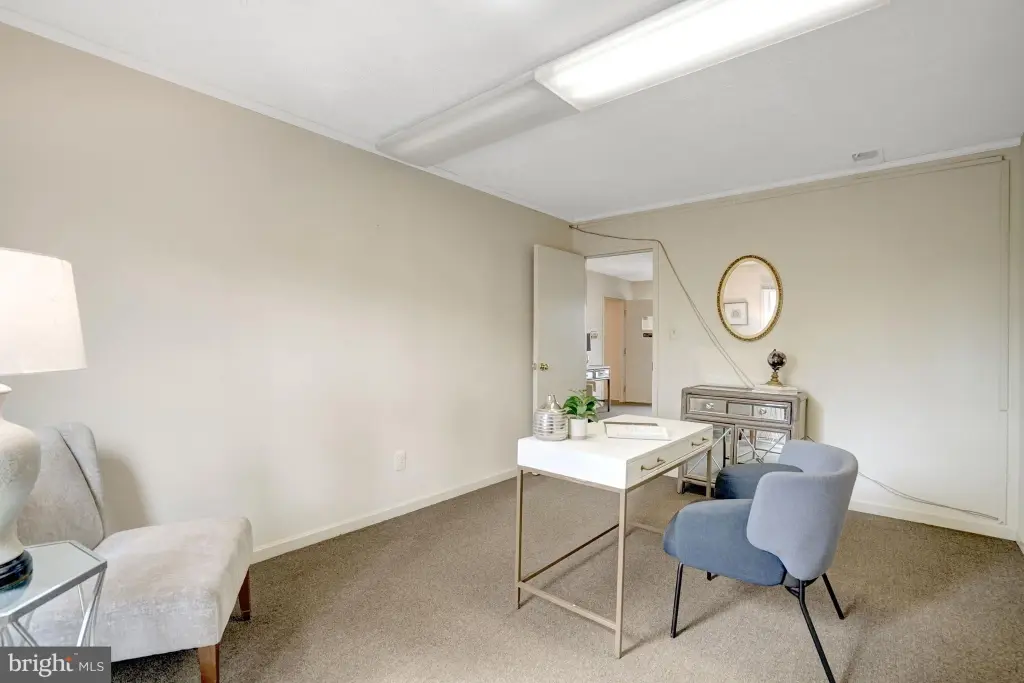
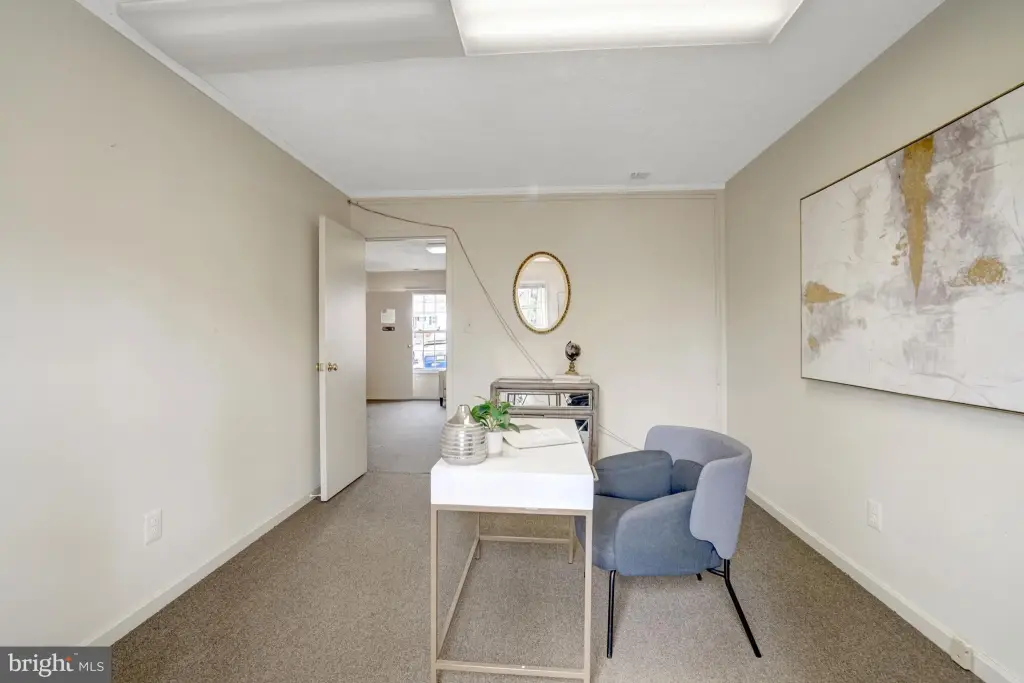
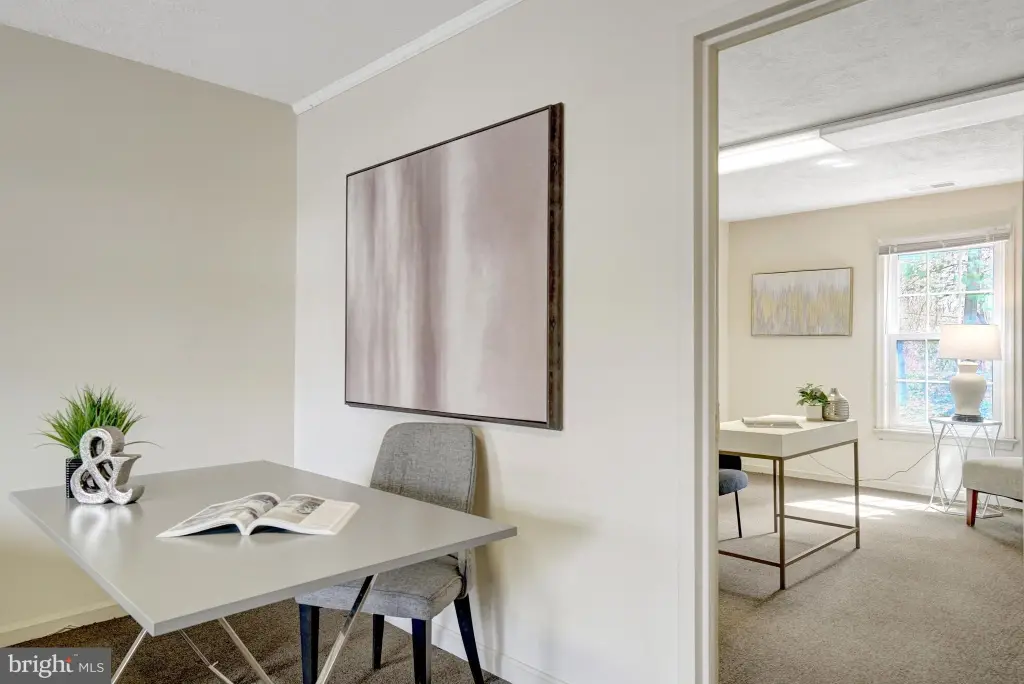
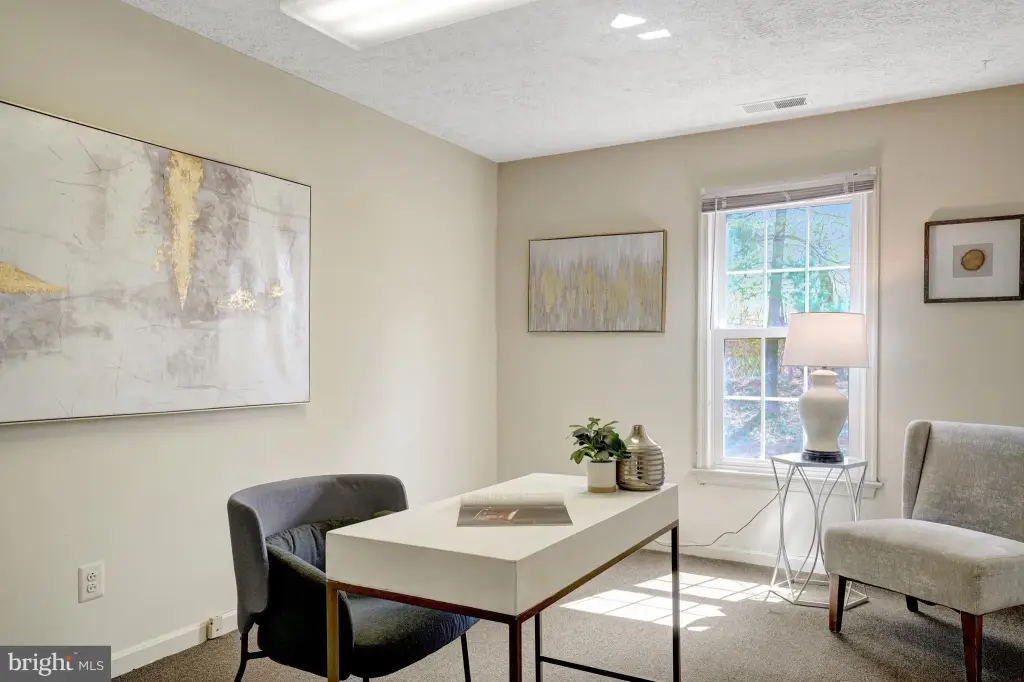
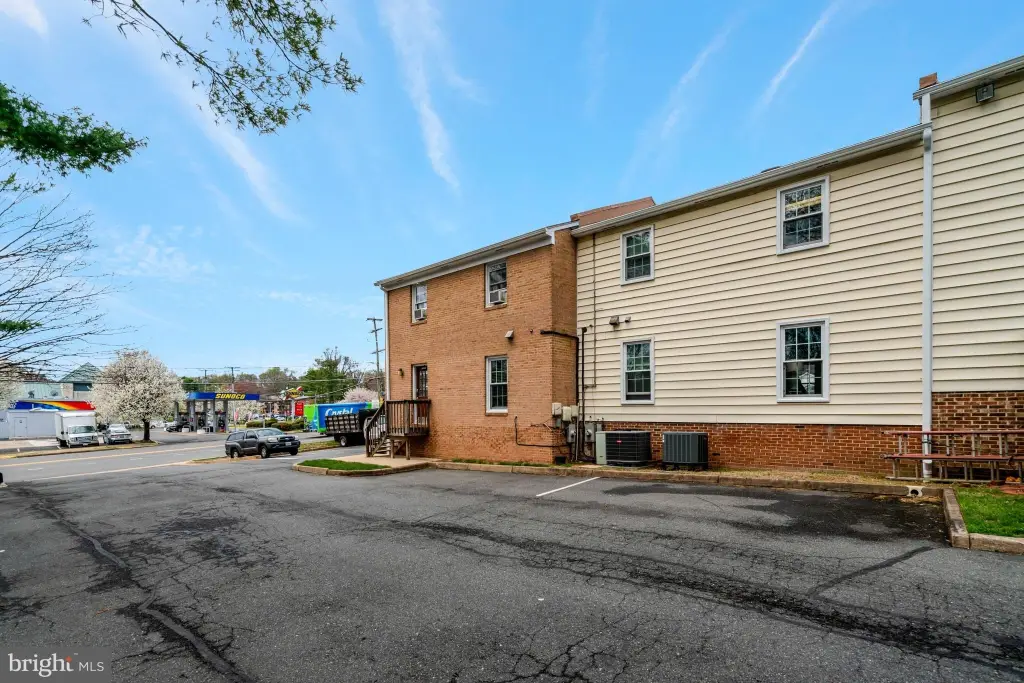
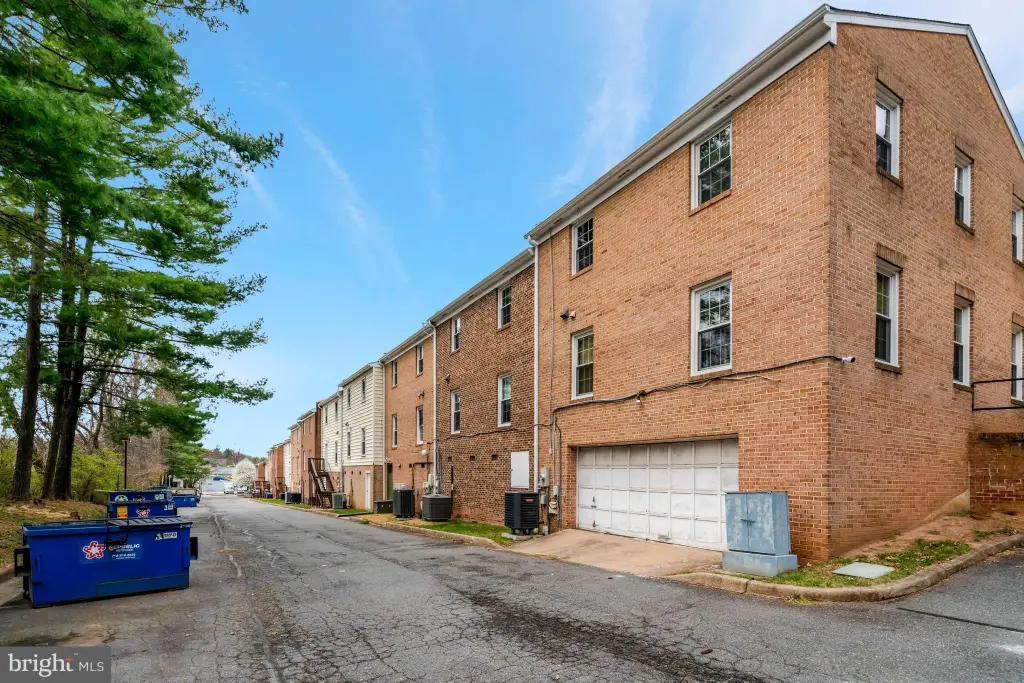
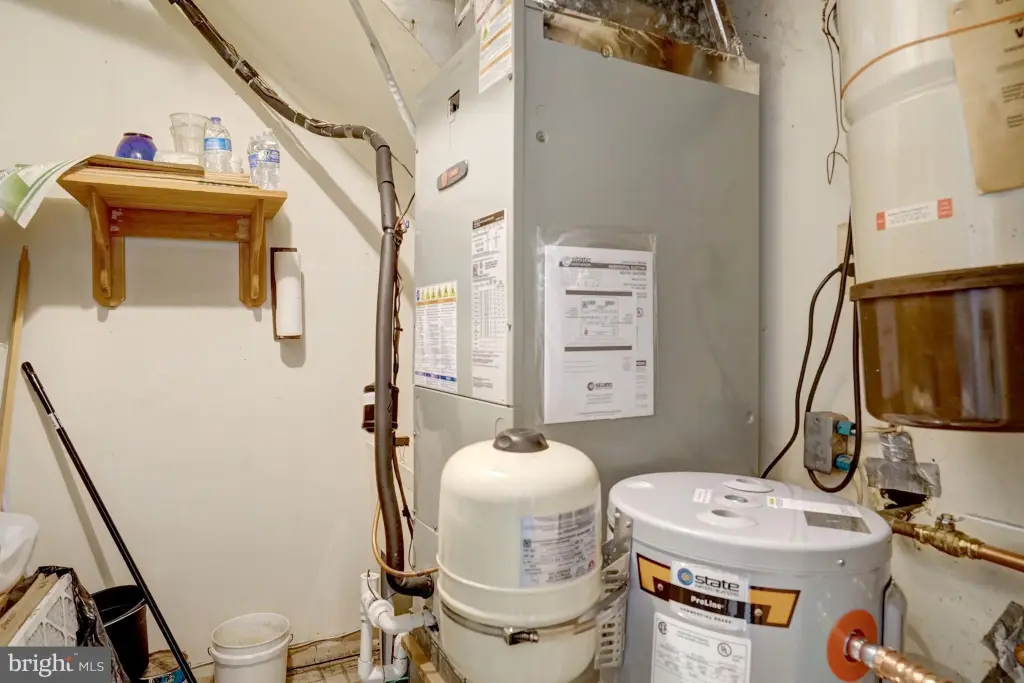
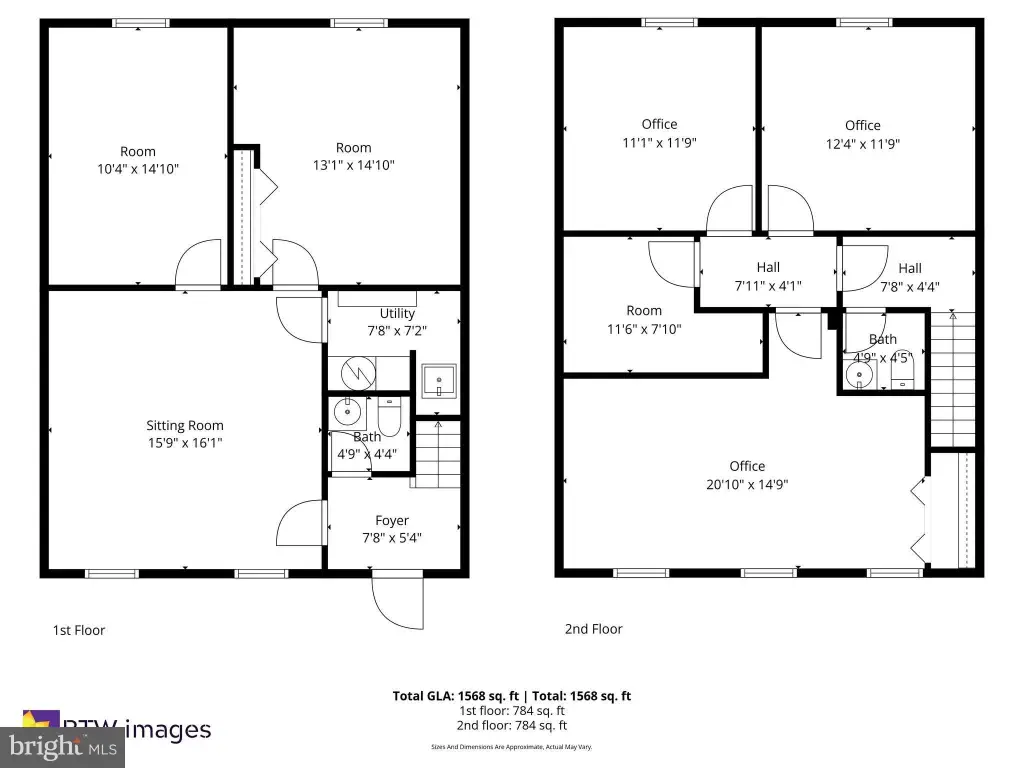
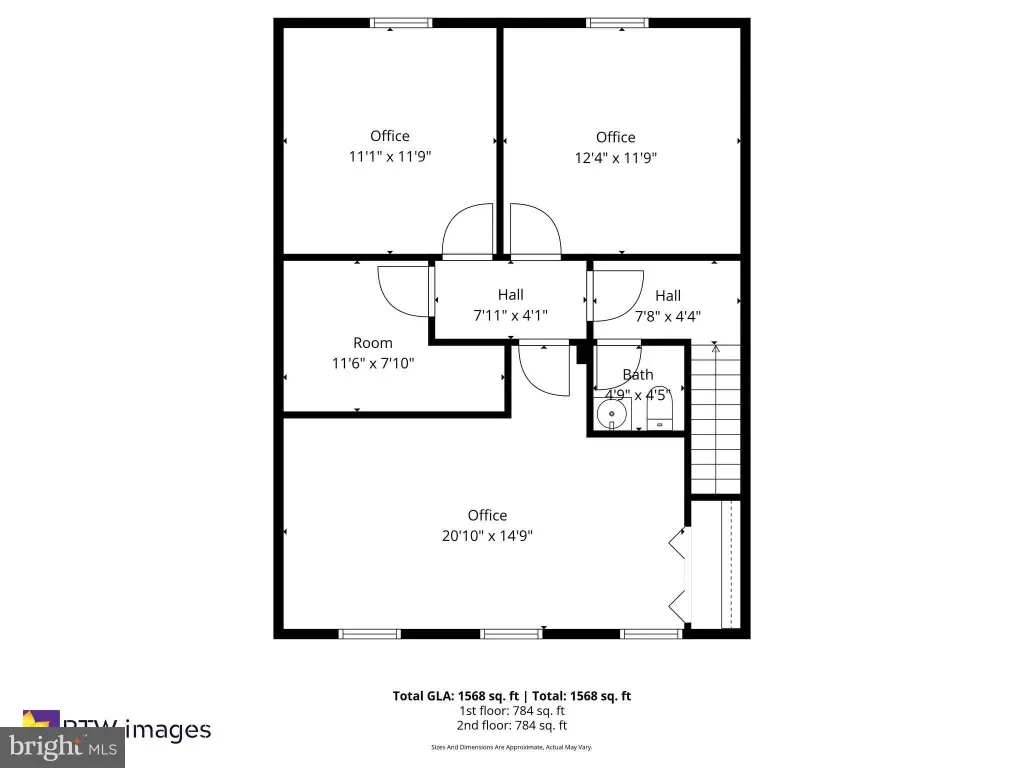
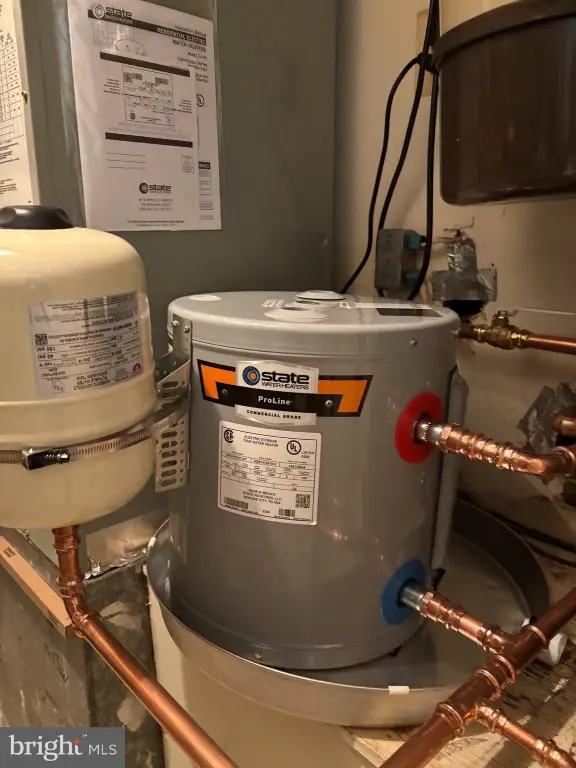
A federal-style townhouse configured for commercial use within a quiet 13-unit business park. The space is designed for flexibility, with two distinct private layouts across two floors and lockable rooms including offices and reception areas. Each floor includes a half bath, and the upstairs unit has separate stairs. The current configuration features a reception office space with production facilities upstairs. Neutral commercial carpeting is in place for heavy-traffic use, and the listing notes younger systems and appliances, with a hot water heater installed in March 2026. The property also provides room for a kitchen or kitchenette.
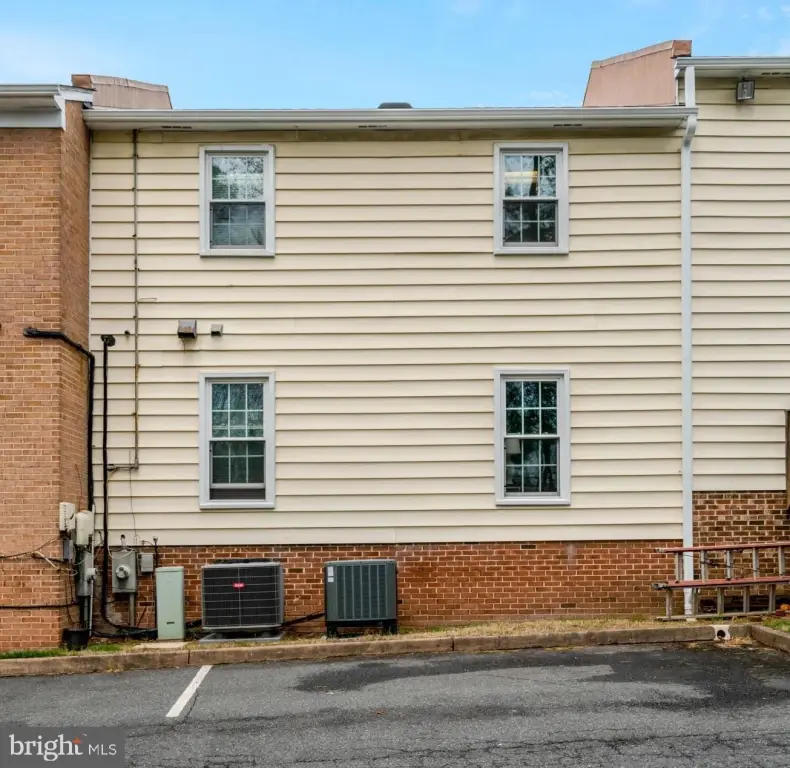
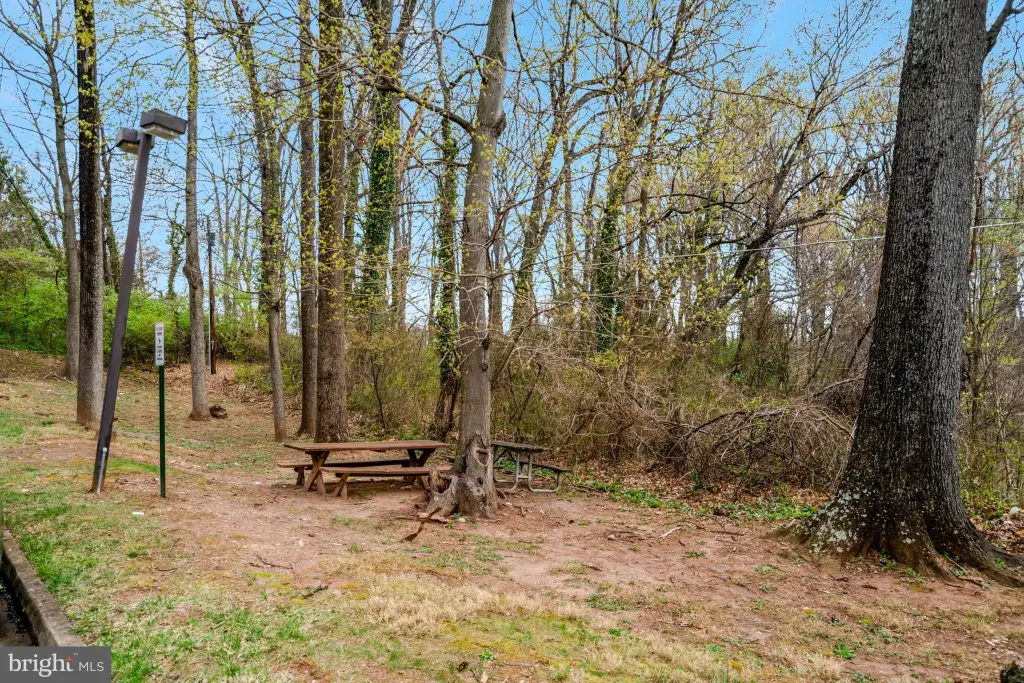
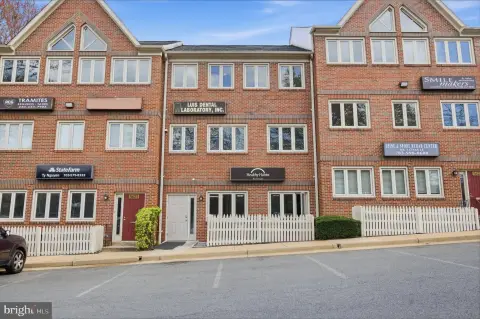
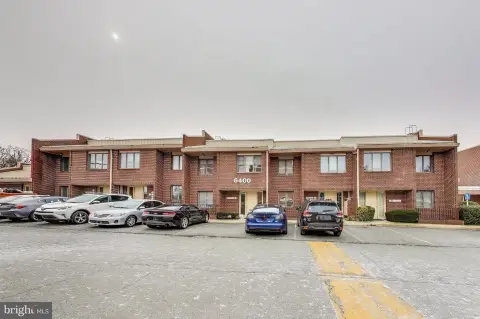
Located at the corner of Lee Highway and Graham Road on Route 29 in Falls Church, Virginia, the property is described as having convenient access to Metro and I-66 as well as downtown Falls Church. The complex is set in a park-like environment associated with the James Lee Conservation Area, with tree-lined views referenced from rear windows. Exterior maintenance is handled by the condo association, and the listing describes new windows and architectural roof work already provided for the community.
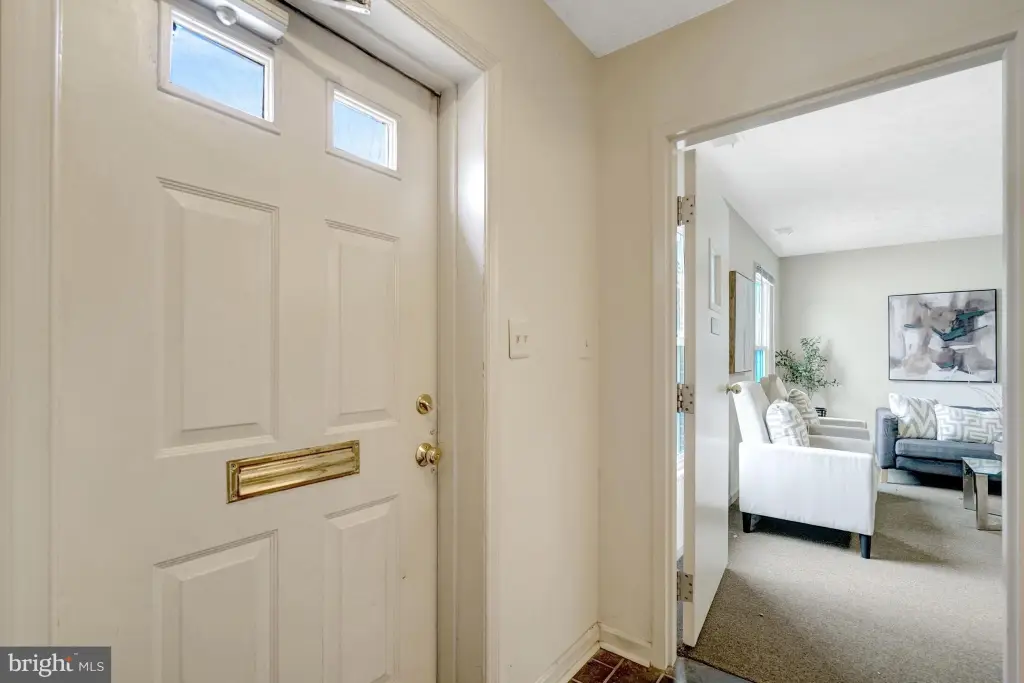
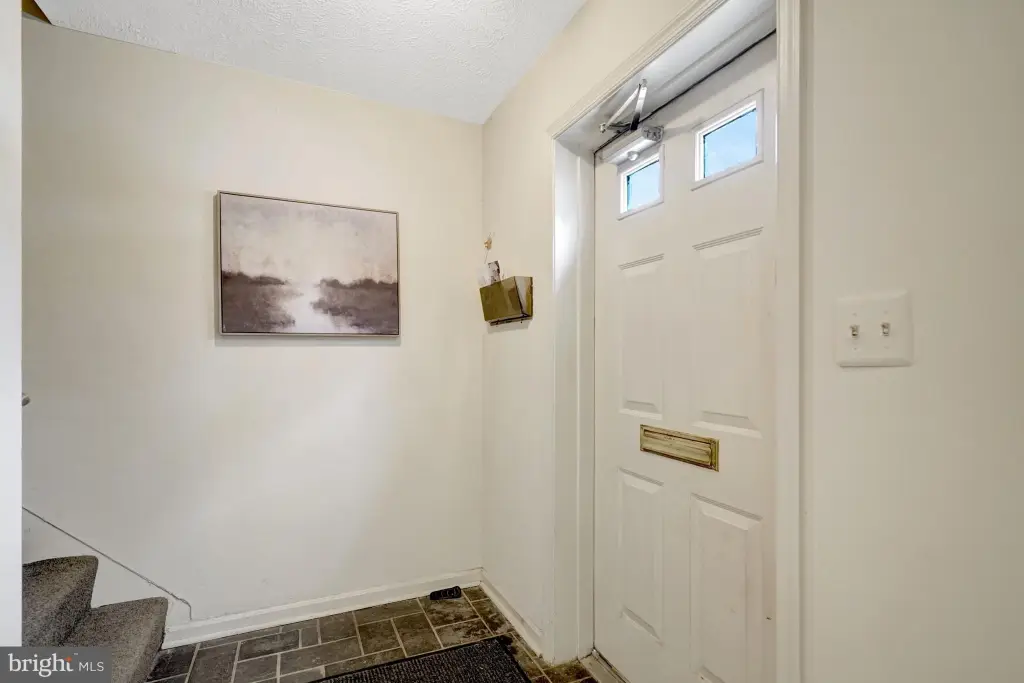
Zoned for various small businesses and professionals, the layout supports single or dual tenancy by operating as separate suites. Recent upgrades cited include brand-new plumbing fixtures, updated toilets, professional locksmith services, and new hardware and keys throughout office doors. This offering is positioned for professional offices that value self-contained rooms, coordinated building maintenance, and a smaller business-park environment.
Located at the corner of Lee Highway and Graham Road on Route 29 in Falls Church, Virginia, the property is described as having convenient access to Metro and I-66 as well as downtown Falls Church. The complex is set in a park-like environment associated with the James Lee Conservation Area, with tree-lined views referenced from rear windows. Exterior maintenance is handled by the condo association, and the listing describes new windows and architectural roof work already provided for the community.
Zoned for various small businesses and professionals, the layout supports single or dual tenancy by operating as separate suites. Recent upgrades cited include brand-new plumbing fixtures, updated toilets, professional locksmith services, and new hardware and keys throughout office doors. This offering is positioned for professional offices that value self-contained rooms, coordinated building maintenance, and a smaller business-park environment.
Key Highlights
- Federal‑style townhouse in a 13‑unit business park, zoned for commercial use; located at the corner of Lee Highway and Graham Road.
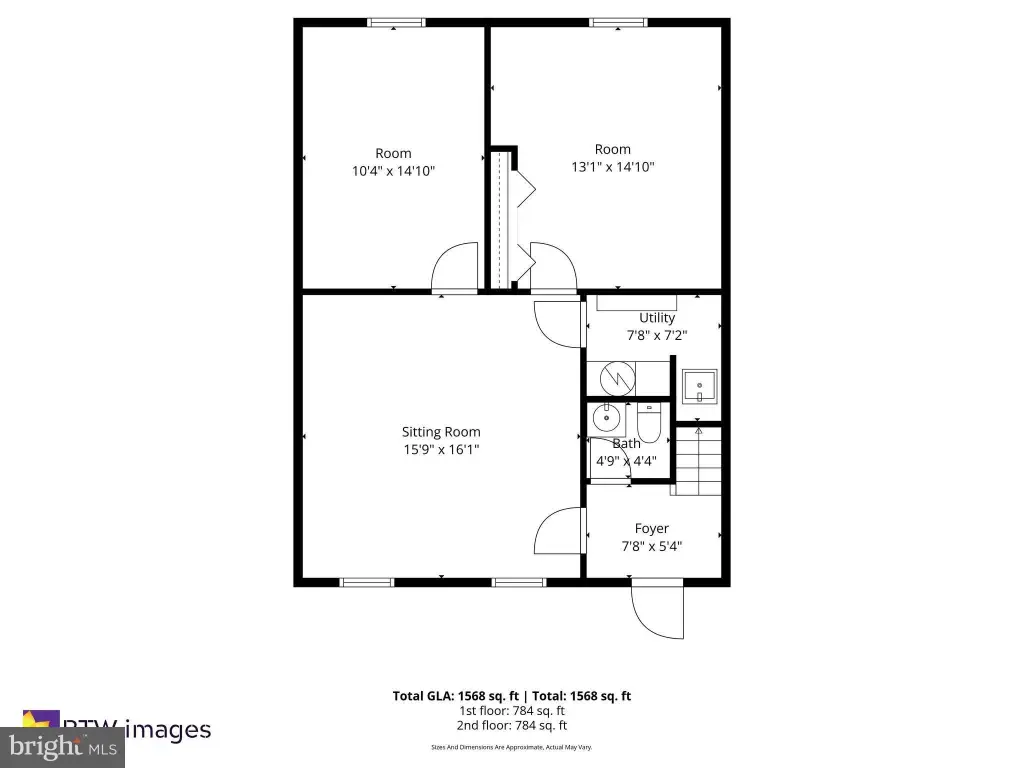
- Over 1,500 SF split into two 750 SF floors, with a half bath on each floor; upstairs has separate stairs.
- Flexible interior layout with subdivided, lockable office doors and reception areas; currently configured as reception offices with upstairs production facilities.
Financial Insights For Office B
Simulate Cap Rate and NOI
NOI Build-Up
- Vacancy
- income lost from leasable area expected to sit empty during the year — subtracted from gross rent.
- EGI (Effective Gross Income)
- gross rent minus vacancy losses — the realistic income before paying operating costs.
- OpEx (Operating Expenses)
- recurring costs to operate the property (property tax, insurance, utilities, maintenance, management) — excludes financing and capital improvements.
- NOI (Net Operating Income)
- income a property generates after operating costs but before financing and taxes.
| Component | $ | $/SF |
|---|---|---|
| Gross rent | $44.3k | $29.52 |
| − Vacancy | −$6.4k | −$4.28 |
| EGI | $37.9k | $25.24 |
| − OpEx | −$9.5k | −$6.31 |
| NOI | $28.4k | $18.93 |
1,500 SF · lease $29.52/SF/yr · vacancy 14.50% · expense 25.00%
Alternative Uses
Best Use
Office B
$405.6K
$354.9K – $473.3K
NOI $28,395 @ 7.0% cap · market cap 4.98%
Second Best
—
—
no second resolved use
Theoretical Best
Specialty Retail
$6.29M
$5.50M – $7.34M
NOI $440,134 @ 7.0% cap · market cap 77.22%
Zoning and permitted uses should be independently verified with authorities.
Property Analytics
Property Profile
Location Intelligence
Current Use




Frequently Asked Questions
What type of property is this?
Office units - Two-level office setup in a 13-unit business park, offering flexible single or dual tenancy with lockable private rooms.
Where is this office units located?
The property is located at 7297 ROUTE 29 Falls Church, VA.
What is the asking price?
The asking price for this property is $570,000.
What are key features of this property?
This property features: Federal‑style townhouse in a 13‑unit business park, zoned for commercial use; located at the corner of Lee Highway and Graham Road.; Over 1,500 SF split into two 750 SF floors, with a half bath on each floor; upstairs has separate stairs.; Flexible interior layout with subdivided, lockable office doors and reception areas; currently configured as reception offices with upstairs production facilities.