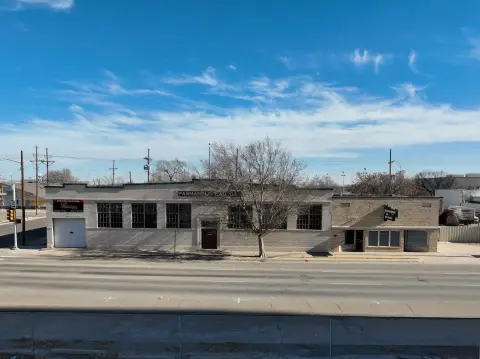
Two-Building Strip
For Sale
$2,500,000
Pending
6103 S COULTER Street, Amarillo, TX 79119
Commercial Sale, Amarillo, TX
Property Size10,402 SF
Lot Size1.17 Acres
Days on Market183
Property Features for 6103 S COULTER Street
General Information
Property type
Commercial Sale
Property subtype
Other
Zoning description
0200 - SW Amarillo in City Limits
Directions
I-40 and Coulter, Travel south on Coulter going past the Hillside intersection, Property will be on the left.
Subdivision
0231 - Southpark/Windsor
Standard status
Pending
APN
218109
Size
10,402 SF
Lot size
1.17 Acres
Taxes and HOA fees
Tax Description
SOUTH PARK # 2, BLK 0022, S PTN OF 13 BEG AT SW COR OF LOT 13, 1.1700 ACRES
Legal Description
SOUTH PARK # 2, BLK 0022, S PTN OF 13 BEG AT SW COR OF LOT 13, 1.1700 ACRES
Utilities
Cooling system
Electric
Amenities
individually metered utilities
Building Details
Year built
2015
Roof type
Metal
Listing Agency:
Keller Williams Realty Amarillo
(806) 359-4000
Listed By:
Bobby Tyler
(806) 676-7709
Added: Apr 23
Changed: Oct 21
Last Checked: Oct 22 at 6:06PM
MLS# 26-1925
Copyright © 2026 Amarillo Association of REALTORS. All rights reserved. All information provided by the listing agent/broker is deemed reliable but is not guaranteed and should be independently verified.

Ask AI about this property
Review the available facts, identify missing information and prepare questions for the agent.
Investment Insights
Based on property information with market context.
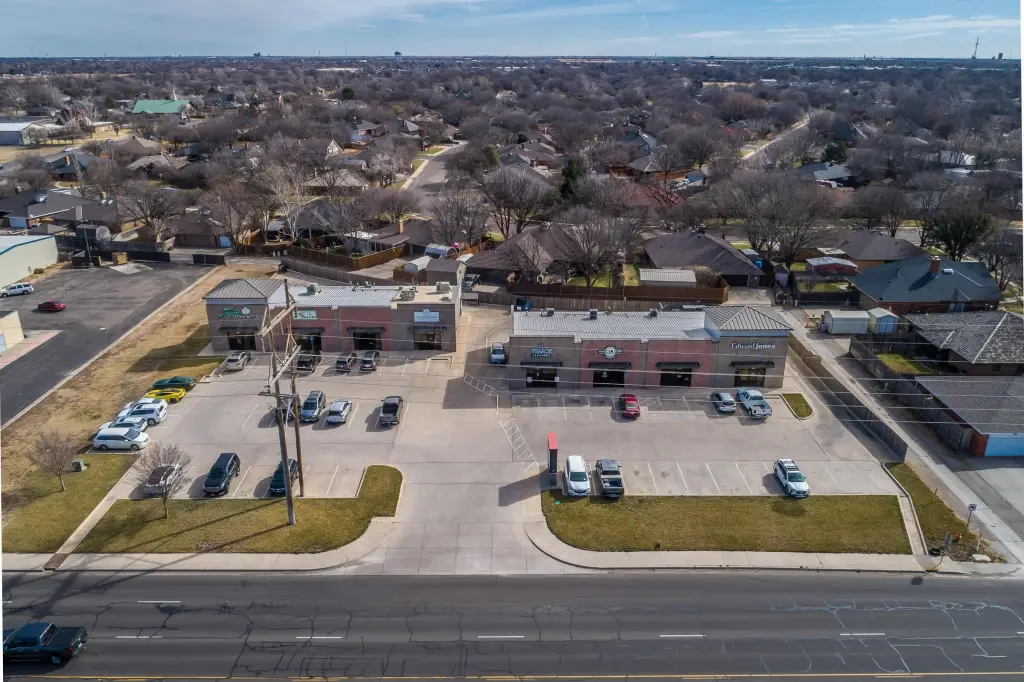
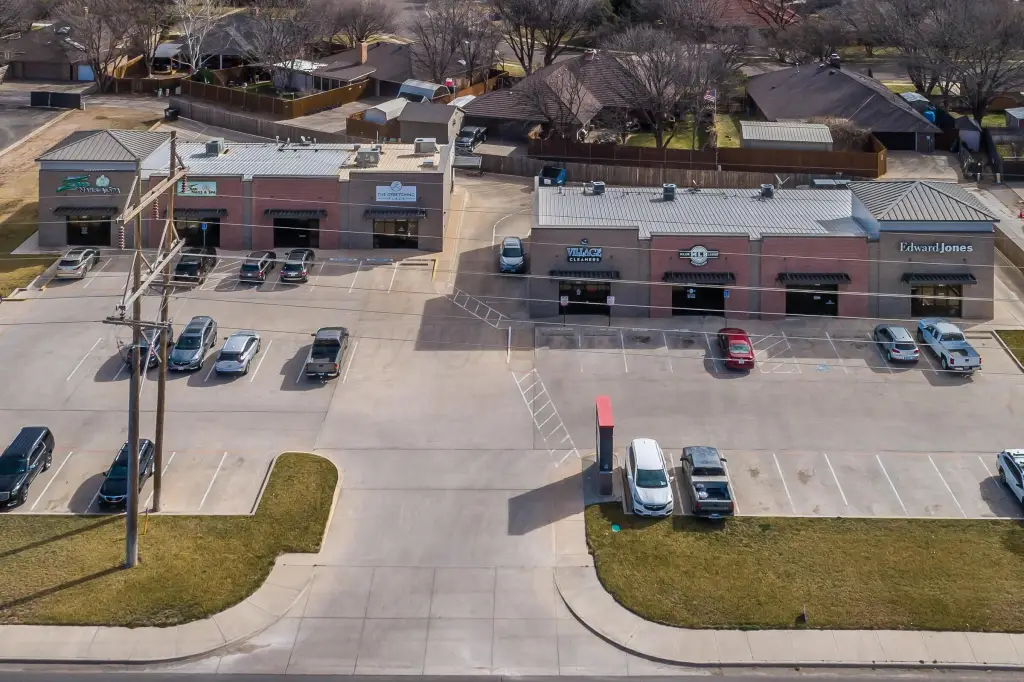
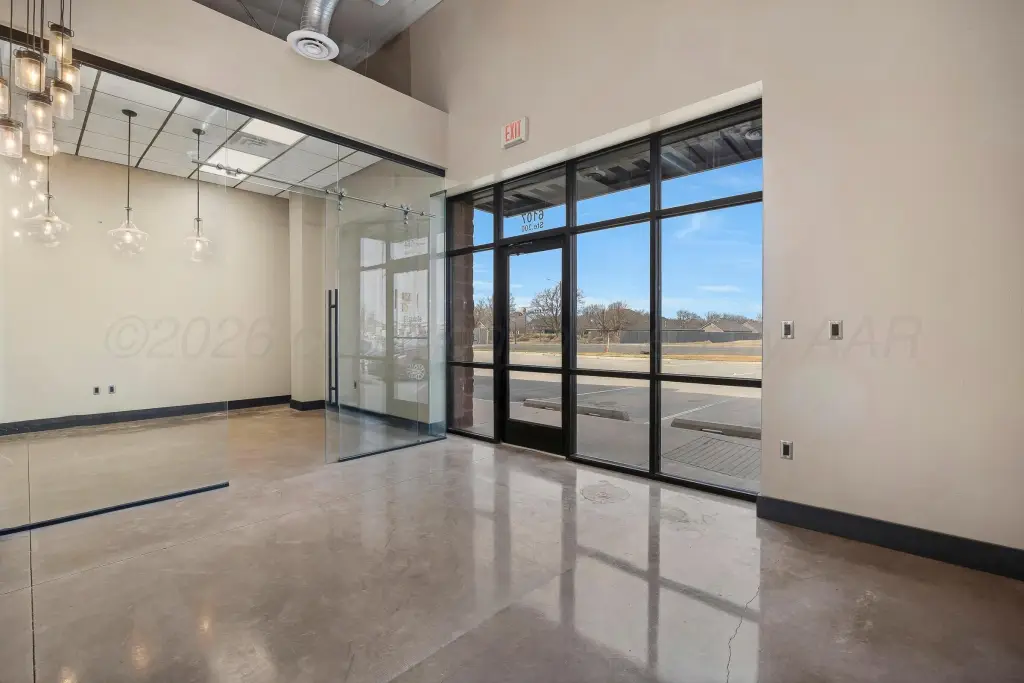
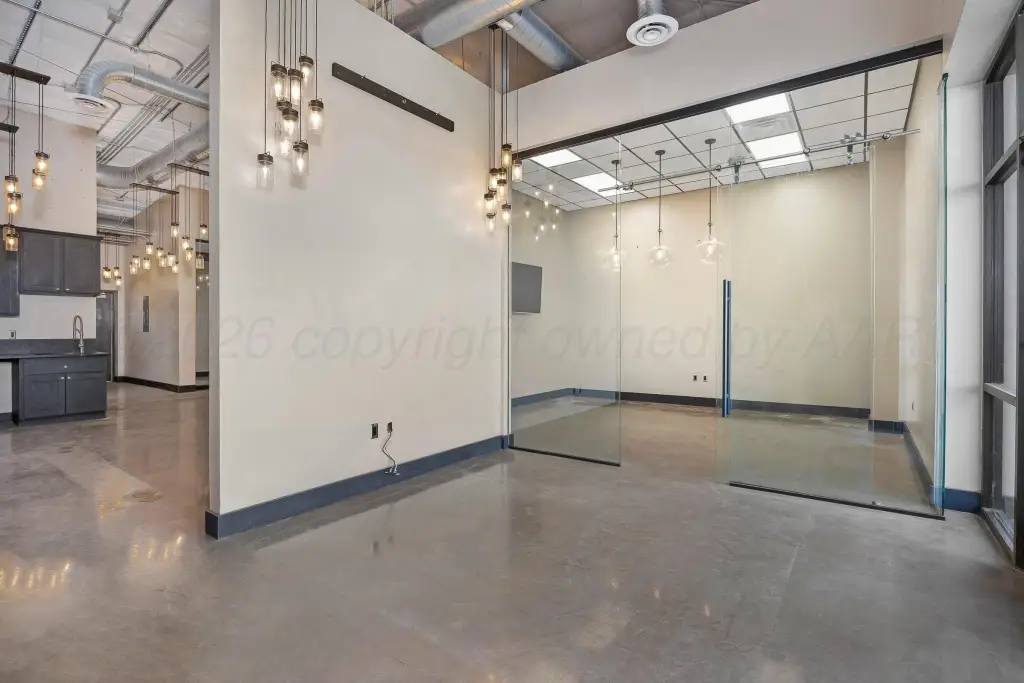
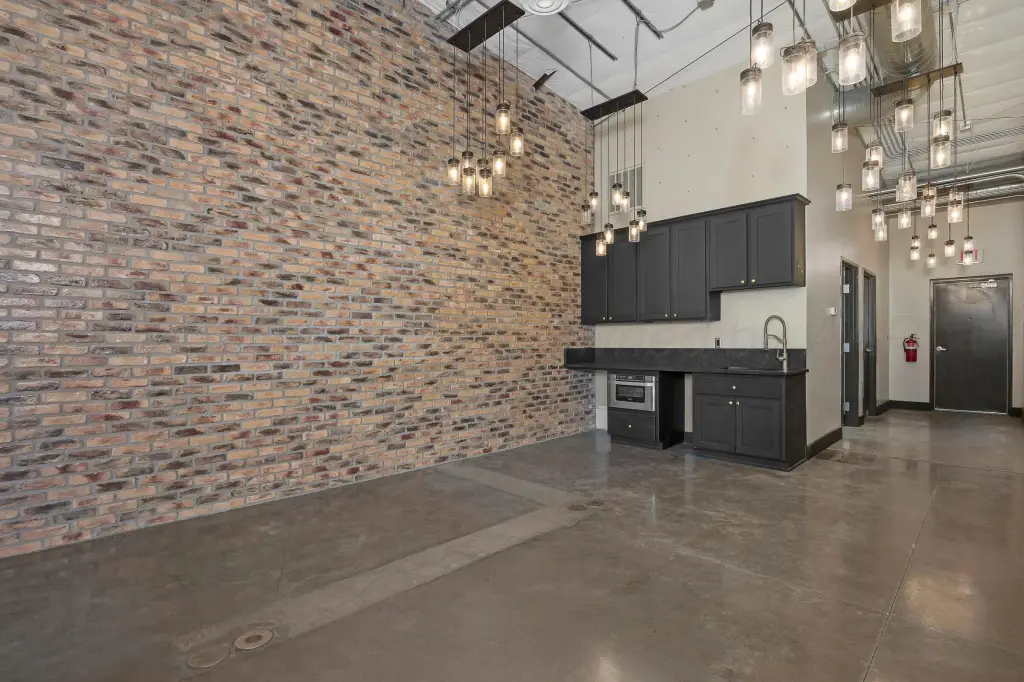
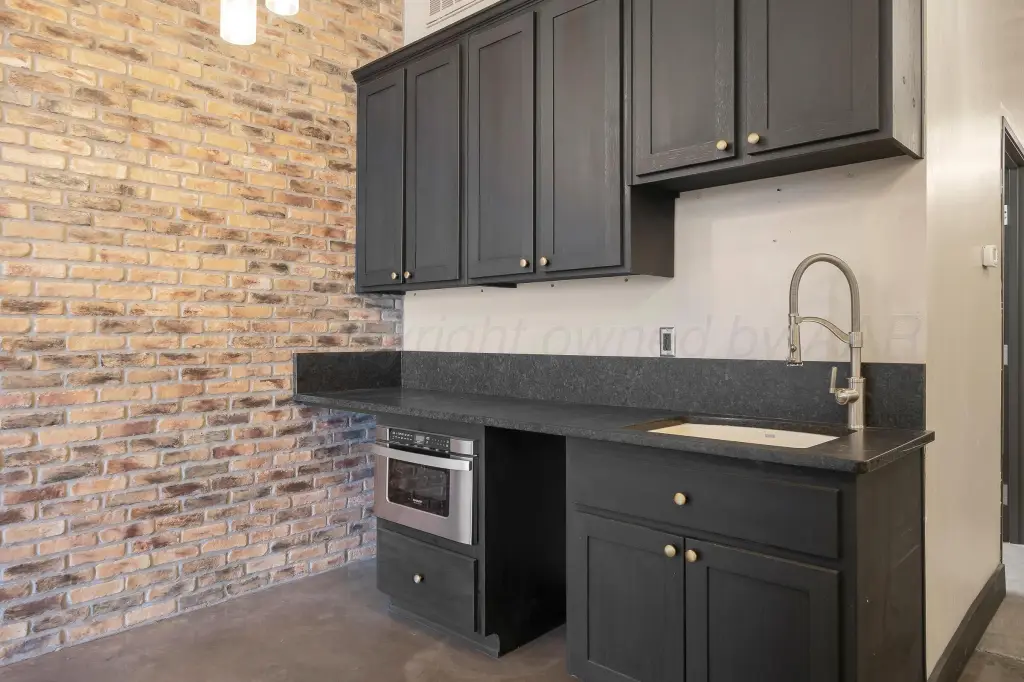
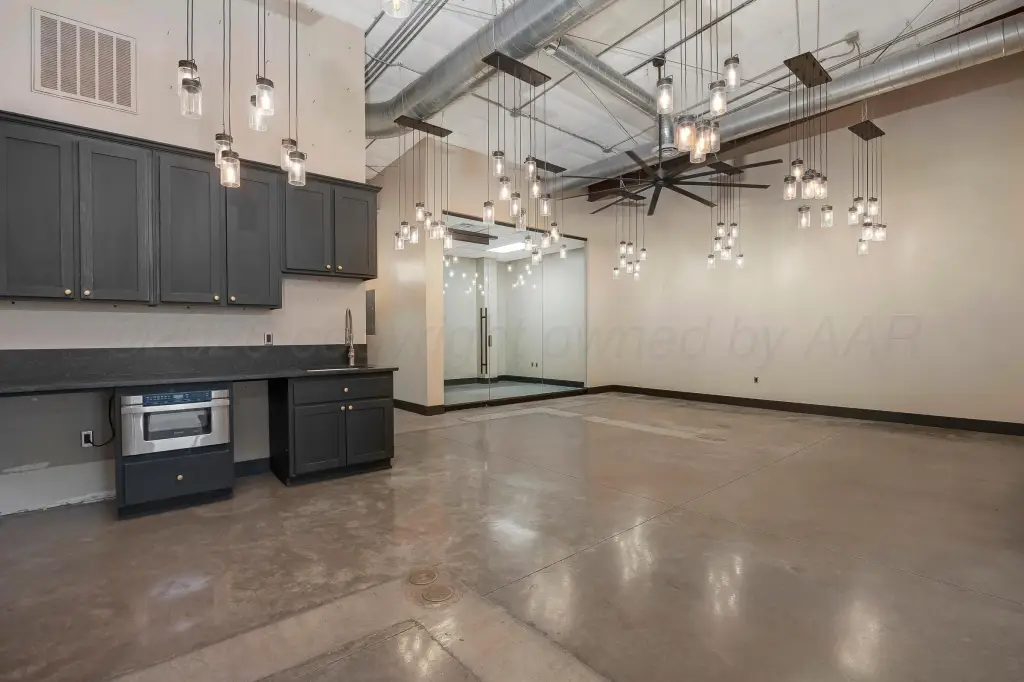
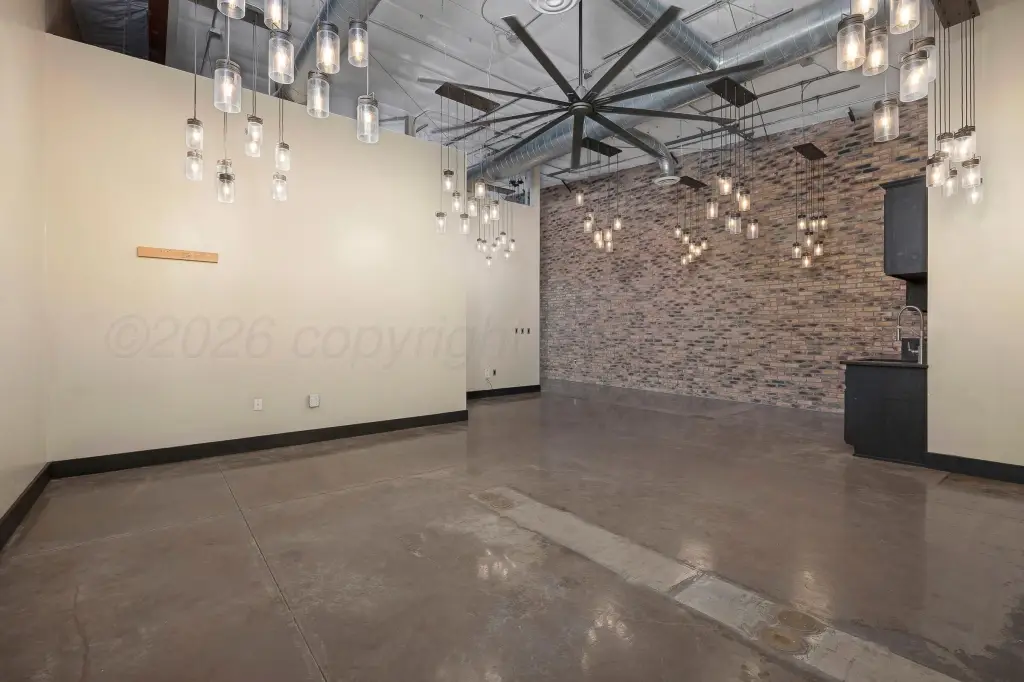
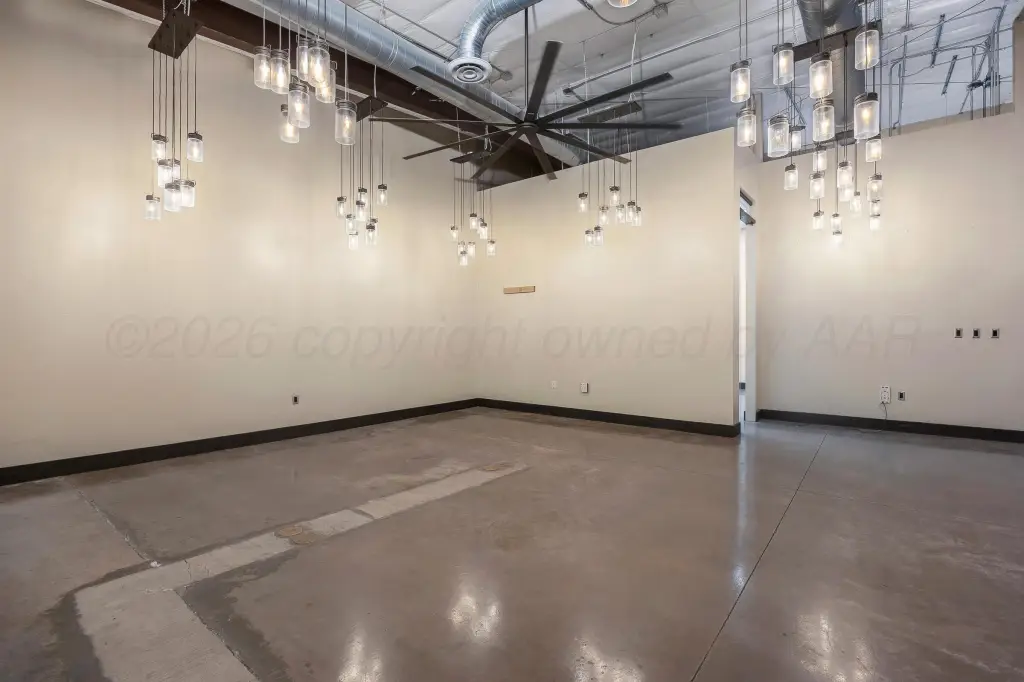
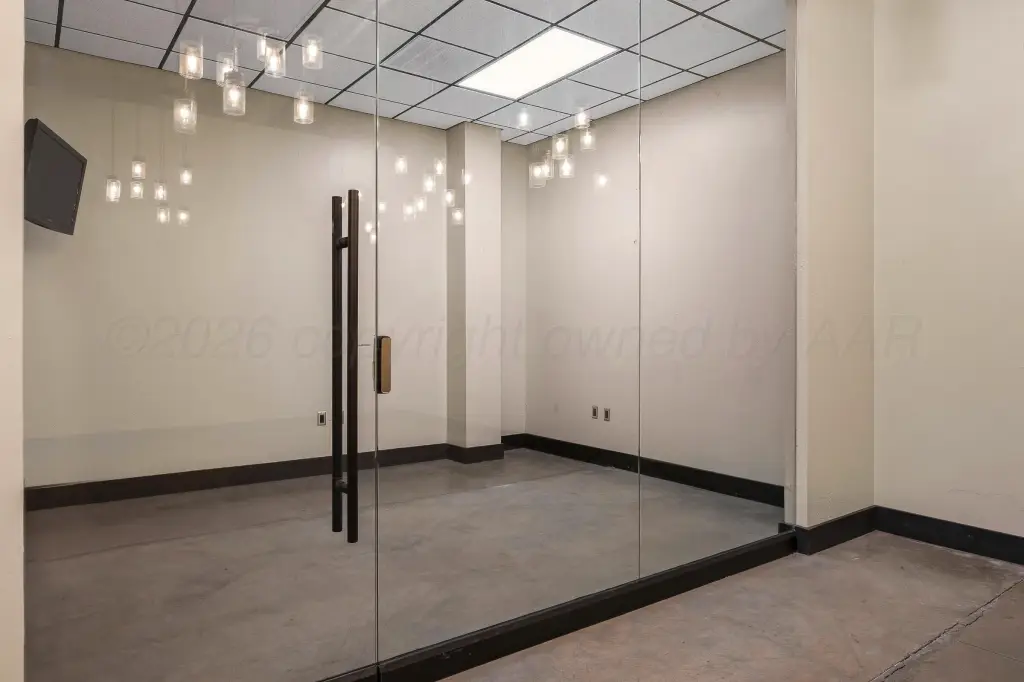
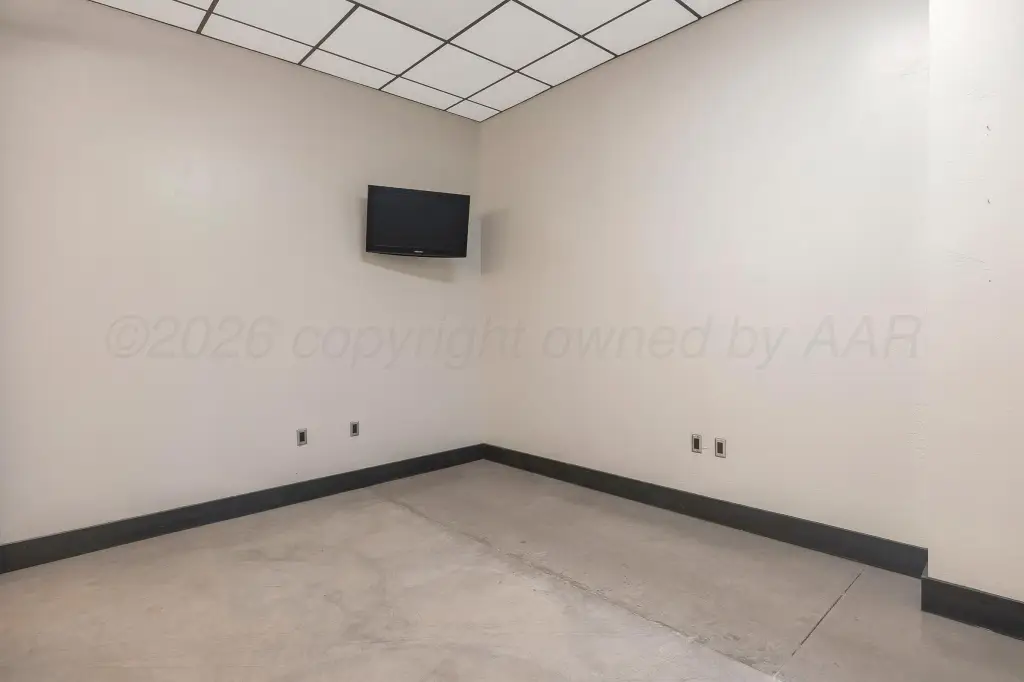
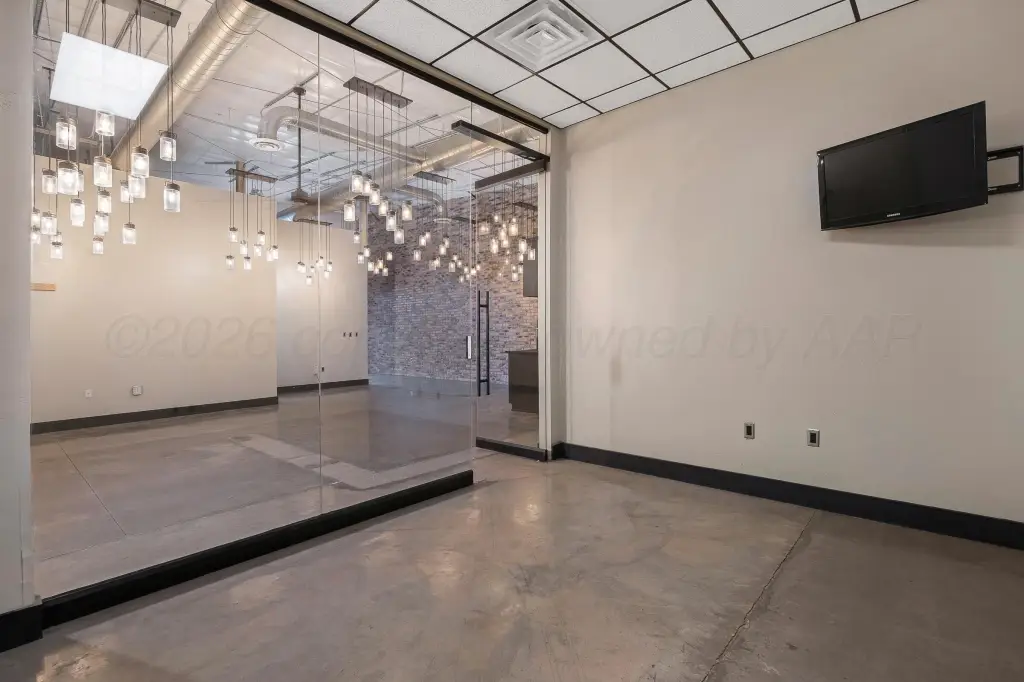
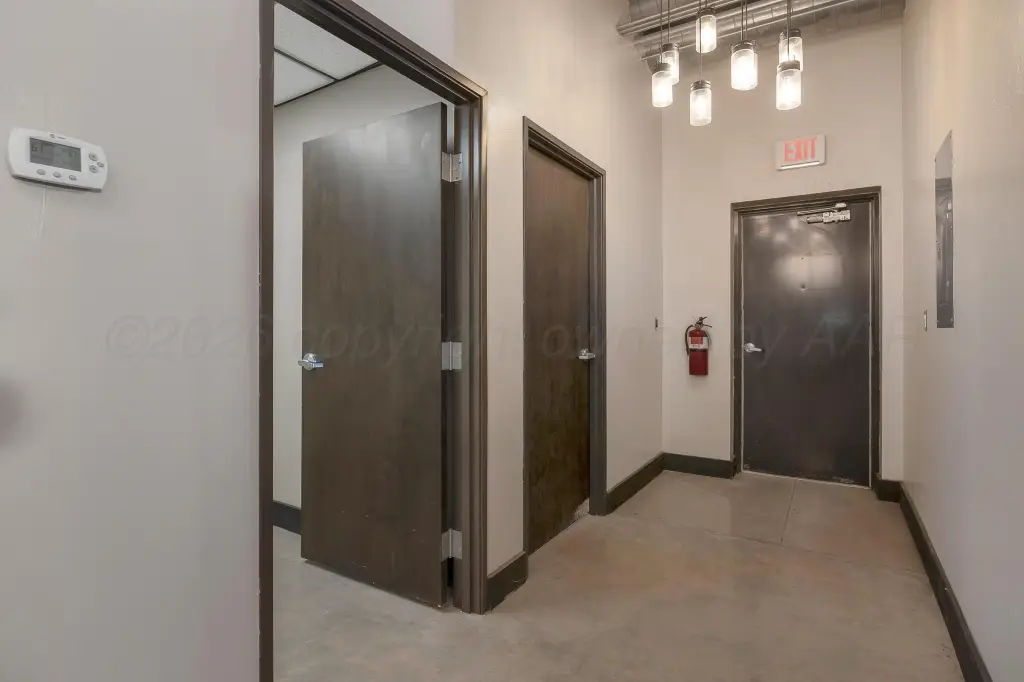
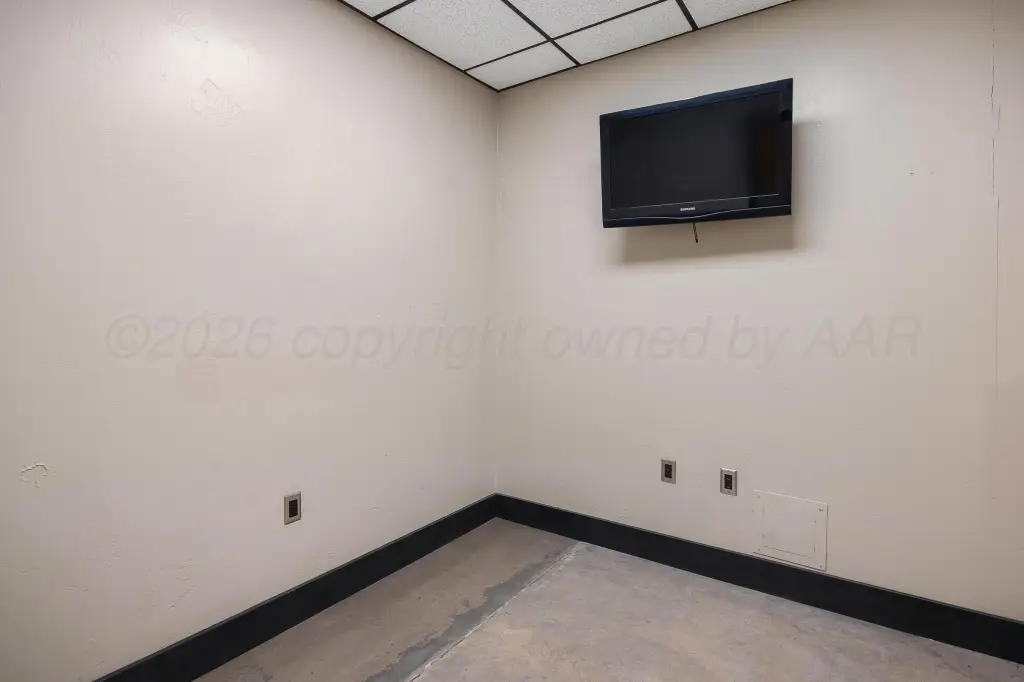
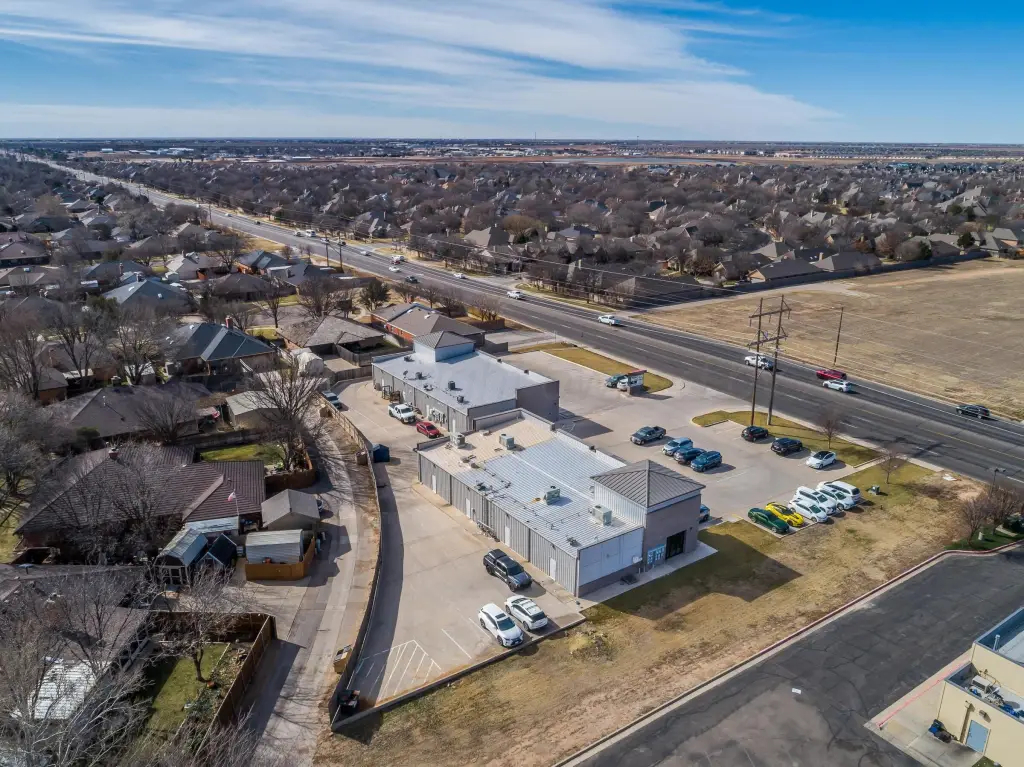
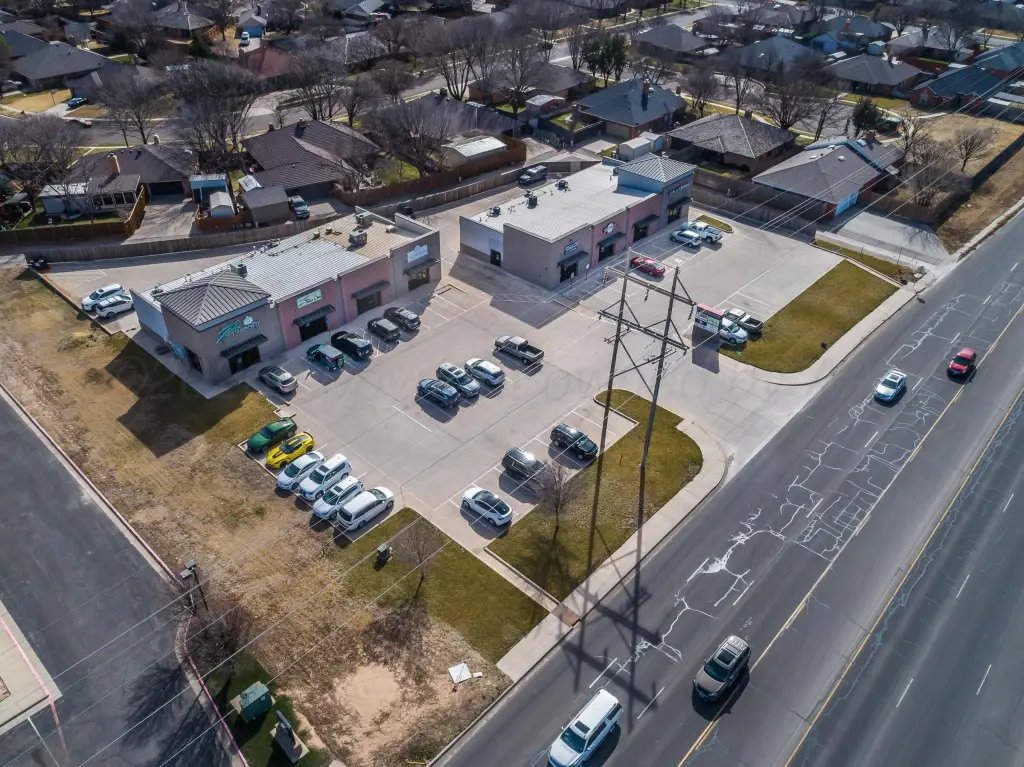
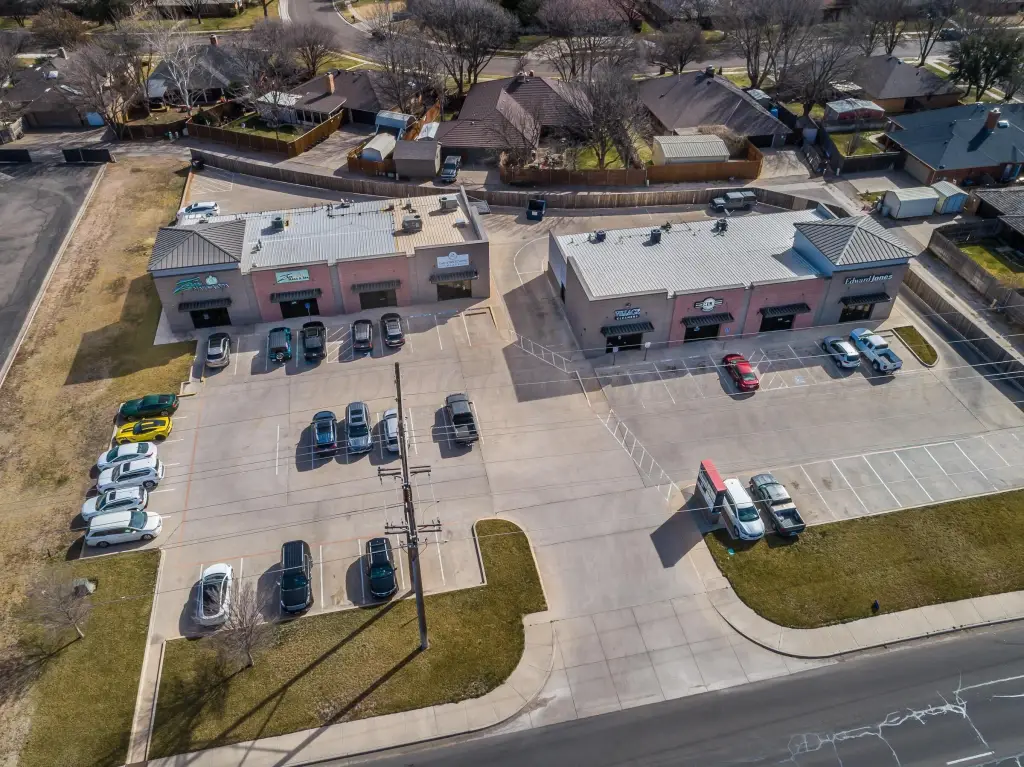
This strip mall property includes two commercial buildings totaling 10,402 square feet, with eight spaces overall and four units in each building. Constructed in 2015, the improvements feature individual water and electric meters for each space. Electric cooling and metal roofing are also in place.
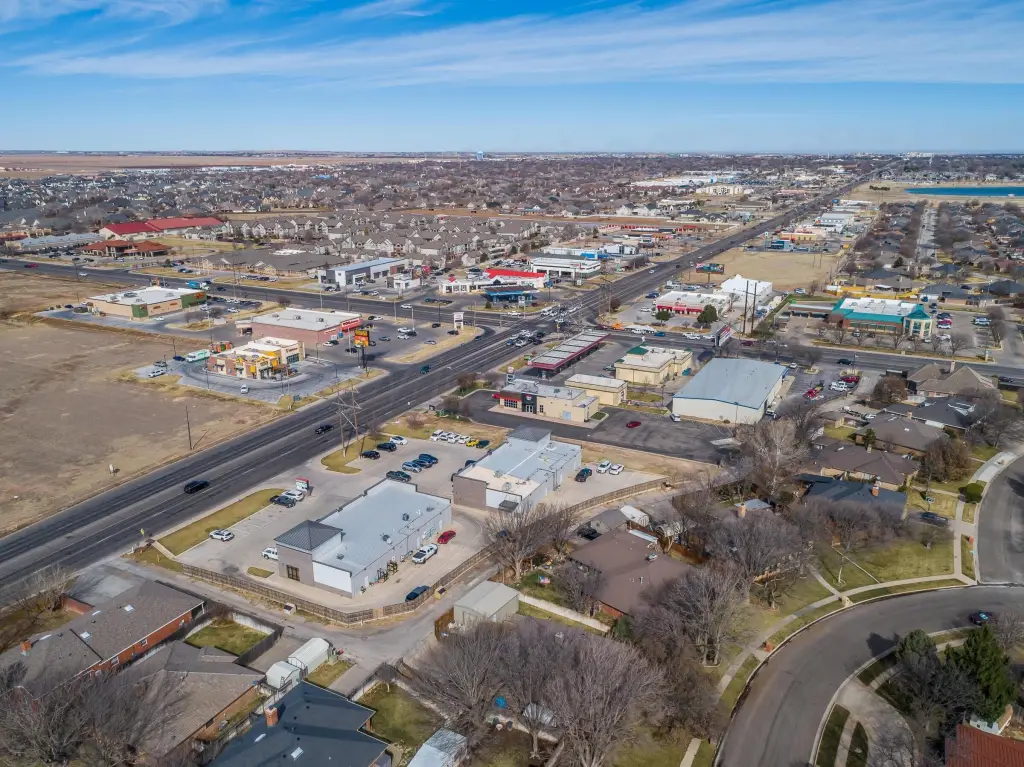
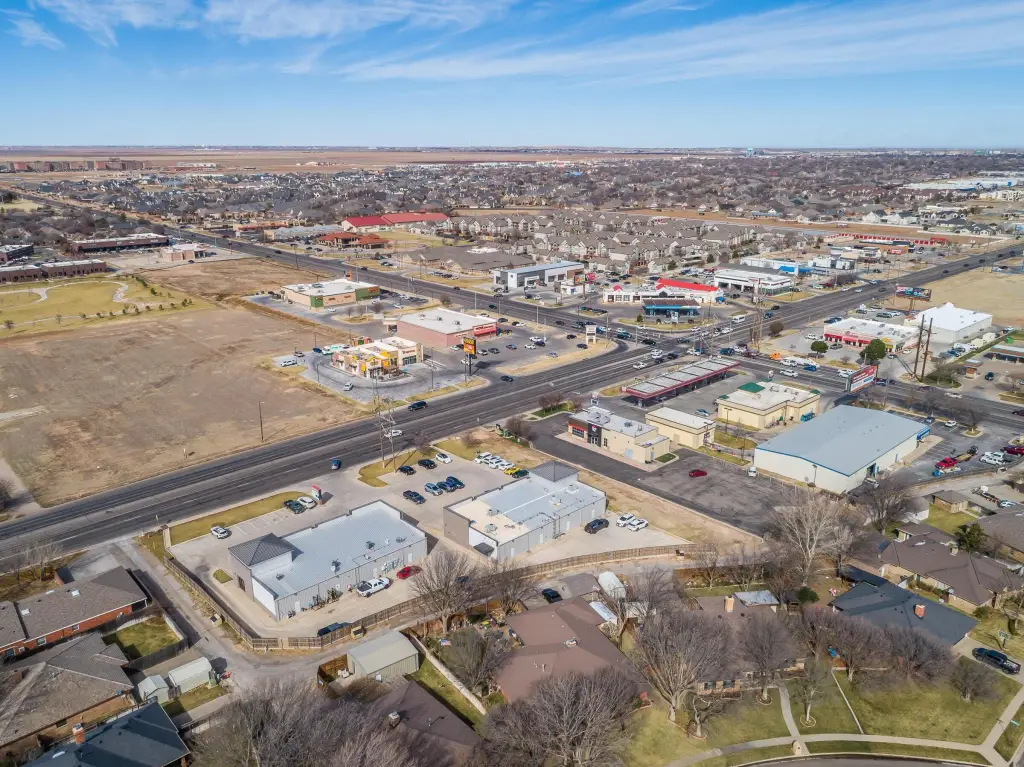
The property occupies 1.17 acres at 6103 S COULTER Street in Amarillo, Texas. Daily traffic exceeds 13,000 vehicles, providing a prominent setting for the retail, office, and service businesses identified for the spaces.
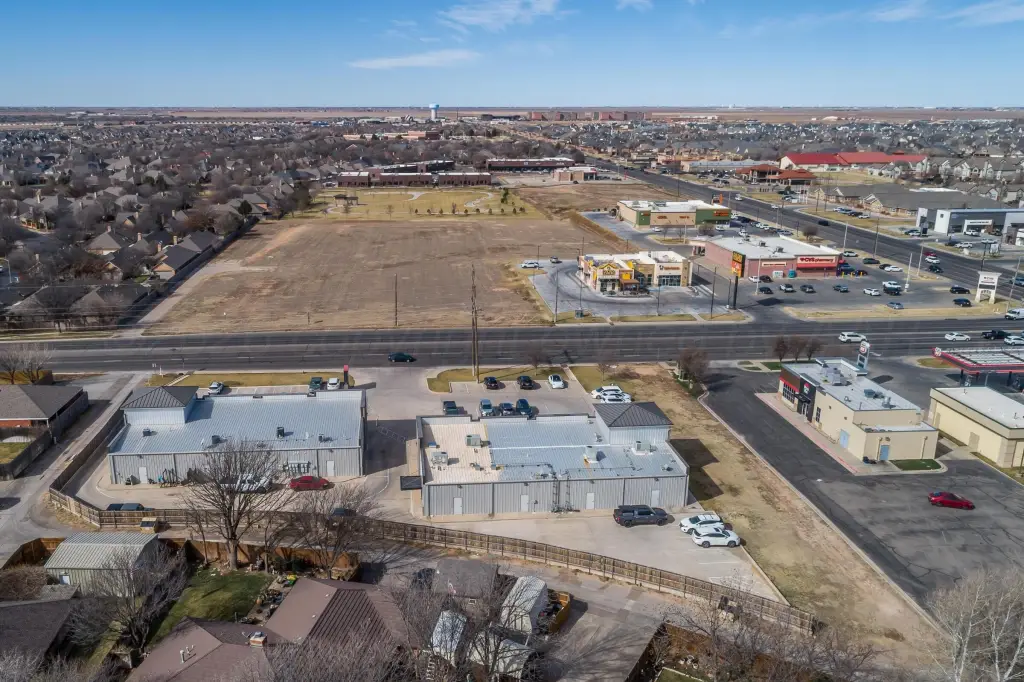
The two-building layout separates the commercial spaces across distinct structures while maintaining a single property configuration. The combination of unit count, individual utility metering, and established improvements provides a clear framework for multi-space commercial occupancy.
The property occupies 1.17 acres at 6103 S COULTER Street in Amarillo, Texas. Daily traffic exceeds 13,000 vehicles, providing a prominent setting for the retail, office, and service businesses identified for the spaces.
The two-building layout separates the commercial spaces across distinct structures while maintaining a single property configuration. The combination of unit count, individual utility metering, and established improvements provides a clear framework for multi-space commercial occupancy.
Key Highlights
- Two buildings totaling 10,402 square feet
- Eight commercial spaces, with 4 units in each building
- Each space is individually metered for water and electricity
Financial Insights
Estimated NOI and Cap Rate
NOI / Yr
$100,483
Cap Rate
4.02%
Suggested Prices Based on Cap Rates
Cap Rate 5%
$2,009,660
$2.0M
Cap Rate 7%
$1,435,471
$1.4M
Cap Rate 9%
$1,116,478
$1.1M
Market Conditions
NOI Build-Up for 10,402 SF
Gross rent
$156.0K $15.00/SF
− Vacancy
−$12.5K −$1.20/SF
EGI
$143.5K $13.80/SF
− OpEx
−$43.1K −$4.14/SF
NOI
$100.5K $9.66/SF
Area
Amarillo, TX
Vacancy
8.00%
Lease Rate
$15.00 /SF/Yr
Expense Ratio
30.00%
Simulate Cap Rate and NOI
Suggested Prices Based on Cap Rates
Cap Rate 5%
$2,009,660
Cap Rate 7%
$1,435,471
Cap Rate 9%
$1,116,478
Alternative Uses
Best Use
Retail
$1.44M
$1.26M – $1.67M
NOI $100,483 @ 7.0% cap · market cap 4.02%
Second Best
—
—
no second resolved use
Theoretical Best
Office A
$2.32M
$2.03M – $2.71M
NOI $162,571 @ 7.0% cap · market cap 6.50%
Zoning and permitted uses should be independently verified with authorities.
How Realmo checks its estimates
Property Analytics
Contact the owner directly
Get the owner's phone numbers and email
Open Analytics
Current Use
Lease Details
13,000 VPD
Traffic count
Multi-tenant
Tenancy
Yes
Utilities to site
Location Intelligence
Trade Area within ½ mile
291
Businesses Nearby
Explore this area
Business Placement
Demographics for 79119, TX
21,147
Population
9,839
Households
2.1
Avg Household Size
37
Median Age
44%
College-Educated
97%
High-School Grad
99.5 sq mi
ZIP Area
213
Density / Sq Mi
$100,546
Median Household Income
$63,728
Median Earnings
$1,217
Median Rent
$335,700
Median Home Value
Check the figures for this property
Cap Rate, Value Estimation, Potential NOI and more
View Realmo Analytics
Market
Vacancy Rate% for Retail in South region




Frequently Asked Questions
What type of property is this?
Strip mall - Multiple commercial spaces with separate water and electric metering accommodate retail, office, and service uses.
Where is this strip mall located?
The property is located at 6103 S COULTER Street Amarillo, TX.
What is the asking price?
The asking price for this property is $2,500,000.
What are key features of this property?
This property features: Two buildings totaling 10,402 square feet; Eight commercial spaces, with 4 units in each building; Each space is individually metered for water and electricity


