Flex Space with Fenced
For Sale
$489,000
3502 N County Road 1660, Lubbock, TX 79416
Commercial Sale, Lubbock, TX
Property Size3,000 SF
Lot Size1.00 Acre
Price / SF$163
Days on Market99
Property Features for 3502 N County Road 1660
General Information
Property type
Commercial Sale
Property subtype
Other
Property condition
Under Construction
Fencing
Fenced
Middle school
Shallowater
High school
Shallowater
Elementary school district
Shallowater ISD
Middle school district
Shallowater ISD
High school district
Shallowater ISD
Subdivision
8
Standard status
Active
APN
R305904
Size
3,000 SF
Lot size
1.00 Acre
Taxes and HOA fees
Tax Description
Blk Js Sec 25 Ab 337 Tr F6 Ac: 4.002
Tax Annual Amount
775
Legal Description
Blk Js Sec 25 Ab 337 Tr F6 Ac: 4.002
Building Details
Year built
2026
Flooring type
Concrete
Building materials
Metal Siding, Steel Frame
Roof type
Metal
Listing Agency:
Milestone Realty Group
(806) 786-1931
Listed By:
Trey Culver · License #0763446
(806) 544-3918
Added: Jul 1
Changed: Oct 2
Last Checked: Oct 7 at 9:06PM
MLS# 202608976
Copyright © 2026 Lubbock Association of Realtors. All rights reserved. All information provided by the listing agent/broker is deemed reliable but is not guaranteed and should be independently verified.
Investment Insights
Based on property information with market context.
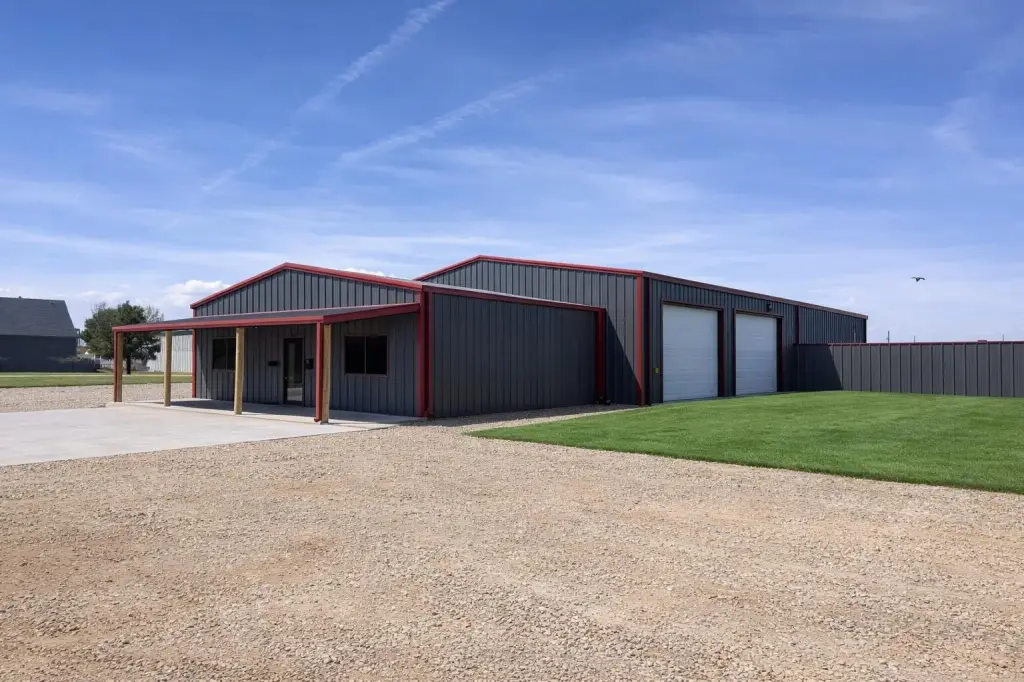
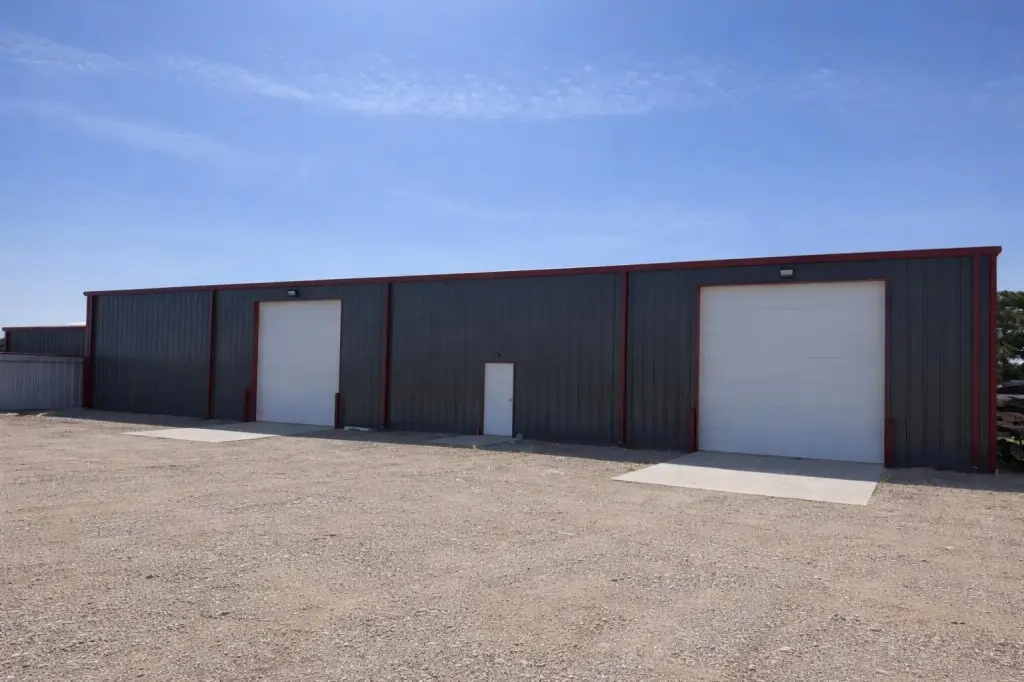
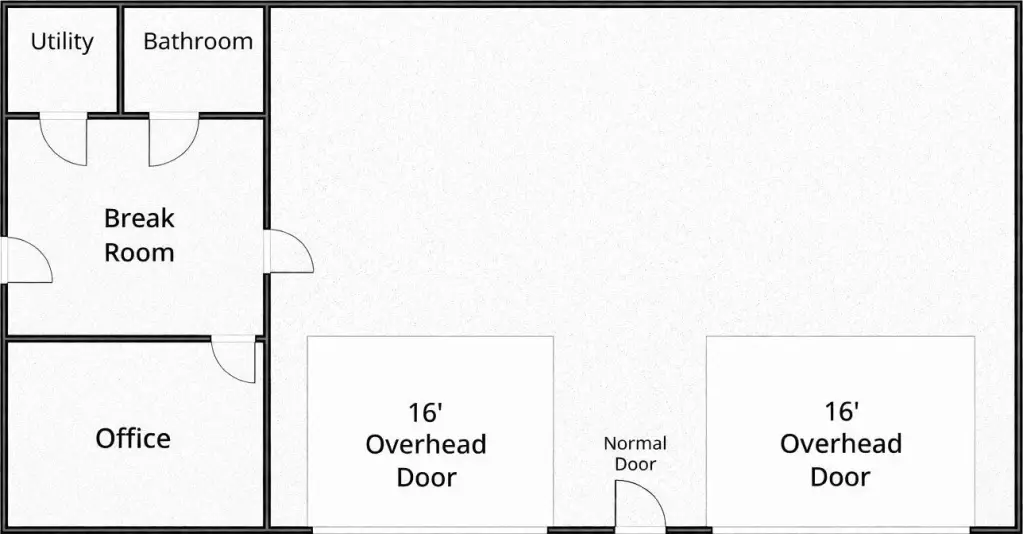
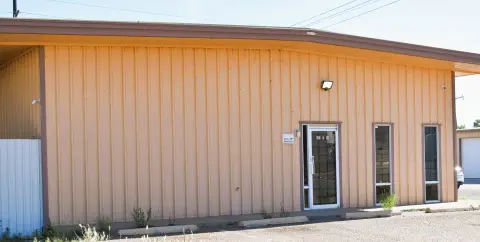
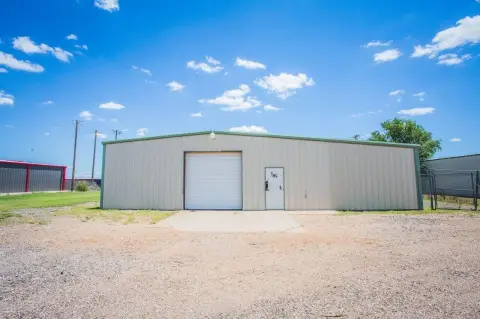
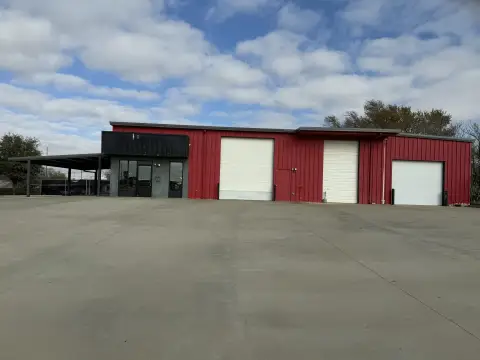
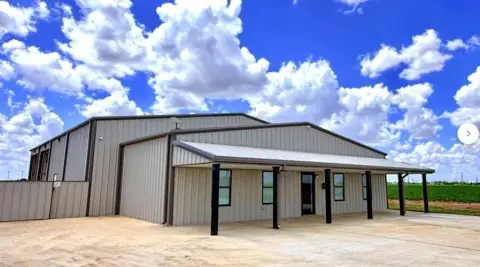
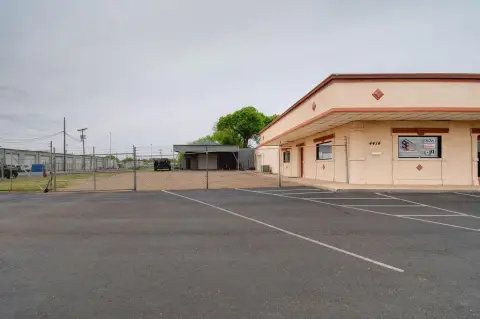
This under-construction flex property occupies a 1-acre tract and is scheduled for completion in 2026. The 3,000-square-foot metal building includes a 40' x 60' shop with 16' sidewalls, two 16' automatic overhead doors, exterior concrete bays, and a 40' x 15' attached office area. The office buildout includes a private office, break room plumbing for a sink and refrigerator, bathroom, utility closet, stained concrete flooring, glass entry doors, and front windows.
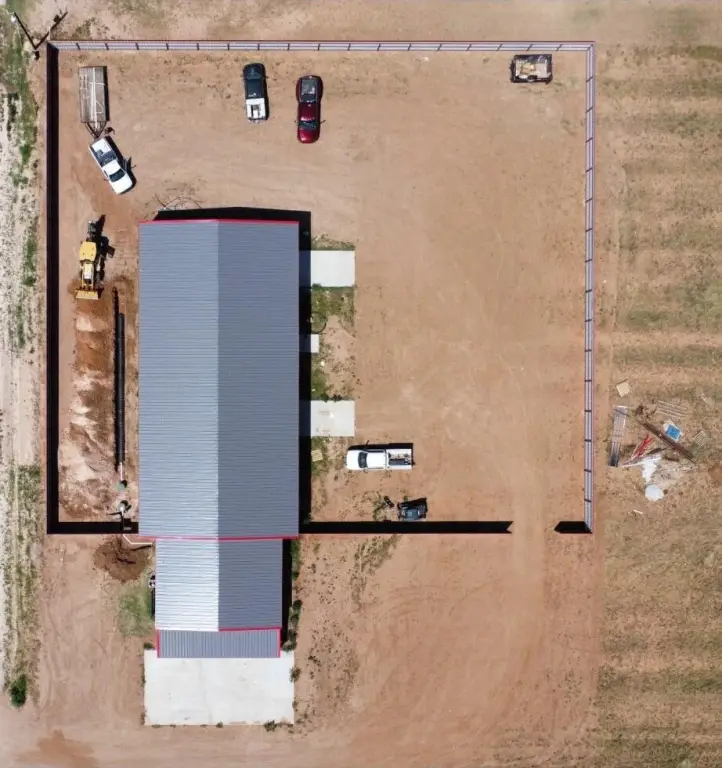
The property includes approximately 29,000 square feet of enclosed yard surfaced with crushed asphalt, an 8-foot steel privacy fence, and industrial-grade exterior lighting on all four sides. Other improvements include a 40' x 20' covered front porch, 40' x 20' concrete driveway, water well, septic system, and planned front-yard irrigation. Electrical service is 200A, 230V single-phase through South Plains Electric. The site is outside city limits, near Milwaukee Avenue, and one mile from the new outer loop.
The property includes approximately 29,000 square feet of enclosed yard surfaced with crushed asphalt, an 8-foot steel privacy fence, and industrial-grade exterior lighting on all four sides. Other improvements include a 40' x 20' covered front porch, 40' x 20' concrete driveway, water well, septic system, and planned front-yard irrigation. Electrical service is 200A, 230V single-phase through South Plains Electric. The site is outside city limits, near Milwaukee Avenue, and one mile from the new outer loop.
Key Highlights
- 3,000‑square‑foot flex building on a full 1‑acre tract
- 40' x 60' shop with 16' sidewalls and two 16' automatic overhead doors
- Approximately 29,000 square feet of fenced crushed‑asphalt yard
Financial Insights
Estimated NOI and Cap Rate
NOI / Yr
$39,218
Cap Rate
8.02%
Suggested Prices Based on Cap Rates
Cap Rate 5%
$784,360
$784.4K
Cap Rate 7%
$560,257
$560.3K
Cap Rate 9%
$435,756
$435.8K
Market Conditions
NOI Build-Up for 3,000 SF
Gross rent
$63.0K $21.00/SF
− Vacancy
−$10.7K −$3.57/SF
EGI
$52.3K $17.43/SF
− OpEx
−$13.1K −$4.36/SF
NOI
$39.2K $13.07/SF
Area
Lubbock, TX
Vacancy
17.00%
Lease Rate
$21.00 /SF/Yr
Expense Ratio
25.00%
Simulate Cap Rate and NOI
Suggested Prices Based on Cap Rates
Cap Rate 5%
$784,360
Cap Rate 7%
$560,257
Cap Rate 9%
$435,756
Alternative Uses
Best Use
Office B
$560.3K
$490.2K – $653.6K
NOI $39,218 @ 7.0% cap · market cap 8.02%
Second Best
Industrial
$482.8K
$422.5K – $563.3K
NOI $33,799 @ 7.0% cap · market cap 6.91%
Theoretical Best
Office A
$756.3K
$661.8K – $882.4K
NOI $52,942 @ 7.0% cap · market cap 10.83%
Zoning and permitted uses should be independently verified with authorities.
Property Analytics
Unlock full access to Insights
Subscribe to Realmo Intelligence
Open Analytics
Current Use
Lease Details
16 ft
Clear height
2
Drive-in doors
Yes
Fenced yard
Yes
Utilities to site
Location Intelligence
Trade Area within ½ mile
10
Businesses Nearby
Well-served
Demand for This Use
Explore this area
Business Placement
Demographics for 79416, TX
36,251
Population
16,094
Households
2.3
Avg Household Size
30
Median Age
39%
College-Educated
93%
High-School Grad
32.1 sq mi
ZIP Area
1,129
Density / Sq Mi
$65,200
Median Household Income
$34,258
Median Earnings
$1,269
Median Rent
$196,900
Median Home Value
Check the figures for this property
Cap Rate, Value Estimation, Potential NOI and more
View Realmo Analytics
Market
Vacancy Rate% for Office in South region

Questions? Ask Rey
Realmo’s AI knows this listing — price, zoning, demand, history. Ask anything.






Frequently Asked Questions
What type of property is this?
Flex space - Under-construction flex space combines shop, office, enclosed yard, and dedicated utility systems.
Where is this flex space located?
The property is located at 3502 N County Road 1660 Lubbock, TX.
What is the asking price?
The asking price for this property is $489,000.
What are key features of this property?
This property features: 3,000‑square‑foot flex building on a full 1‑acre tract; 40' x 60' shop with 16' sidewalls and two 16' automatic overhead doors; Approximately 29,000 square feet of fenced crushed‑asphalt yard


