Corner Retail-Warehouse with
1914 CYPRESS STREET West Monroe, LA 71291
For Sale
$550,000
COMMERCIAL - West Monroe, LA
Property Size7,735 SF
Lot Size0.48 Acres
Price / SF$71.11
Days on Market237
Property Features for 1914 CYPRESS STREET
General Information
Property type
Commercial Sale
Property subtype
Other
Rooms
Office
Security features
Security Lighting, Security System
Interior features
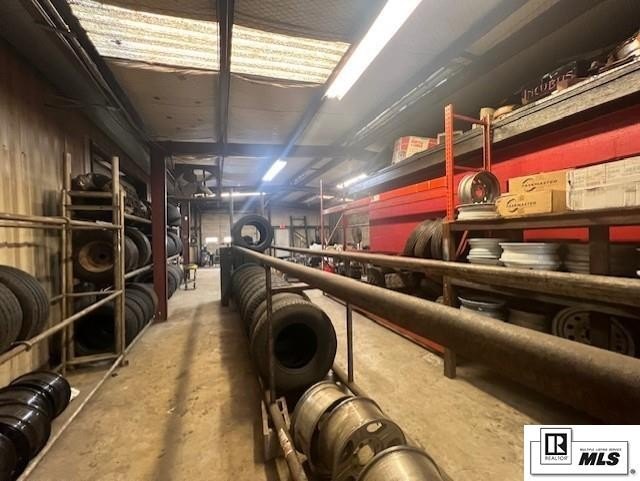
Extra Storage, Private Bathrooms, Showroom, Security System
Exterior features
Gutters, Lighting/Security, Loading Docks
Standard status
Active
APN
75177
Lot size
0.48 Acres
Taxes and HOA fees
Tax Description
LOT IN TRENTON ADDN, SEC 44 T18N R3E
Utilities
Heating system
Central, Wall Furnace, Electric (Heating)
Cooling system
Central Air, Electric
Building Details
Building materials
Metal
Roof type
Metal
Additional Structures
Storage
Listing Agency:
John Rea Realty
(318) 388-0941
Listed By:
Jennifer Causey · License #LA995693195
(318) 261-0892
Added: Dec 4, 2025
Changed: Jul 12
Last Checked: Jul 29 at 12:06AM
MLS# 217318
Copyright © 2026 Northeast Louisiana Association of REALTORS. All rights reserved. All information provided by the listing agent/broker is deemed reliable but is not guaranteed and should be independently verified.
Investment Insights
Based on property information with market context.
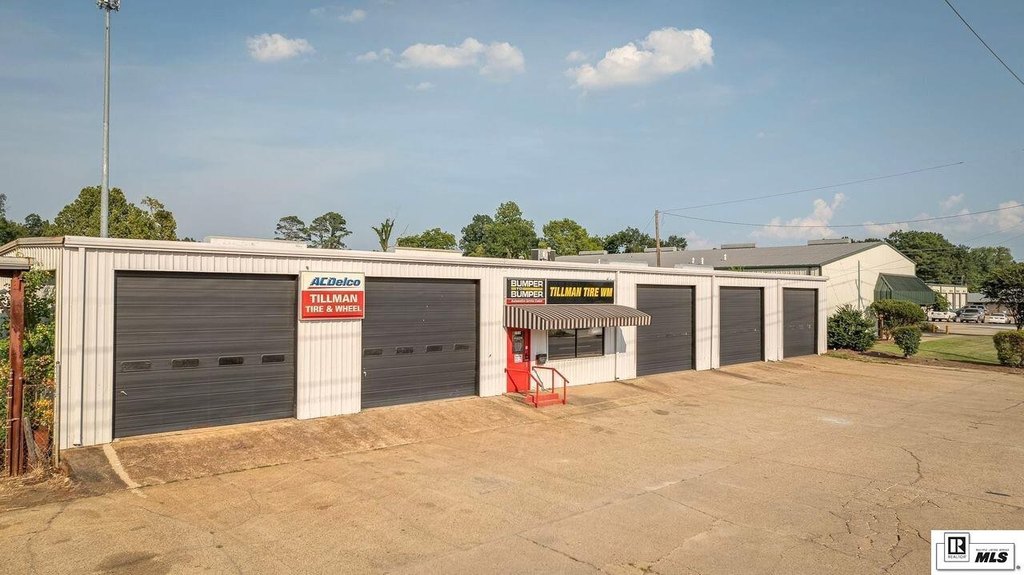
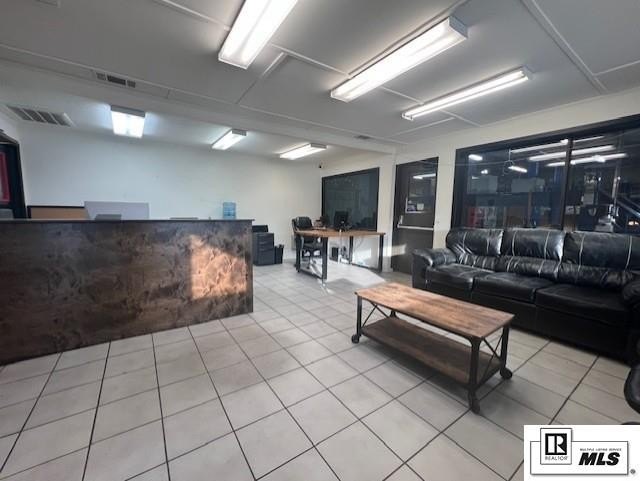
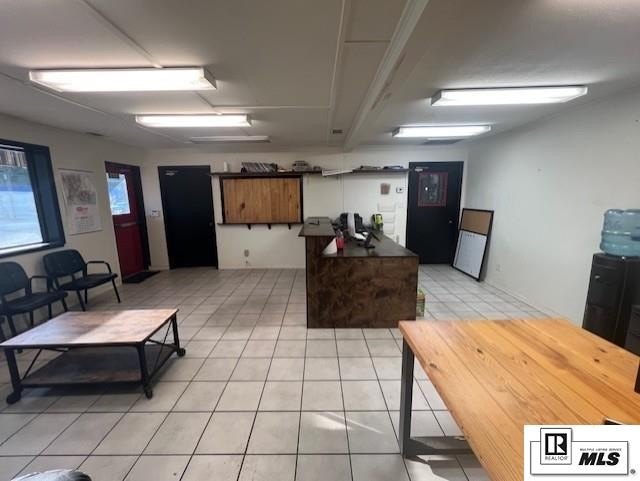
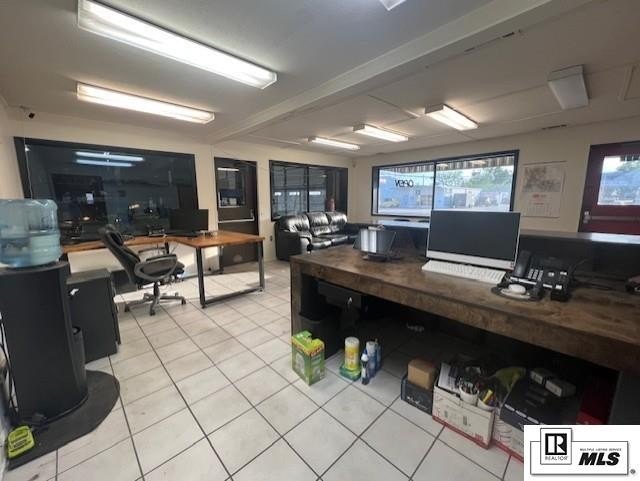
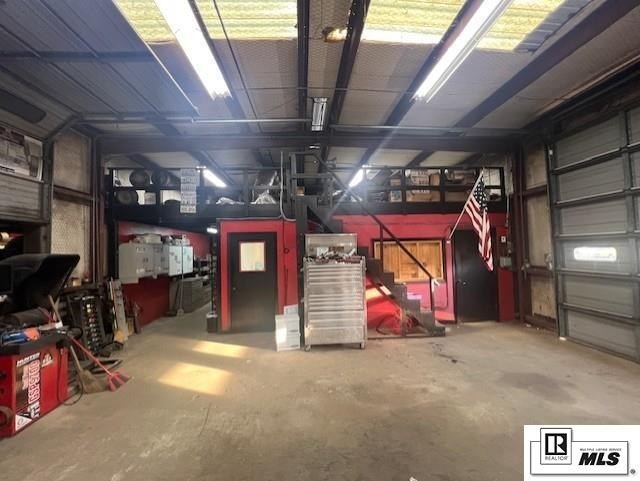
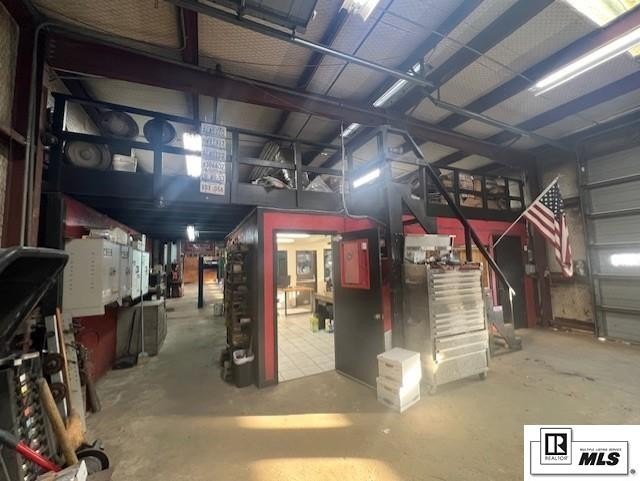
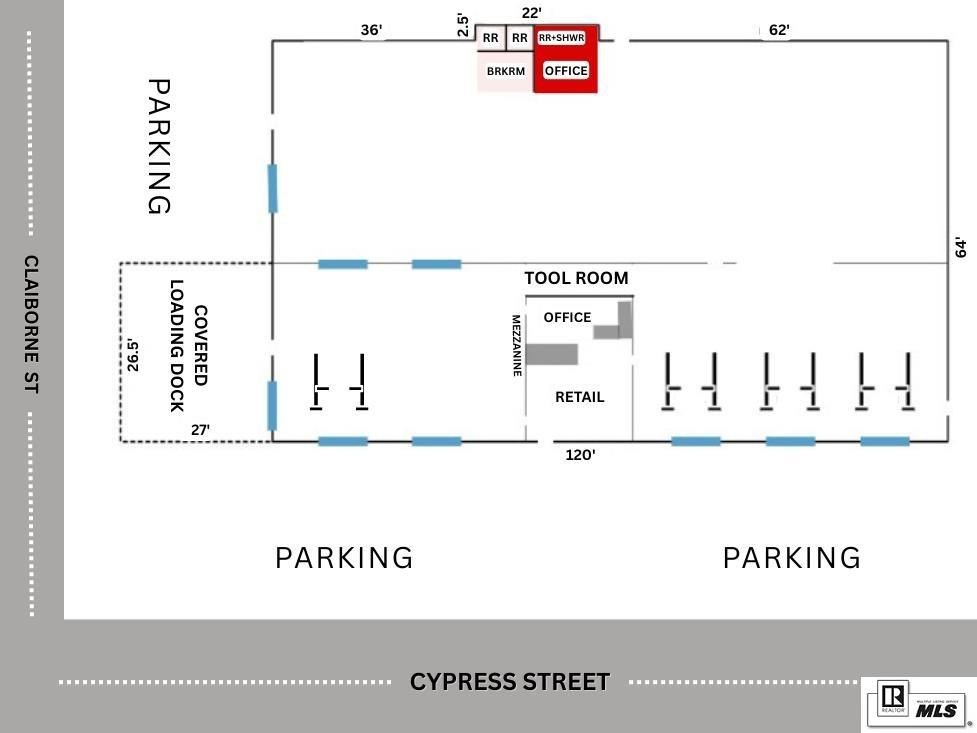
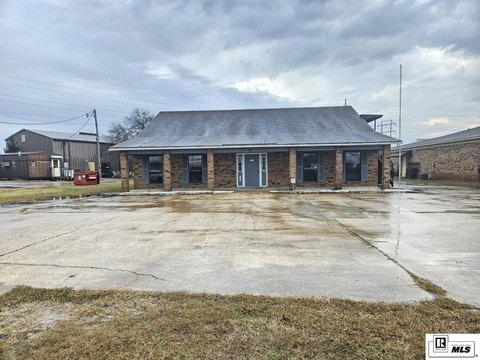
This property is a warehouse and retail-facing facility with an office and shop layout. The covered front entry opens into a retail or waiting area with a large sales counter, workstation, and viewing windows into the shop bays. The interior includes an office, kitchen or break area, mezzanine storage above the office, and three restrooms, including one with a shower.
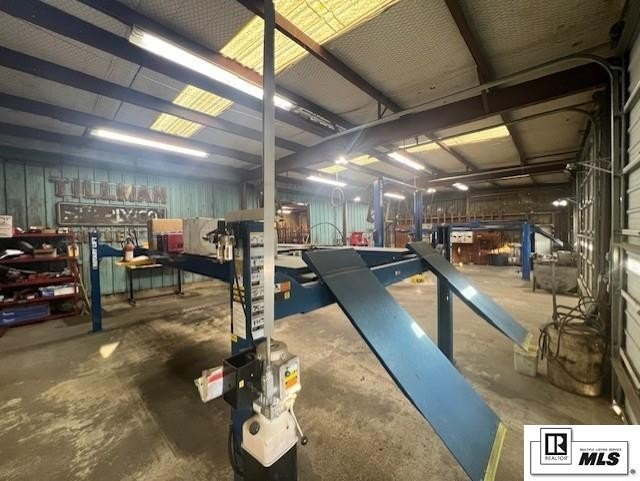
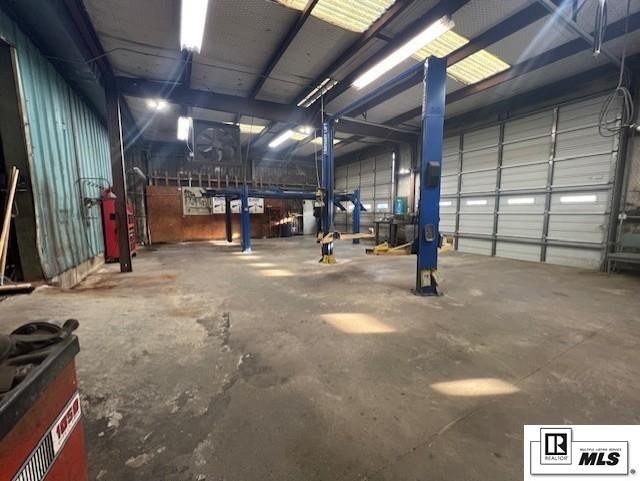
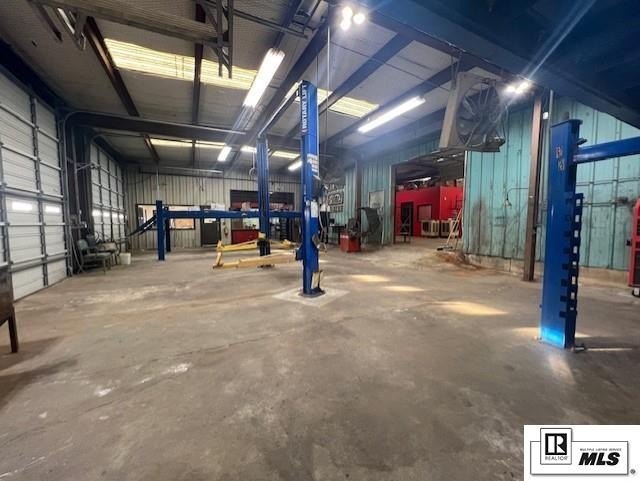
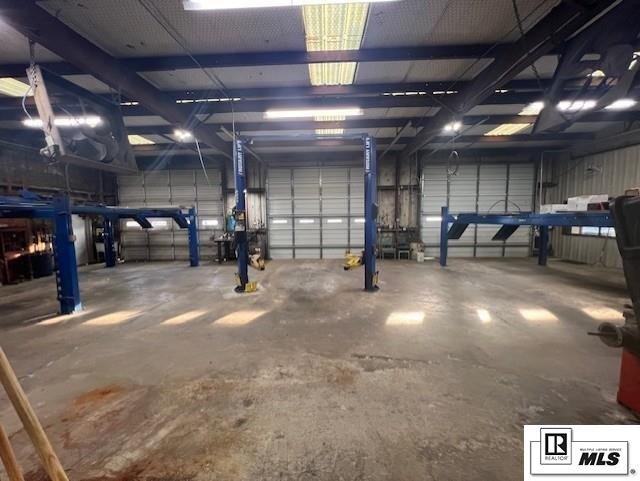
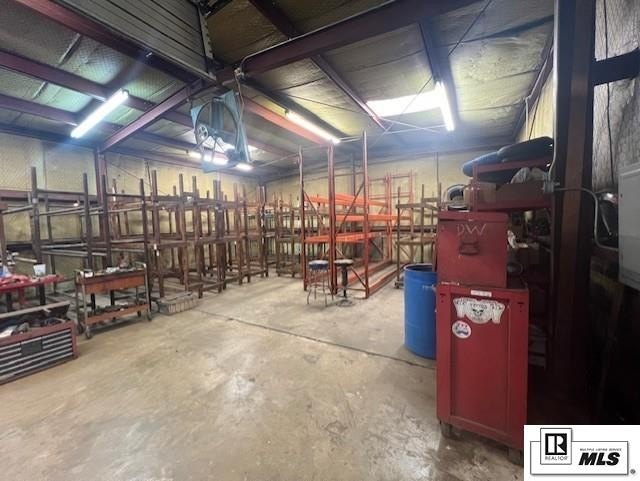
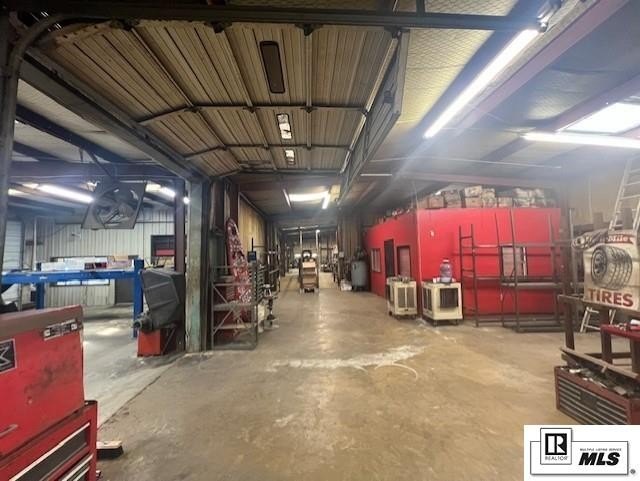
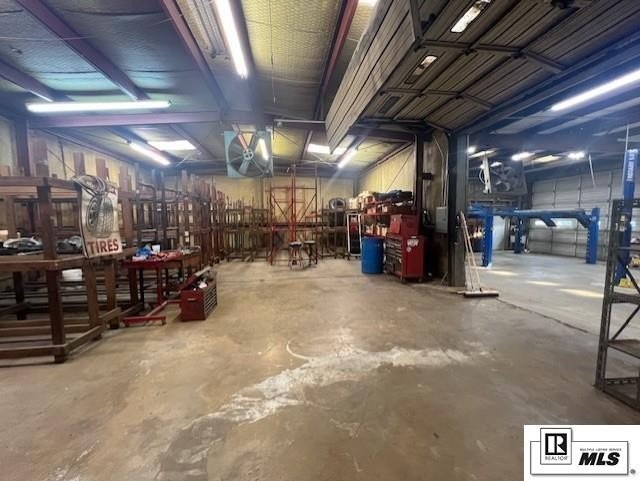
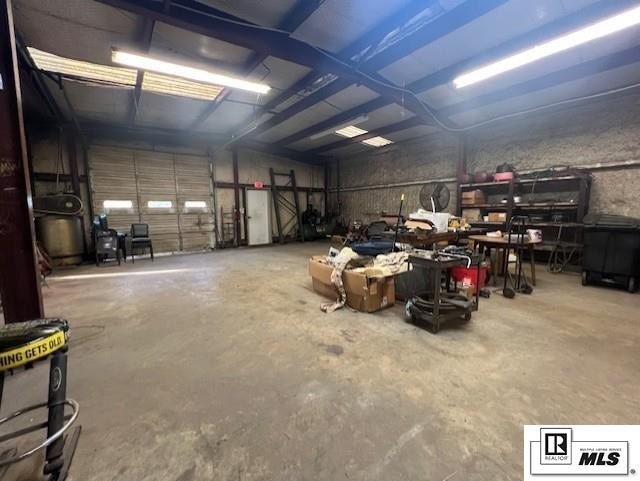
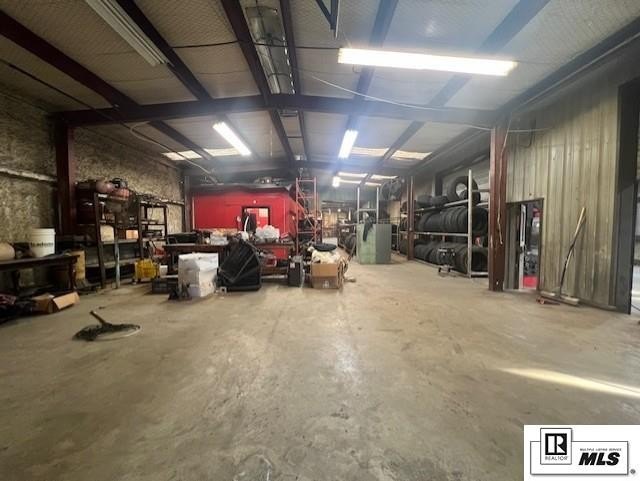
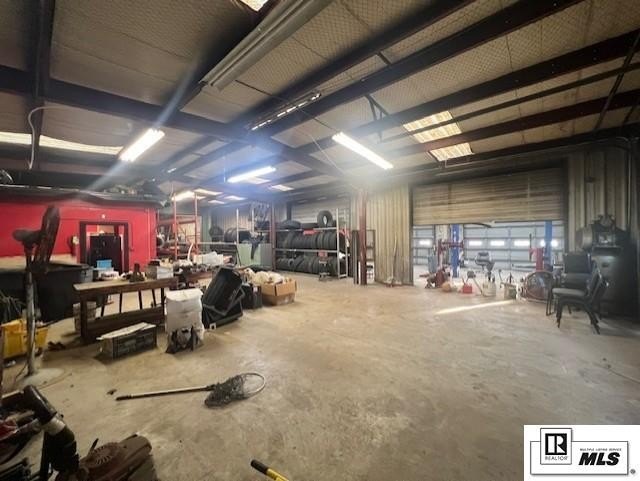
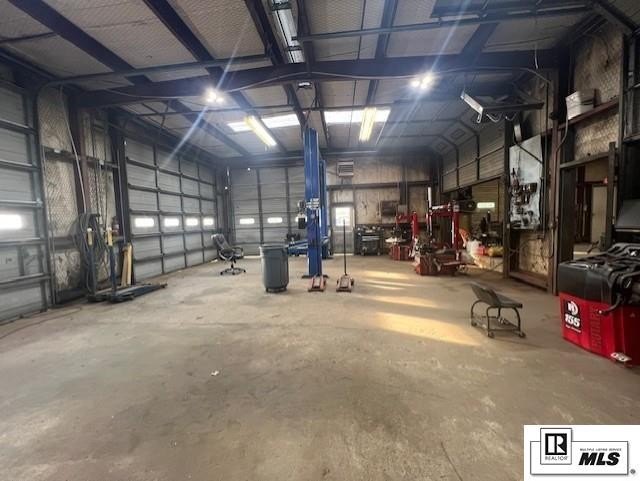
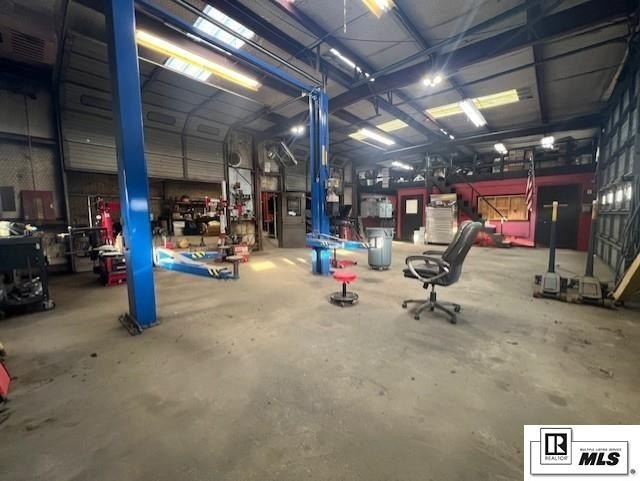
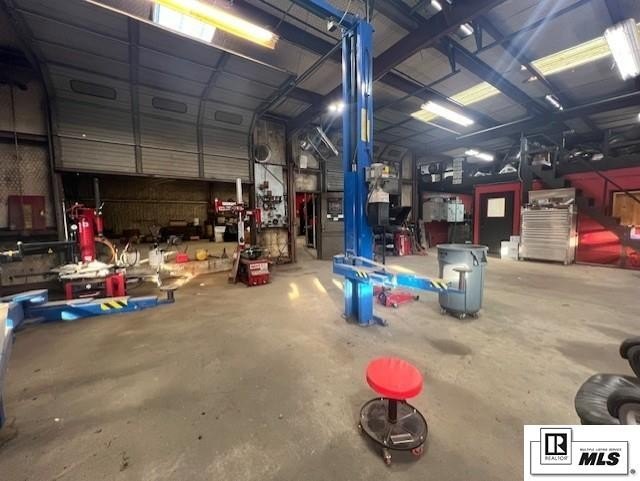
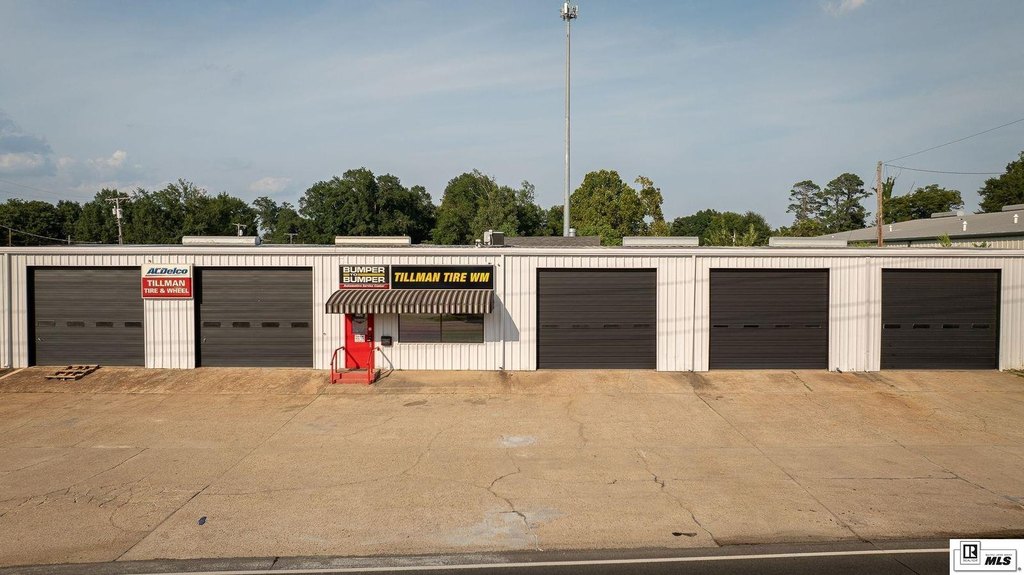
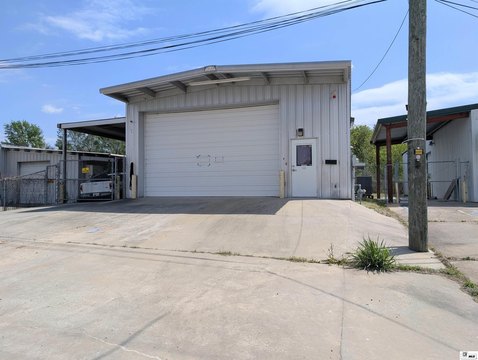
Warehouse operations are supported by multiple loading options and bay equipment. There are seven total exterior overhead doors, including three 14' x 14' right-front doors, two 14' x 14' left-front doors, one 14' x 14' door at the covered loading dock, and one 10' x 12' door at the uncovered loading dock. In addition, there are two interior 10' x 12' overhead doors that can close off the left side of the warehouse from front to back for flexible workspace separation. The warehouse and shop areas are not HVAC-controlled, while only the office and breakroom areas are HVAC'd. The warehouse includes storage racks, multiple rear exits, and ceiling and floor fans.
Visible from multiple locations, the property includes several pylon signage locations, including building-mounted panels and a multi-face pylon sign at the corner. The listing is offered as-is, where-is, with an active alarm and a sign on the property. Estimated equipment and remaining inventory will transfer with the sale.
Warehouse operations are supported by multiple loading options and bay equipment. There are seven total exterior overhead doors, including three 14' x 14' right-front doors, two 14' x 14' left-front doors, one 14' x 14' door at the covered loading dock, and one 10' x 12' door at the uncovered loading dock. In addition, there are two interior 10' x 12' overhead doors that can close off the left side of the warehouse from front to back for flexible workspace separation. The warehouse and shop areas are not HVAC-controlled, while only the office and breakroom areas are HVAC'd. The warehouse includes storage racks, multiple rear exits, and ceiling and floor fans.
Visible from multiple locations, the property includes several pylon signage locations, including building-mounted panels and a multi-face pylon sign at the corner. The listing is offered as-is, where-is, with an active alarm and a sign on the property. Estimated equipment and remaining inventory will transfer with the sale.
Key Highlights
- Back on market: 8,276+/- SF gross with 7,735+/- SF usable area, including office, warehouse, kitchen/break area, and mezzanine storage
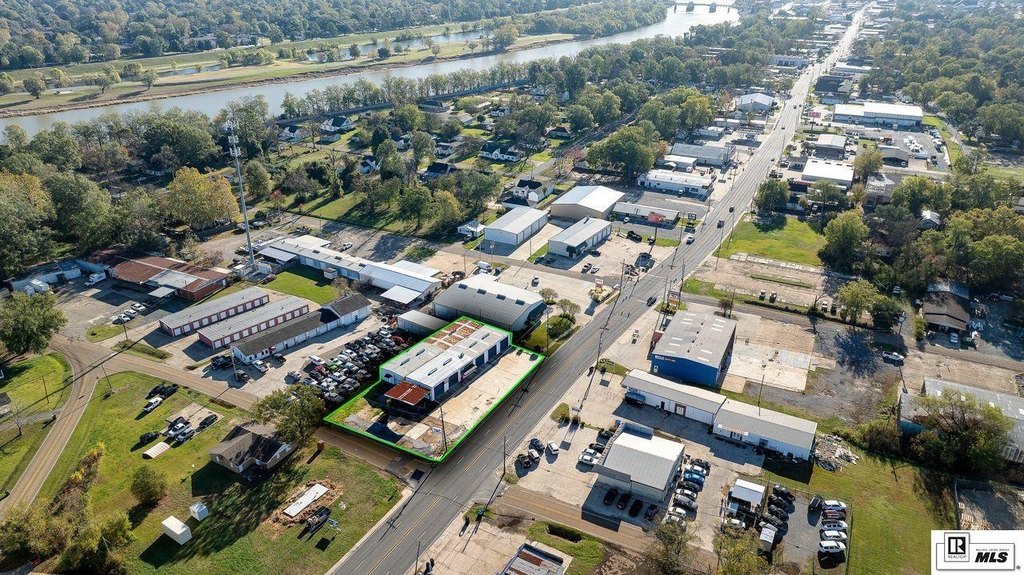
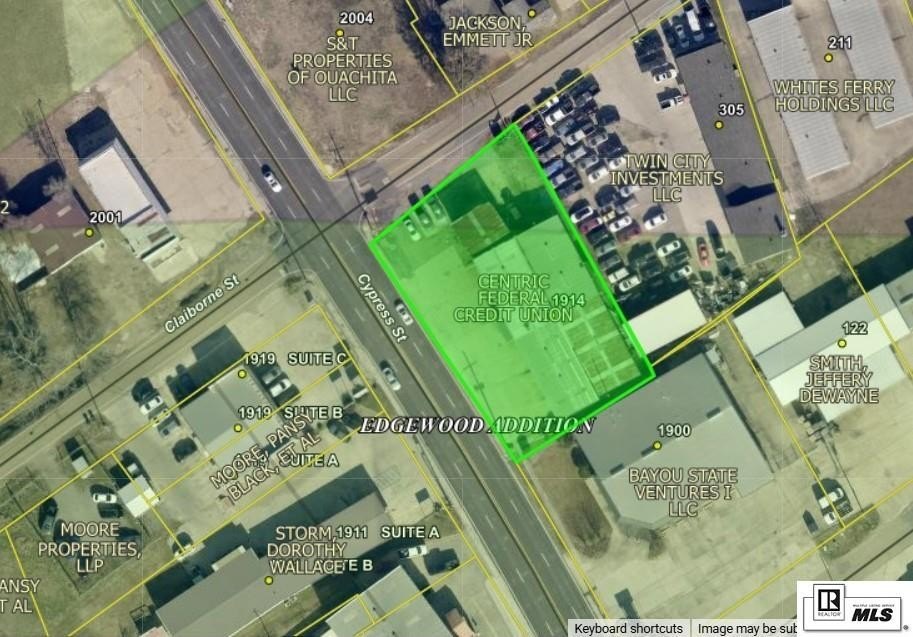
- High‑visibility corner on Cypress & Claiborne St with excellent frontage, access, and multiple pylon signage locations (building‑mounted panels and corner multi‑face pylon)
- Seven exterior loading docks with 14' x 14' OHDs (3 right‑front, 2 left‑front, 1 covered dock) plus 10' x 12' OHD at the uncovered dock
Financial Insights For Warehouse
Simulate Cap Rate and NOI
NOI Build-Up
- Vacancy
- income lost from leasable area expected to sit empty during the year — subtracted from gross rent.
- EGI (Effective Gross Income)
- gross rent minus vacancy losses — the realistic income before paying operating costs.
- OpEx (Operating Expenses)
- recurring costs to operate the property (property tax, insurance, utilities, maintenance, management) — excludes financing and capital improvements.
- NOI (Net Operating Income)
- income a property generates after operating costs but before financing and taxes.
| Component | $ | $/SF |
|---|---|---|
| Gross rent | $57.5k | $7.44 |
| − Vacancy | −$3.9k | −$0.51 |
| EGI | $53.6k | $6.93 |
| − OpEx | −$8.0k | −$1.04 |
| NOI | $45.6k | $5.89 |
7,735 SF · lease $7.44/SF/yr · vacancy 6.80% · expense 15.00%
Alternative Uses
Best Use
Retail
$3.03M
$2.65M – $3.54M
NOI $212,256 @ 7.0% cap · market cap 38.59%
Second Best
Flex RnD
$951.5K
$832.6K – $1.11M
NOI $66,608 @ 7.0% cap · market cap 12.11%
Theoretical Best
Multifamily LT 5
$83.32M
$72.90M – $97.20M
NOI $5,832,144 @ 7.0% cap · market cap 1,060.39%
Zoning and permitted uses should be independently verified with authorities.
Property Analytics
Property Profile
Location Intelligence
Current Use






Frequently Asked Questions
What type of property is this?
Flex space - High-visibility corner property includes HVAC office areas, a mezzanine, and seven exterior overhead loading doors.
Where is this flex space located?
The property is located at 1914 CYPRESS STREET West Monroe, LA.
What is the asking price?
The asking price for this property is $550,000.
What are key features of this property?
This property features: Back on market: 8,276+/- SF gross with 7,735+/- SF usable area, including office, warehouse, kitchen/break area, and mezzanine storage; High‑visibility corner on Cypress & Claiborne St with excellent frontage, access, and multiple pylon signage locations (building‑mounted panels and corner multi‑face pylon); Seven exterior loading docks with 14' x 14' OHDs (3 right‑front, 2 left‑front, 1 covered dock) plus 10' x 12' OHD at the uncovered dock