Corner Retail and Warehouse
1914 Cypress St West Monroe, LA 71291
For Sale
Contact for pricing
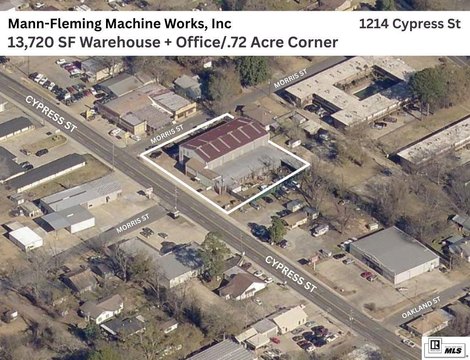
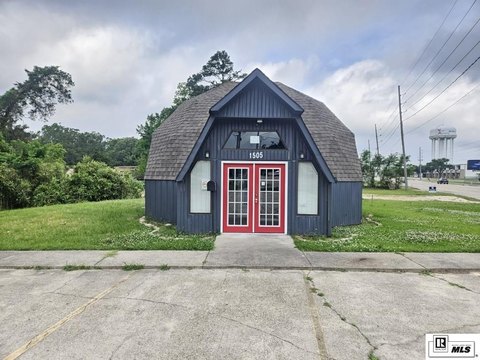
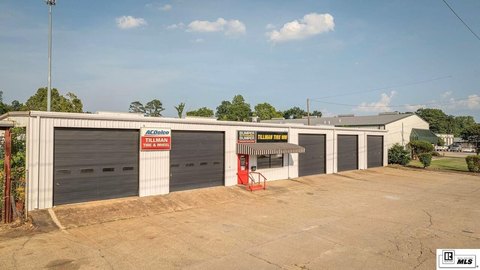
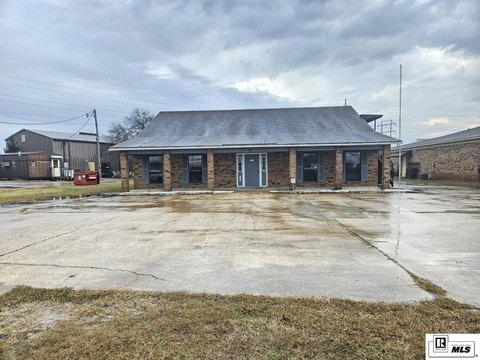
High-visibility corner facility with office, shop bays, mezzanine storage, and multiple exterior overhead loading doors.
Property Size7,735 SF
Price / SF$71.11
Days on Market236
Property Features for 1914 Cypress St
General Information
Standard status
Active
Size
7,735 SF
Property subtype
INDUSTRIAL
Listing Agency:
John Rea Realty
(318) 261-0892
Listed By:
Jennifer Causey · License #LA995693195
(318) 261-0892
Source:
Moodyscre
Added: Dec 5, 2025
Changed: Jul 27
Last Checked: Jul 27 at 7:41PM
Displayed information is deemed reliable but is not guaranteed and should be independently verified. All listing content including descriptions, pricing, images are the copyrighted material of John Rea Realty
Investment Insights
Based on property information with market context.
This corner flex and warehouse property includes office space, a warehouse/shop area, a kitchen/break area, mezzanine storage above the office, and three restrooms (one with a shower). The front covered entry leads into a retail/waiting area with a large sales counter, workstation, and viewing windows into the shop bays. Warehouse operations include hydraulic lifts, a tool room, ceiling and floor fans, and storage racks in the rear warehouse area.
Loading is supported by seven exterior overhead doors, including multiple 14' x 14' doors on both the right and left front sides, a 14' x 14' door at the covered dock, and a 10' x 12' door at the uncovered dock. In addition, there are two interior 10' x 12' overhead doors that can close off the left side of the warehouse from front to back for flexible space separation. The office and breakroom areas are HVAC-controlled, while the warehouse/shop areas are not HVAC-controlled.
The property also features multiple pylon signage locations, including building-mounted panels and a multi-face pylon sign at the corner. There are three rear exits. It is offered as-is/where-is, with estimated $100,000+ in equipment and remaining inventory transferring with the sale; personal property carries no assigned value and is not reflected in the real estate valuation. An active alarm and a sign are on the property, and showing instructions are available upon request.
Loading is supported by seven exterior overhead doors, including multiple 14' x 14' doors on both the right and left front sides, a 14' x 14' door at the covered dock, and a 10' x 12' door at the uncovered dock. In addition, there are two interior 10' x 12' overhead doors that can close off the left side of the warehouse from front to back for flexible space separation. The office and breakroom areas are HVAC-controlled, while the warehouse/shop areas are not HVAC-controlled.
The property also features multiple pylon signage locations, including building-mounted panels and a multi-face pylon sign at the corner. There are three rear exits. It is offered as-is/where-is, with estimated $100,000+ in equipment and remaining inventory transferring with the sale; personal property carries no assigned value and is not reflected in the real estate valuation. An active alarm and a sign are on the property, and showing instructions are available upon request.
Key Highlights
- High‑visibility corner on Cypress & Claiborne St with excellent frontage and access, plus multiple pylon signage locations
- 8,276± SF gross / 7,735± SF usable space with office, warehouse/shop, kitchen/break area, mezzanine storage, and 3 restrooms (one with a shower)
- Retail/waiting entry with large sales counter, workstation, and viewing windows into the shop bays
Financial Insights For Warehouse
Simulate Cap Rate and NOI
NOI Build-Up
- Vacancy
- income lost from leasable area expected to sit empty during the year — subtracted from gross rent.
- EGI (Effective Gross Income)
- gross rent minus vacancy losses — the realistic income before paying operating costs.
- OpEx (Operating Expenses)
- recurring costs to operate the property (property tax, insurance, utilities, maintenance, management) — excludes financing and capital improvements.
- NOI (Net Operating Income)
- income a property generates after operating costs but before financing and taxes.
| Component | $ | $/SF |
|---|---|---|
| Gross rent | $57.5k | $7.44 |
| − Vacancy | −$3.9k | −$0.51 |
| EGI | $53.6k | $6.93 |
| − OpEx | −$8.0k | −$1.04 |
| NOI | $45.6k | $5.89 |
7,735 SF · lease $7.44/SF/yr · vacancy 6.80% · expense 15.00%
Alternative Uses
Best Use
Retail
$3.03M
$2.65M – $3.54M
NOI $212,256 @ 7.0% cap · market cap 38.59%
Second Best
Flex RnD
$951.5K
$832.6K – $1.11M
NOI $66,608 @ 7.0% cap · market cap 12.11%
Theoretical Best
Multifamily LT 5
$83.32M
$72.90M – $97.20M
NOI $5,832,144 @ 7.0% cap · market cap 1,060.39%
Zoning and permitted uses should be independently verified with authorities.
Property Analytics
Location Intelligence
Current Use





Frequently Asked Questions
What type of property is this?
Flex space - High-visibility corner facility with office, shop bays, mezzanine storage, and multiple exterior overhead loading doors.
Where is this flex space located?
The property is located at 1914 Cypress St West Monroe, LA.
What is the asking price?
The asking price for this property is $550,000.
What are key features of this property?
This property features: High‑visibility corner on Cypress & Claiborne St with excellent frontage and access, plus multiple pylon signage locations; 8,276± SF gross / 7,735± SF usable space with office, warehouse/shop, kitchen/break area, mezzanine storage, and 3 restrooms (one with a shower); Retail/waiting entry with large sales counter, workstation, and viewing windows into the shop bays