5-Unit Residential Income
1830 Roslyn Avenue Kettering, OH 45429
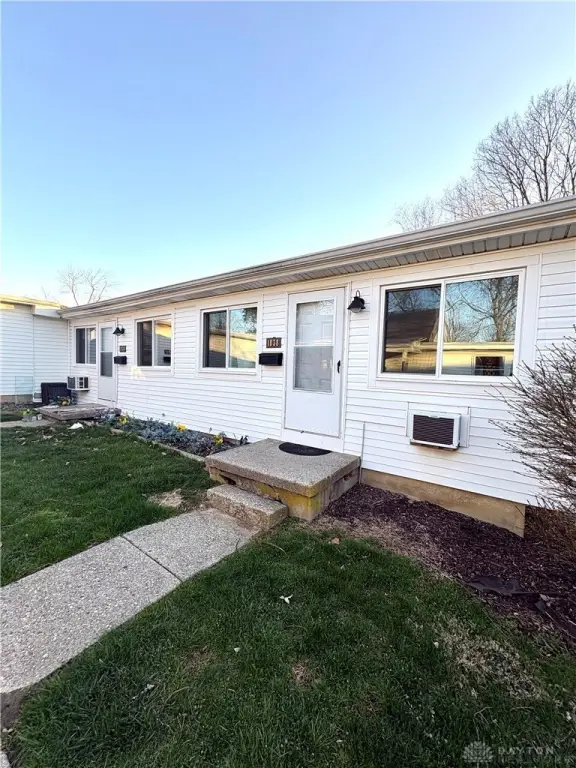
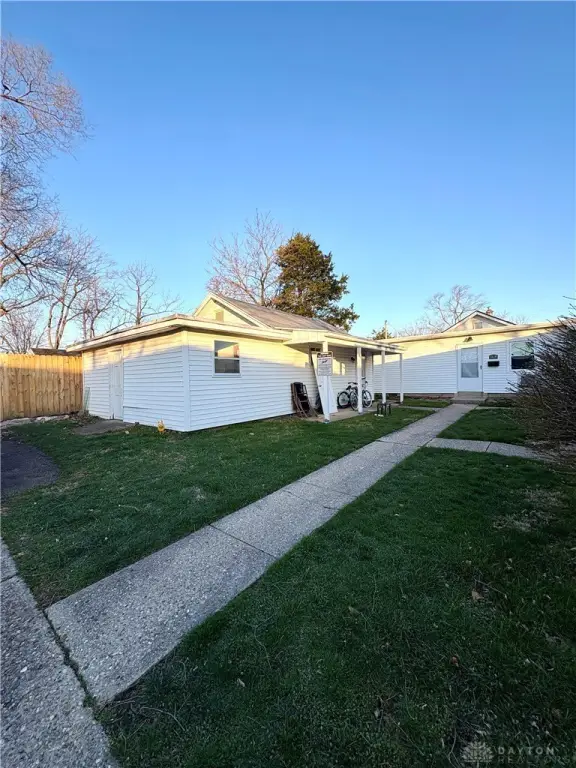
For Sale
$485,000
MULTI_FAMILY - Kettering, OH
Property Size4,377 SF
Lot Size0.39 Acres
Price / SF$110.81
Days on Market83
Property Features for 1830 Roslyn Avenue
General Information
- Property type
- Residential Multi Family
- Property subtype
- Other
- Zoning
- Residential
- Bedrooms
- 6
- Bathrooms
- 6
- Rooms
- Bedroom 1, Bathroom 2, Bathroom 1, Bedroom 3, Bathroom 5, Bedroom 5, Bathroom 3, Bathroom 6, Bathroom 4, Bedroom 6, Basement, Bedroom 4, Bedroom 2
- Parking features
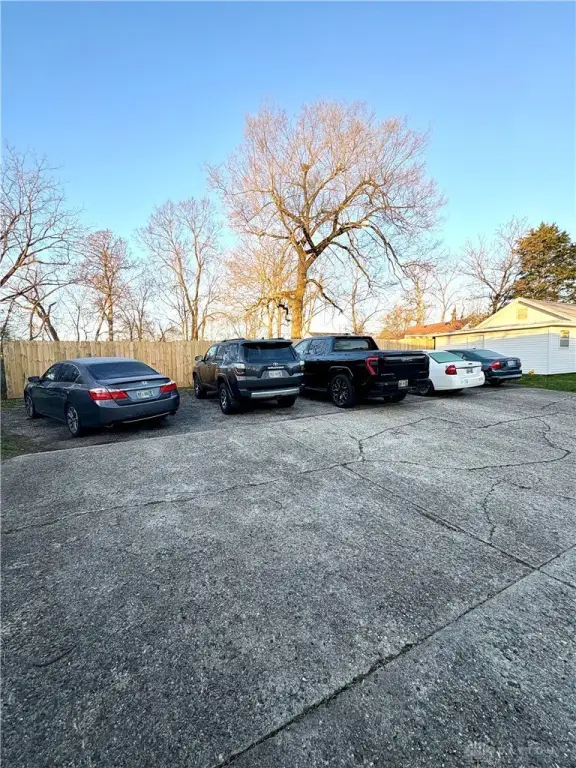
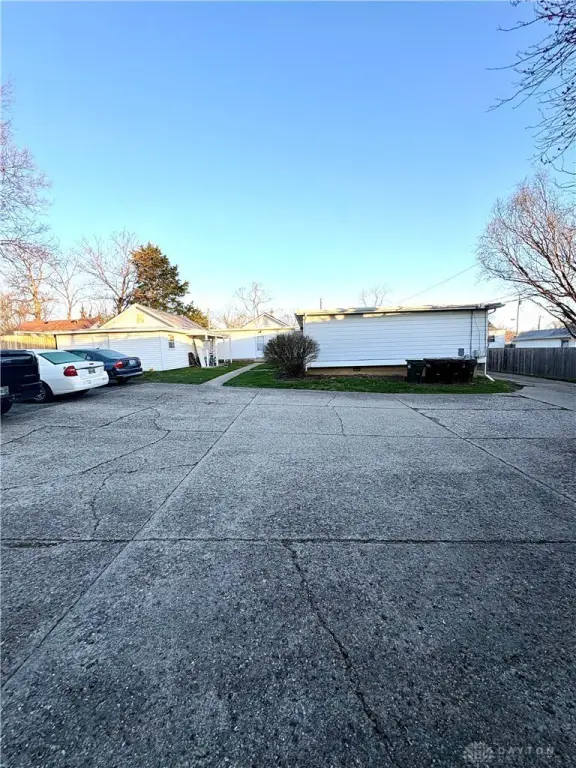
- Parking Lot
- Exterior features
- Fence
- Fencing
- Fenced
- Appliances
- Range, Refrigerator
- Standard status
- Active
- APN
- N64-01902-0091
- Size
- 4,377 SF
- Lot size
- 0.39 Acres
Taxes and HOA fees
- Tax Description
- 138 OAKDALE
Utilities
- Heating system
- Natural Gas
- Cooling system
- Window Unit(s)
- Water source
- Public
Building Details
- Year built
- 1937
- Floors in Building
- 1
- Number of units
- 5
- Building materials
- AluminumSiding, VinylSiding
Listing Agency:
Keller Williams Community Part
(937) 530-4904
Listed By:
Ryan Gillen
(937) 673-0830
Added: May 5
Changed: Jul 25
Last Checked: Jul 26 at 4:06PM
MLS# 958431
Copyright © 2026 Dayton Realtors. All rights reserved. All information provided by the listing agent/broker is deemed reliable but is not guaranteed and should be independently verified.
Investment Insights
Based on property information with market context.
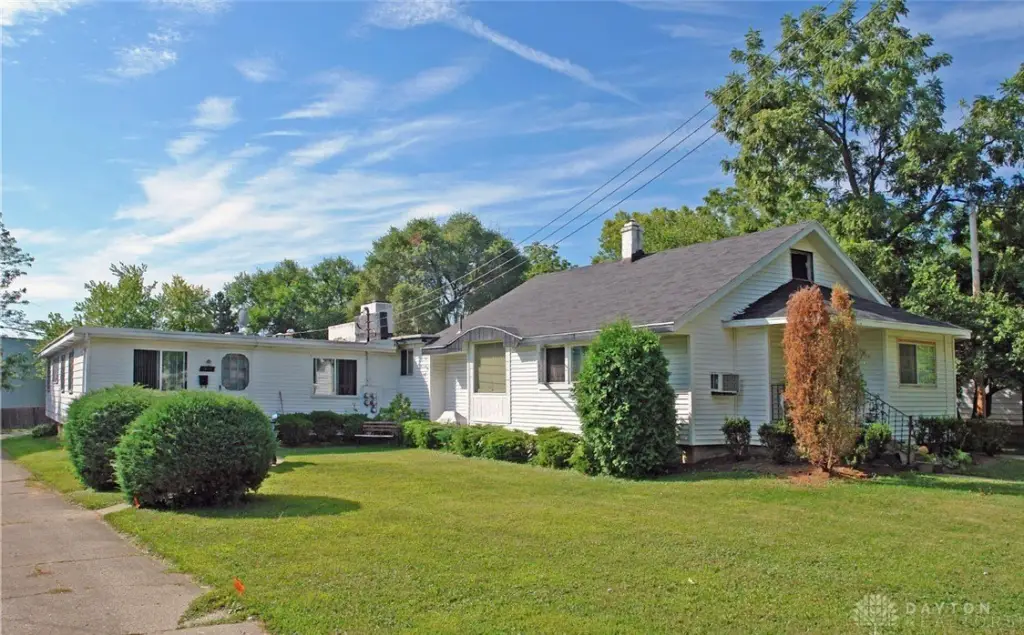
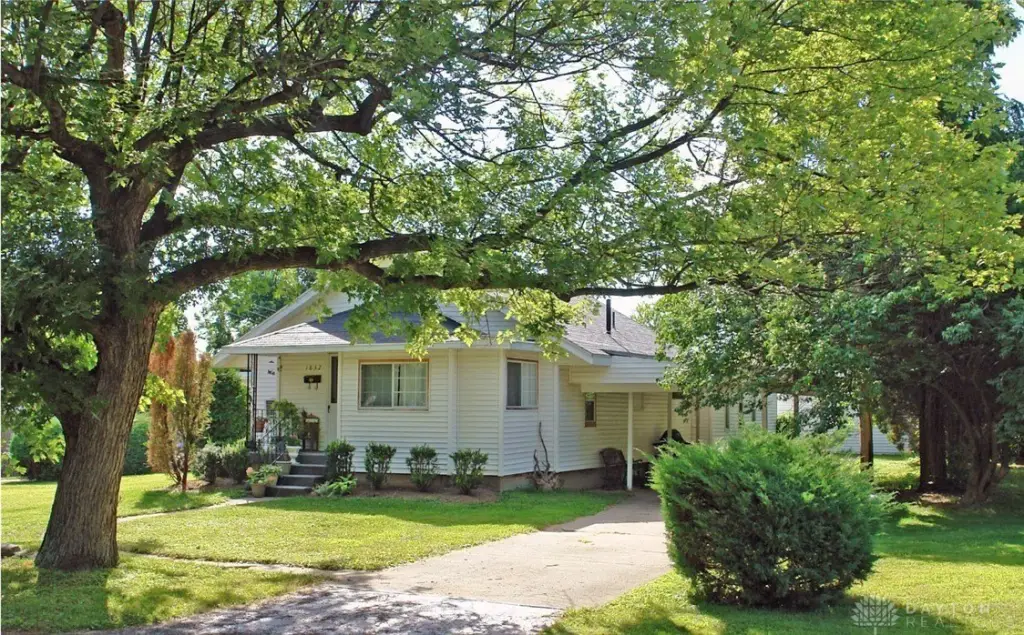
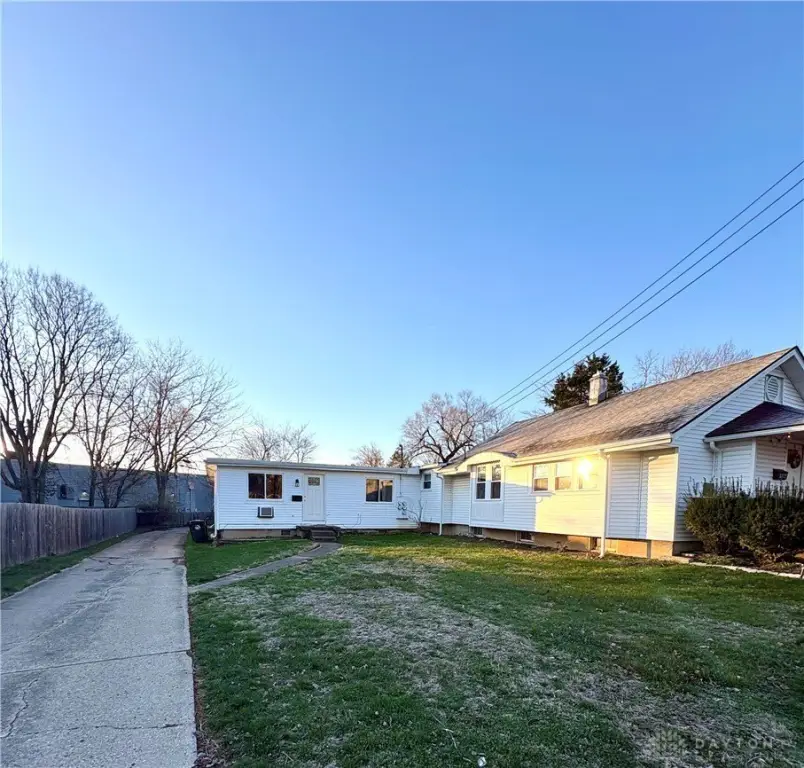
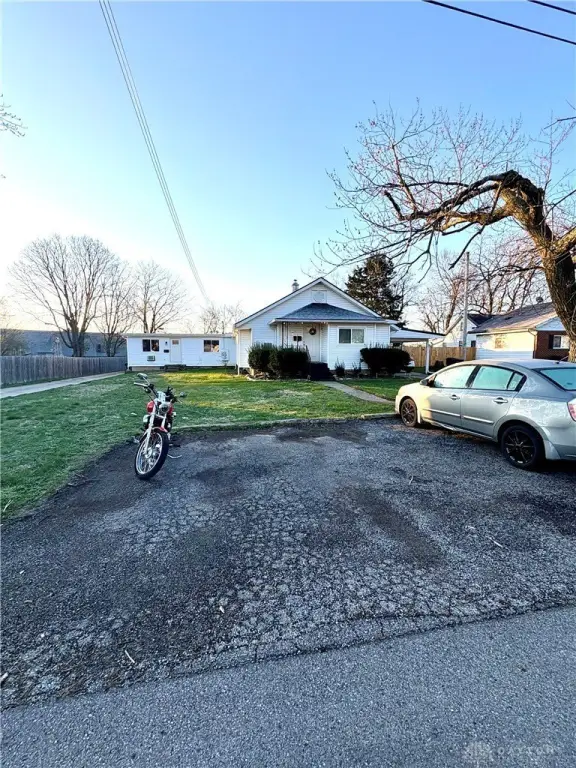
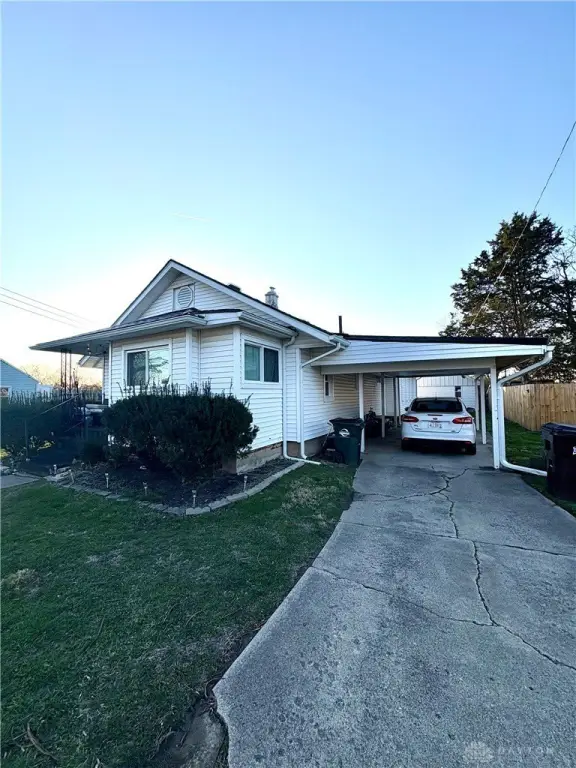
This residential income property is a fully occupied 5-unit building. The layout includes a 2-bedroom single-family home positioned at the front and four additional units, each with 1 bedroom and 1 bathroom. Tenants are responsible for electric and gas. Water and trash are billed back monthly, providing an operating structure that separates utilities from the landlord-billed expenses.
The property is located in Kettering, close to shopping, dining, and major conveniences. The units are currently leased, supporting immediate occupancy for the next owner.
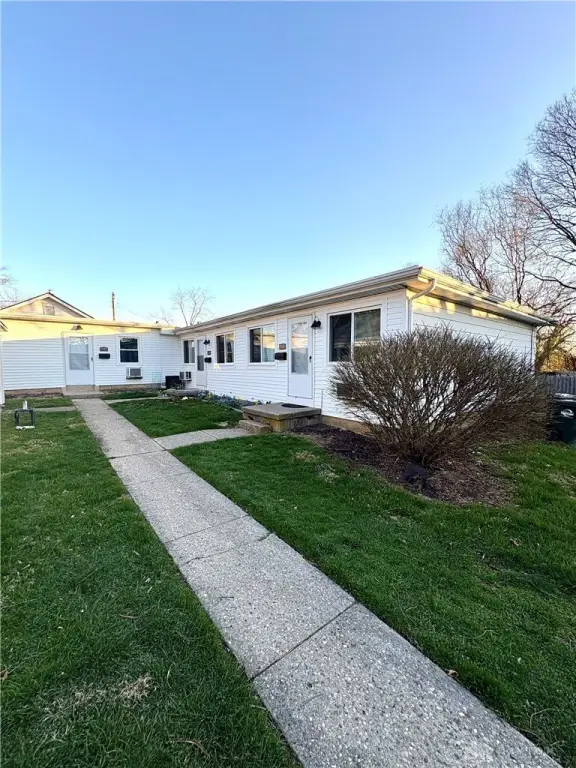
With all five units leased, the configuration provides a straightforward rental mix: one larger 2-bedroom residence at the front and four smaller 1-bedroom, 1-bath units positioned alongside it within the same property.
The property is located in Kettering, close to shopping, dining, and major conveniences. The units are currently leased, supporting immediate occupancy for the next owner.
With all five units leased, the configuration provides a straightforward rental mix: one larger 2-bedroom residence at the front and four smaller 1-bedroom, 1-bath units positioned alongside it within the same property.
Key Highlights
- Fully occupied 5‑unit property with all units currently leased
- Front 2‑bedroom single‑family home plus four additional 1‑bedroom, 1‑bath units
- Heating: natural gas; cooling: window unit(s)
Financial Insights For Apartment 5plus
Simulate Cap Rate and NOI
NOI Build-Up
- Vacancy
- income lost from leasable area expected to sit empty during the year — subtracted from gross rent.
- EGI (Effective Gross Income)
- gross rent minus vacancy losses — the realistic income before paying operating costs.
- OpEx (Operating Expenses)
- recurring costs to operate the property (property tax, insurance, utilities, maintenance, management) — excludes financing and capital improvements.
- NOI (Net Operating Income)
- income a property generates after operating costs but before financing and taxes.
| Component | $ | $/SF |
|---|---|---|
| Gross rent | $70.9k | $16.20 |
| − Vacancy | −$3.1k | −$0.71 |
| EGI | $67.8k | $15.49 |
| − OpEx | −$30.5k | −$6.97 |
| NOI | $37.3k | $8.52 |
4,377 SF · lease $16.20/SF/yr · vacancy 4.40% · expense 45.00%
Alternative Uses
Best Use
Apartment 5plus
$532.6K
$466.0K – $621.4K
NOI $37,283 @ 7.0% cap · market cap 7.69%
Second Best
—
—
no second resolved use
Theoretical Best
Office B
$823.0K
$720.1K – $960.2K
NOI $57,610 @ 7.0% cap · market cap 11.88%
Zoning and permitted uses should be independently verified with local authorities.
Property Analytics
Property Profile
Location Intelligence
Current Use by Public Records
Apartment buildings


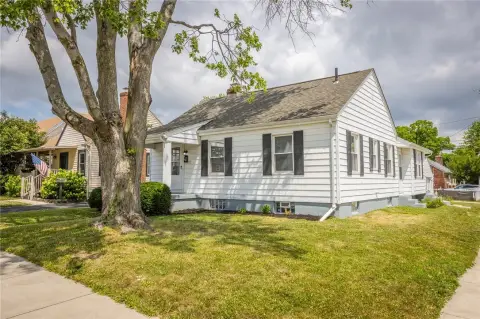

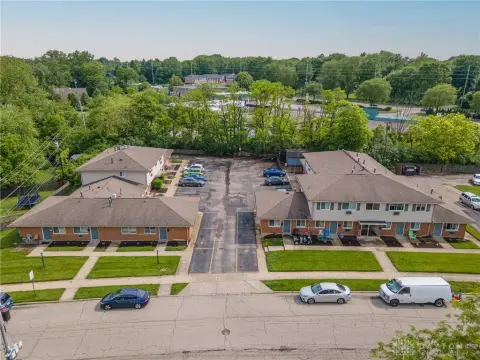


FAQs
What type of property is this?
Apartment building - Fully occupied 5-unit building with a front 2-bedroom home and four 1-bedroom, 1-bath units.
Where is this apartment building located?
The property is located at 1830 Roslyn Avenue Kettering, OH.
What is the asking price?
The asking price for this property is $485,000.
What are key features of this property?
This property features: Fully occupied 5‑unit property with all units currently leased; Front 2‑bedroom single‑family home plus four additional 1‑bedroom, 1‑bath units; Heating: natural gas; cooling: window unit(s)