Three-Unit Federal
For Sale
$1,975,000
1768 WILLARD Street NW, Washington, DC 20009
Multi-Family, WASHINGTON, DC
Property Size3,665 SF
Lot Size0.03 Acres
Price / SF$538.88
Days on Market92
Property Features for 1768 WILLARD Street NW
General Information
Property type
Residential Multi Family
Property subtype
Other
Rooms
Dining Room, Family Room, Basement
Parking features
Off Street
Interior features
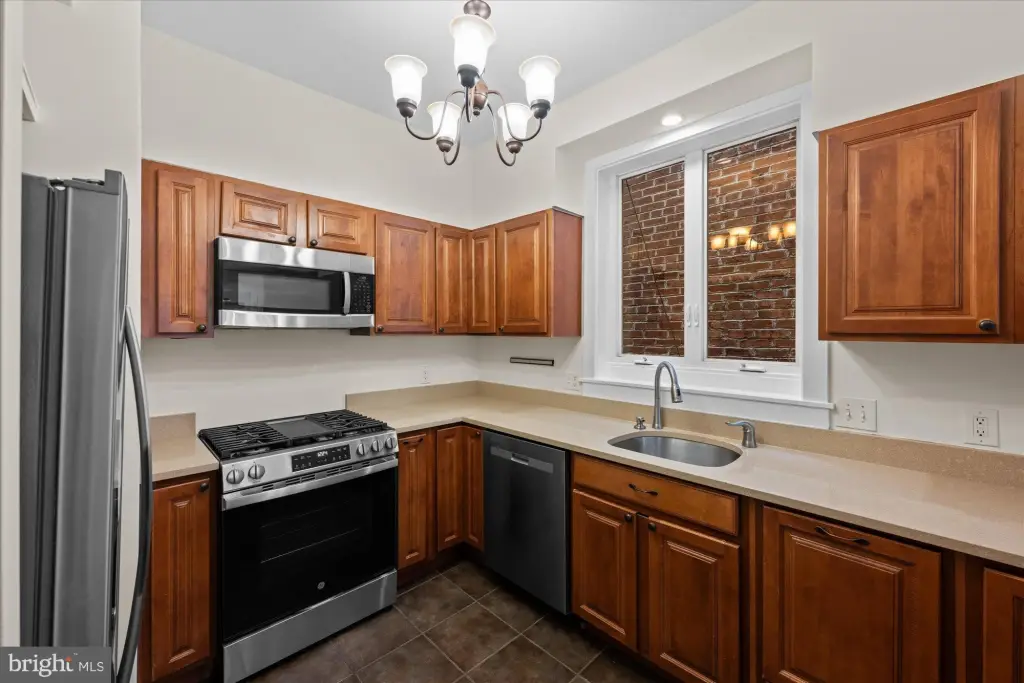
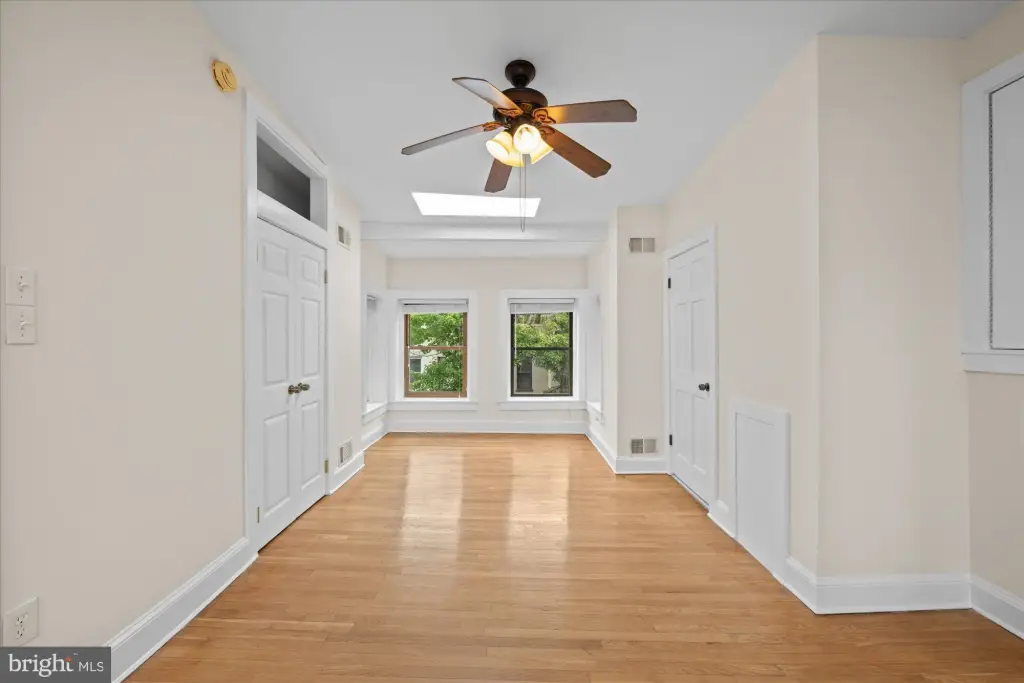
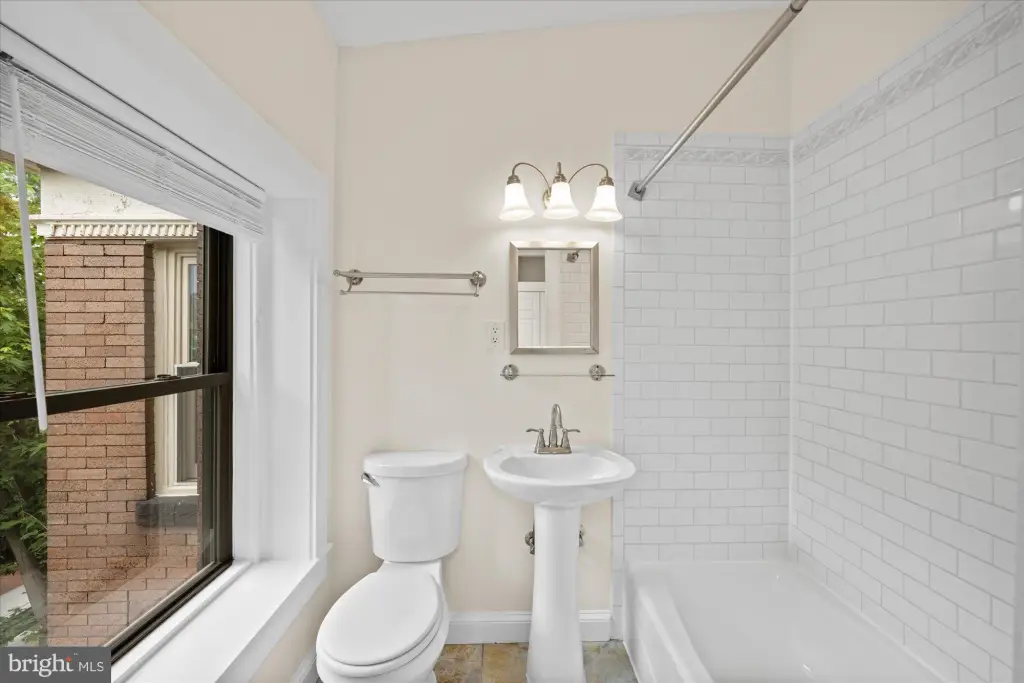
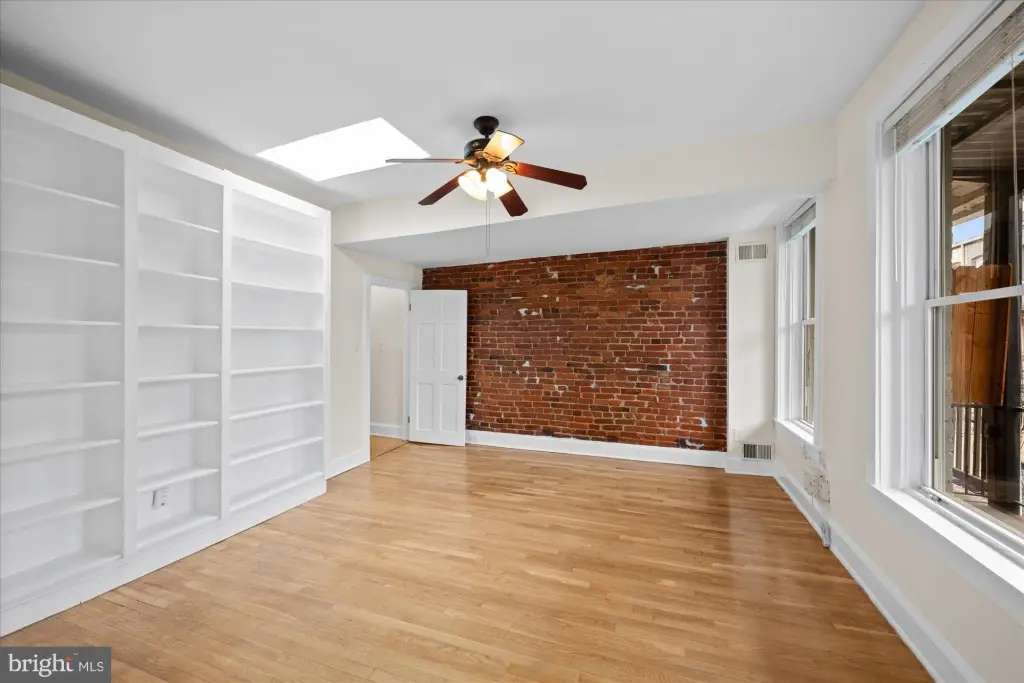
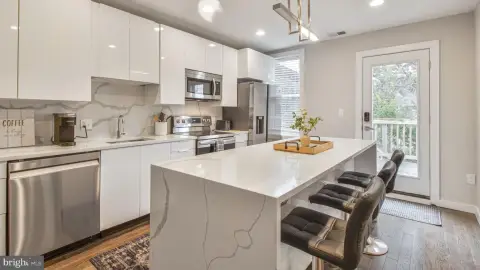
Ceiling Fan(s), Bathroom - Tub Shower, Breakfast Area, Built-Ins, Combination Dining/Living, Dining Area, Entry Level Bedroom, Family Room Off Kitchen, Kitchen - Gourmet, Primary Bath(s), Skylight(s), Wood Floors
Fireplace
1
Appliances
Oven/Range - Gas, Built-In Microwave, Refrigerator, Dishwasher, Disposal, Washer, Dryer
Subdivision
OLD CITY #2
Elementary school district
DISTRICT OF COLUMBIA PUBLIC SCHOOLS
Middle school district
DISTRICT OF COLUMBIA PUBLIC SCHOOLS
High school district
DISTRICT OF COLUMBIA PUBLIC SCHOOLS
Standard status
Active
Size
3,665 SF
Lot size
0.03 Acres
Taxes and HOA fees
Tax Annual Amount
12925
Utilities
Heating system
Forced Air
Cooling system
Central Air
Amenities
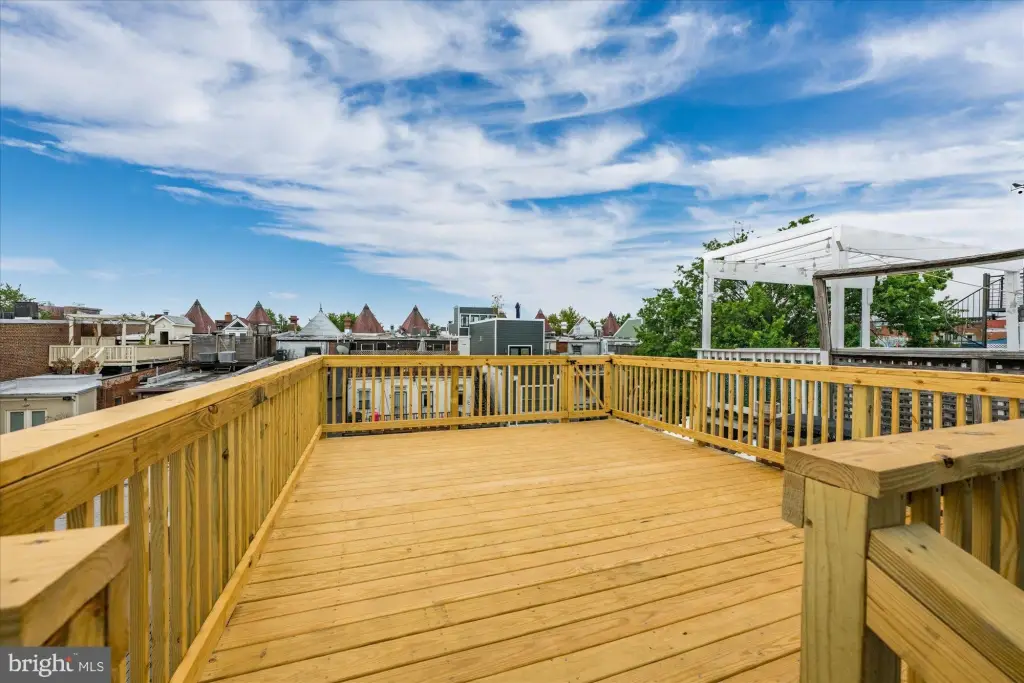
rooftop deck
wood-burning fireplace
Building Details
Year built
1925
Number of units
3
Building materials
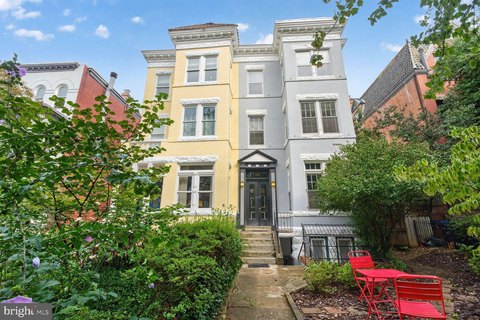
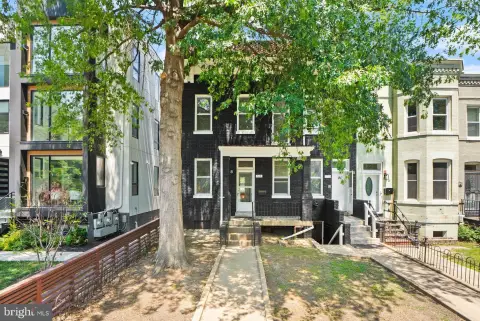
Brick
Architectural style
Federal
Listing Agency:
Washington Fine Properties, LLC
(202) 333-3320
Listed By:
Nathan J Guggenheim · License #SP98364671
(202) 944-5000
Added: Jul 9
Changed: Sep 16
Last Checked: Oct 8 at 6:06AM
MLS# DCDC2272372
Copyright © 2026 Bright MLS. All rights reserved. All information provided by the listing agent/broker is deemed reliable but is not guaranteed and should be independently verified.
Investment Insights
Based on property information with market context.
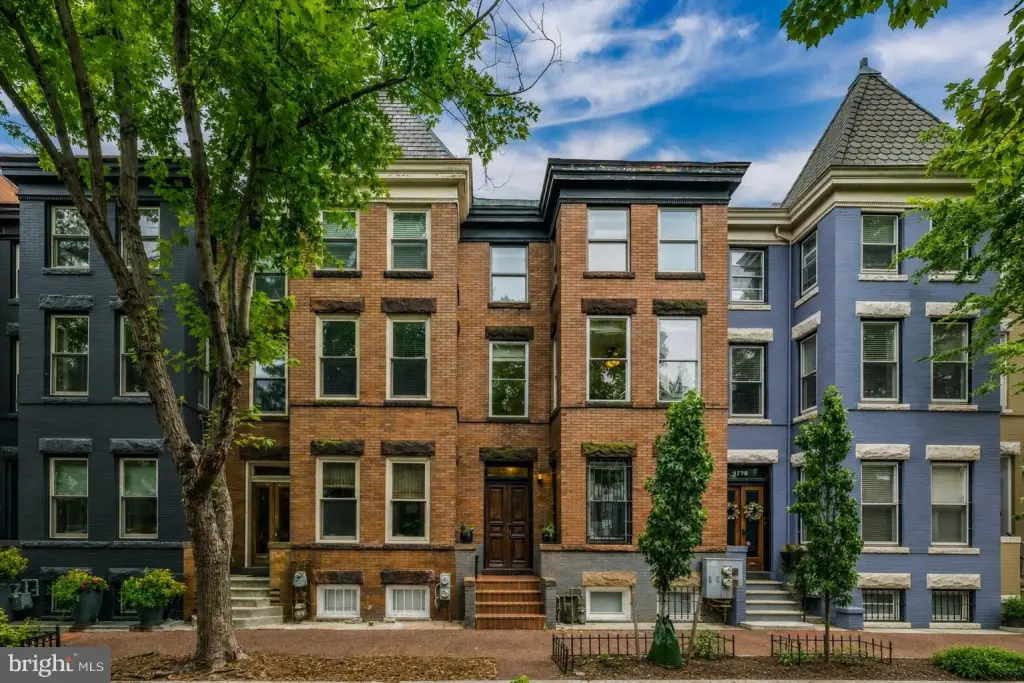
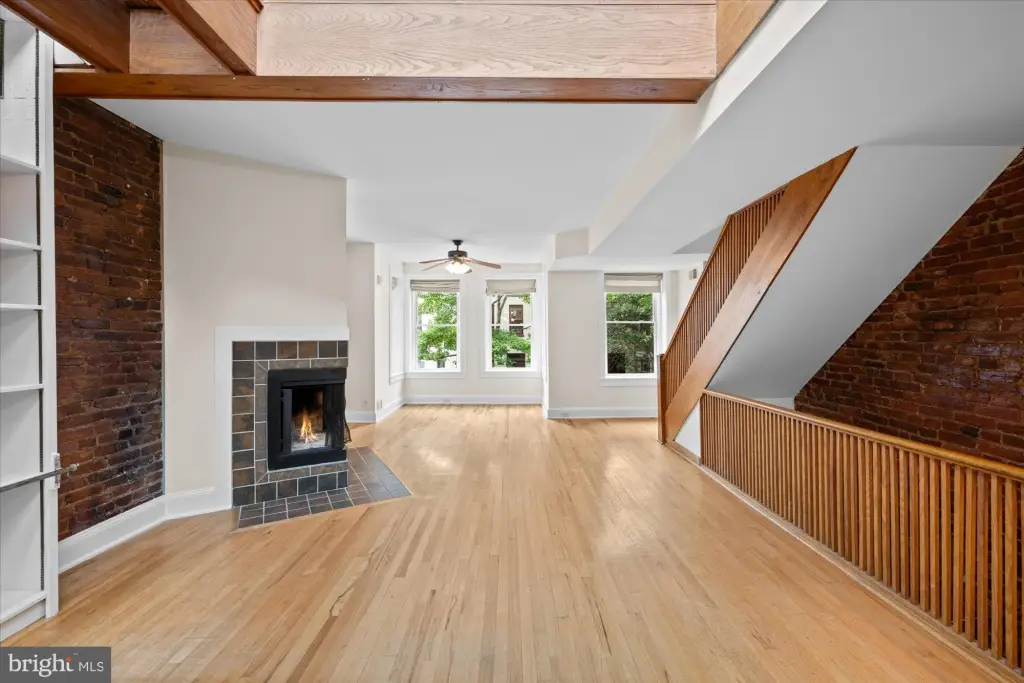
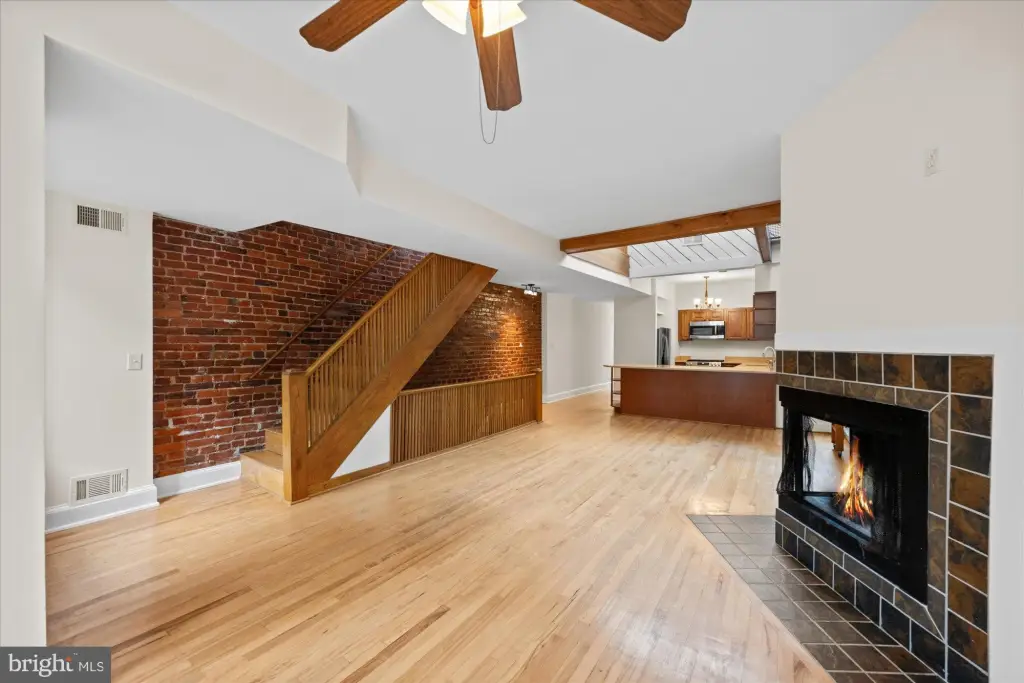
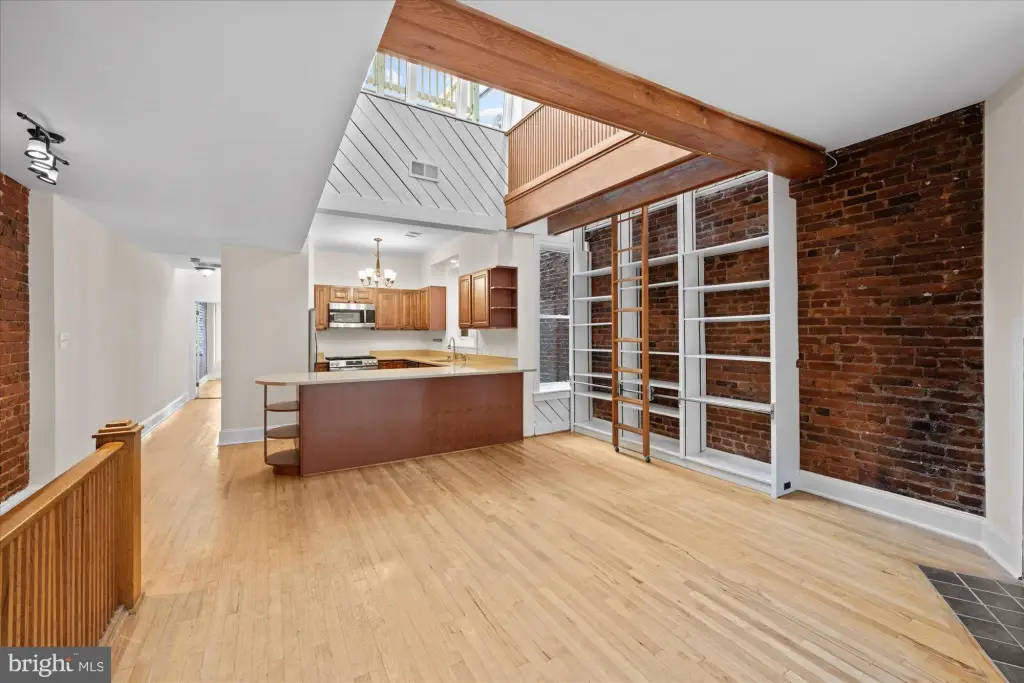
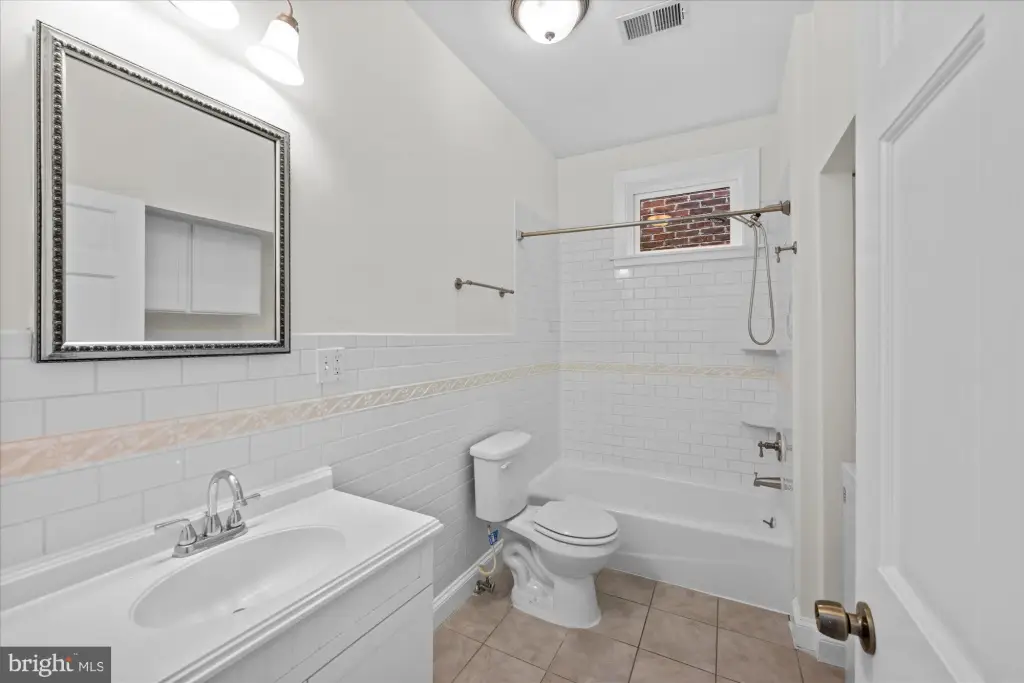
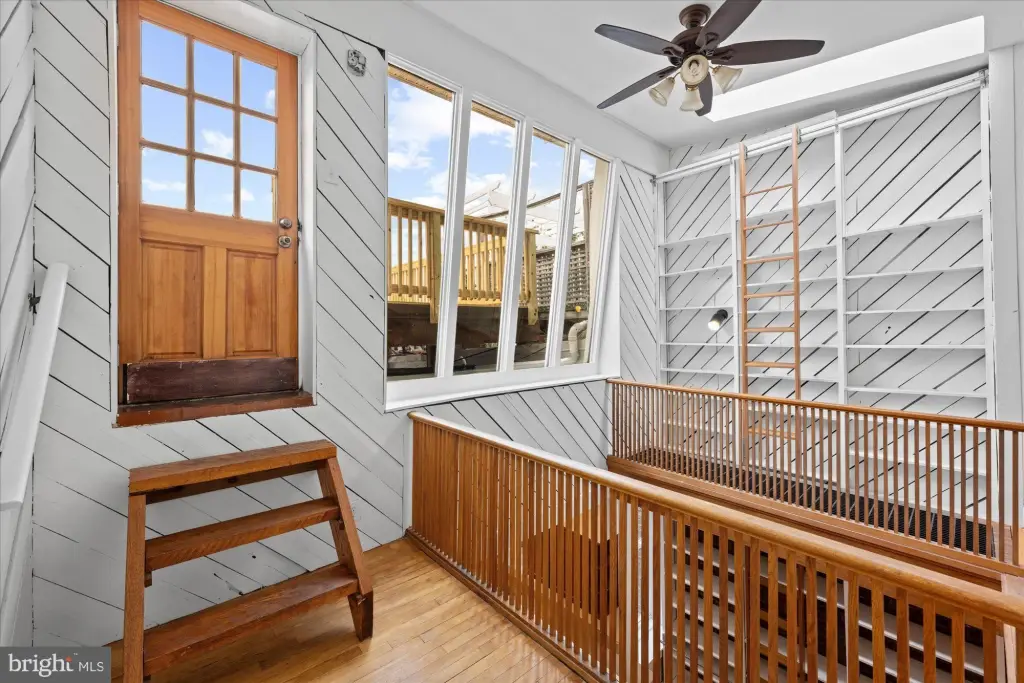
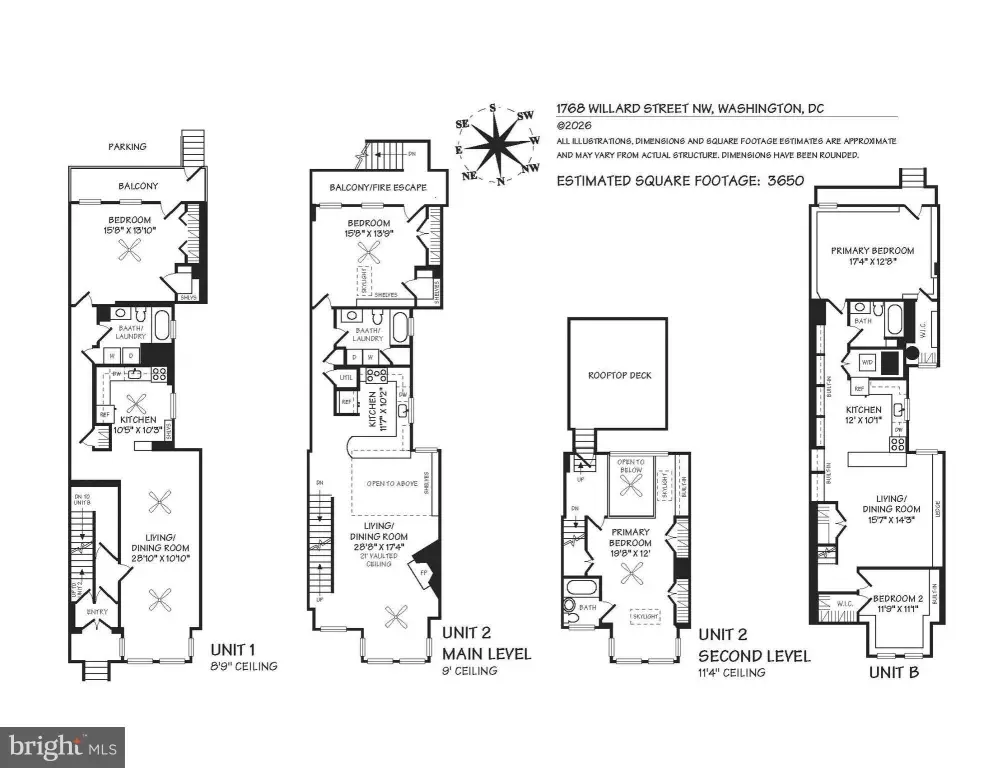
This 3,665-square-foot brick Federal townhouse, built in 1925, is arranged as three separate residences. The lower apartments include a two-bedroom, one-bath unit and a one-bedroom, one-bath unit. The owner’s residence occupies the top two levels and features vaulted ceilings, an open kitchen, wood-burning fireplace, wood floors, and a primary suite with direct rooftop-deck access. Central air, forced-air heating, and off-street parking are also provided.
The property sits on a 0.0347-acre lot at 1768 Willard Street NW in Washington, DC. Dupont Circle, Adams Morgan, Logan Circle, and the 14th Street corridor are nearby, along with restaurants, cafes, retail, parks, Metro access, and cultural destinations. The Federal architectural style and multi-residence layout combine period character with flexible occupancy arrangements.
The property sits on a 0.0347-acre lot at 1768 Willard Street NW in Washington, DC. Dupont Circle, Adams Morgan, Logan Circle, and the 14th Street corridor are nearby, along with restaurants, cafes, retail, parks, Metro access, and cultural destinations. The Federal architectural style and multi-residence layout combine period character with flexible occupancy arrangements.
Key Highlights
- 3,665‑square‑foot triplex on a 0.0347‑acre lot
- Two‑bedroom, one‑bath apartment plus one‑bedroom, one‑bath apartment
- Owner’s residence spans the top two levels
Financial Insights
Estimated NOI and Cap Rate
NOI / Yr
$80,005
Cap Rate
4.05%
Suggested Prices Based on Cap Rates
Cap Rate 5%
$1,600,100
$1.6M
Cap Rate 7%
$1,142,929
$1.1M
Cap Rate 9%
$888,944
$888.9K
Market Conditions
NOI Build-Up for 3,665 SF
Gross rent
$120.9K $33.00/SF
− Vacancy
−$6.7K −$1.82/SF
EGI
$114.3K $31.19/SF
− OpEx
−$34.3K −$9.36/SF
NOI
$80.0K $21.83/SF
Area
ZIP 20009
Vacancy
5.50%
Lease Rate
$33.00 /SF/Yr
Expense Ratio
30.00%
Simulate Cap Rate and NOI
Suggested Prices Based on Cap Rates
Cap Rate 5%
$1,600,100
Cap Rate 7%
$1,142,929
Cap Rate 9%
$888,944
Alternative Uses
Best Use
Multifamily LT 5
$1.14M
$1.00M – $1.33M
NOI $80,005 @ 7.0% cap · market cap 4.05%
Second Best
Apartment 5plus
$1.02M
$891.5K – $1.19M
NOI $71,320 @ 7.0% cap · market cap 3.61%
Theoretical Best
Office A
$1.89M
$1.65M – $2.20M
NOI $131,961 @ 7.0% cap · market cap 6.68%
Zoning and permitted uses should be independently verified with authorities.
Property Analytics
Unlock full access to Insights
Subscribe to Realmo Intelligence
Open Analytics
Current Use
Lease Details
3
Residential units
Location Intelligence
Trade Area within ½ mile
7,539
Businesses Nearby
Explore this area
Business Placement
Demographics for 20009, DC
53,357
Population
31,824
Households
1.7
Avg Household Size
34
Median Age
84%
College-Educated
97%
High-School Grad
1.3 sq mi
ZIP Area
41,044
Density / Sq Mi
$140,555
Median Household Income
$99,606
Median Earnings
$2,346
Median Rent
$727,800
Median Home Value
Check the figures for this property
Cap Rate, Value Estimation, Potential NOI and more
View Realmo Analytics
Market
Vacancy Rate% for Multifamily in South region

Questions? Ask Rey
Realmo’s AI knows this listing — price, zoning, demand, history. Ask anything.



Frequently Asked Questions
What type of property is this?
Triplex - Three separately configured residences include two rental apartments and a top-level owner’s unit.
Where is this triplex located?
The property is located at 1768 WILLARD Street NW Washington, DC.
What is the asking price?
The asking price for this property is $1,975,000.
What are key features of this property?
This property features: 3,665‑square‑foot triplex on a 0.0347‑acre lot; Two‑bedroom, one‑bath apartment plus one‑bedroom, one‑bath apartment; Owner’s residence spans the top two levels


