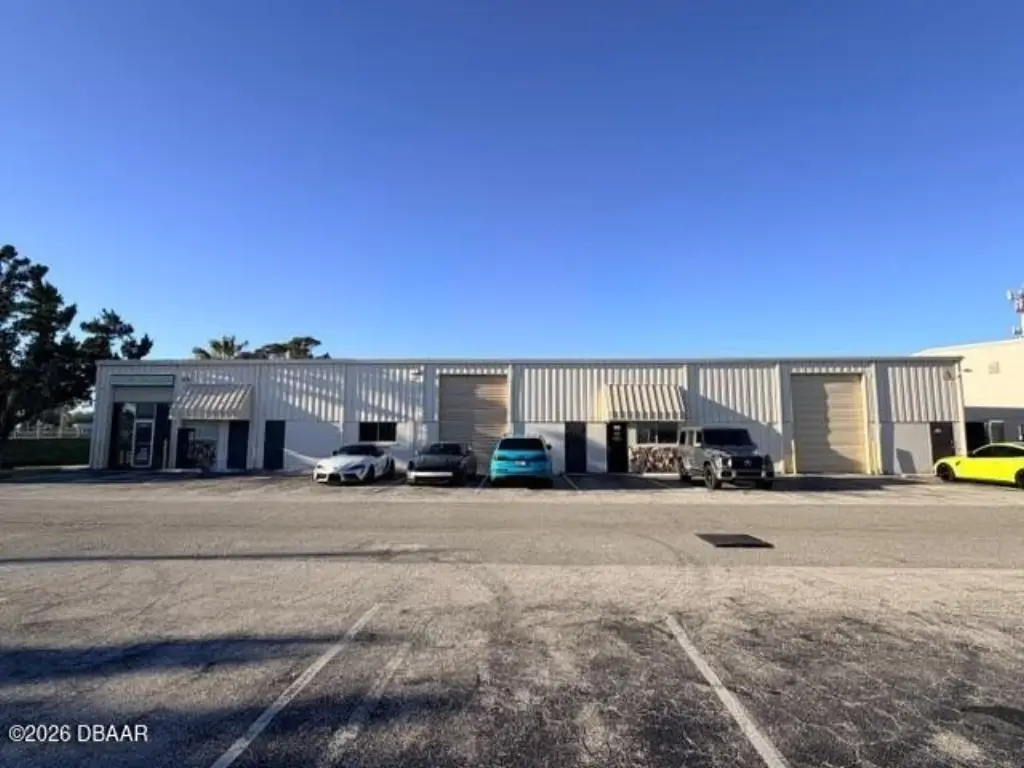
Versatile Flex Property in South
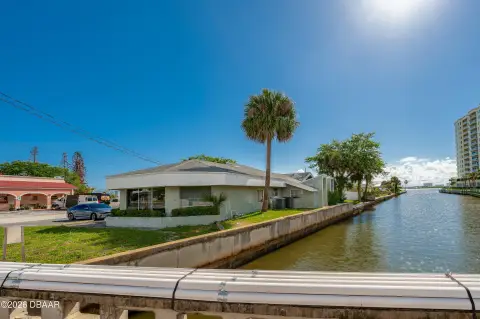
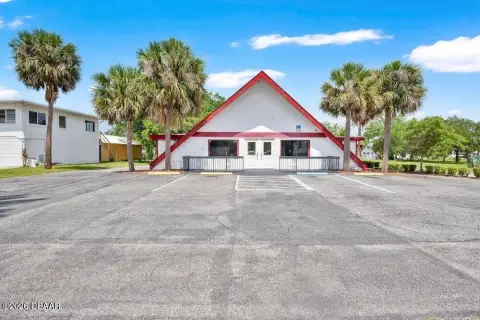
1725 S Nova Road South Daytona, FL 32119
For Sale
$1,300,000
COMMERCIAL - South Daytona, FL
Property Size10,000 SF
Lot Size0.02 Acres
Price / SF$130
Days on Market190
Property Features for 1725 S Nova Road
General Information
Property type
Commercial Sale
Property subtype
Other
Parking features
Parking Lot
Standard status
Active
APN
5341-10-00-0A10
Size
10,000 SF
Lot size
0.02 Acres
Taxes and HOA fees
Tax Year
2025
Tax Description
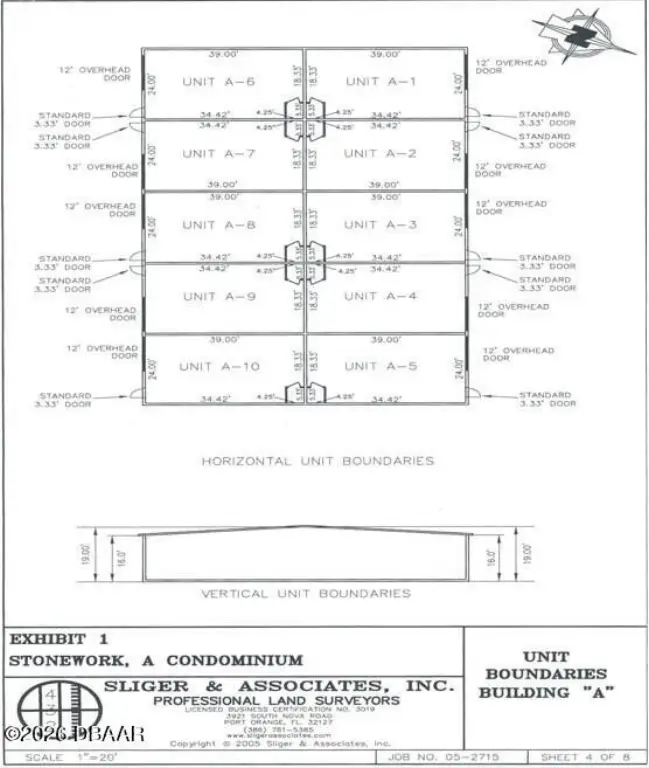
UNIT A-1-10 STONEWORK CONDO PER OR 5923 PG 3145 PER OR 5965 PG 1121 PER OR 6804 PG 1569
Tax Annual Amount
16749
Utilities
Sewer type
Public Sewer
Water source
Public
Building Details
Year built
1981
Listing Agency:
Realty Pros Commercial
(386) 253-8565
Listed By:
Kayla Williams · License #3506971
(386) 338-1330
Added: Jan 19
Changed: Apr 23
Last Checked: Jul 28 at 2:06AM
MLS# 1221941
Copyright © 2026 Daytona Beach Area Association of Realtors. All rights reserved. All information provided by the listing agent/broker is deemed reliable but is not guaranteed and should be independently verified.
Investment Insights
Based on property information with market context.
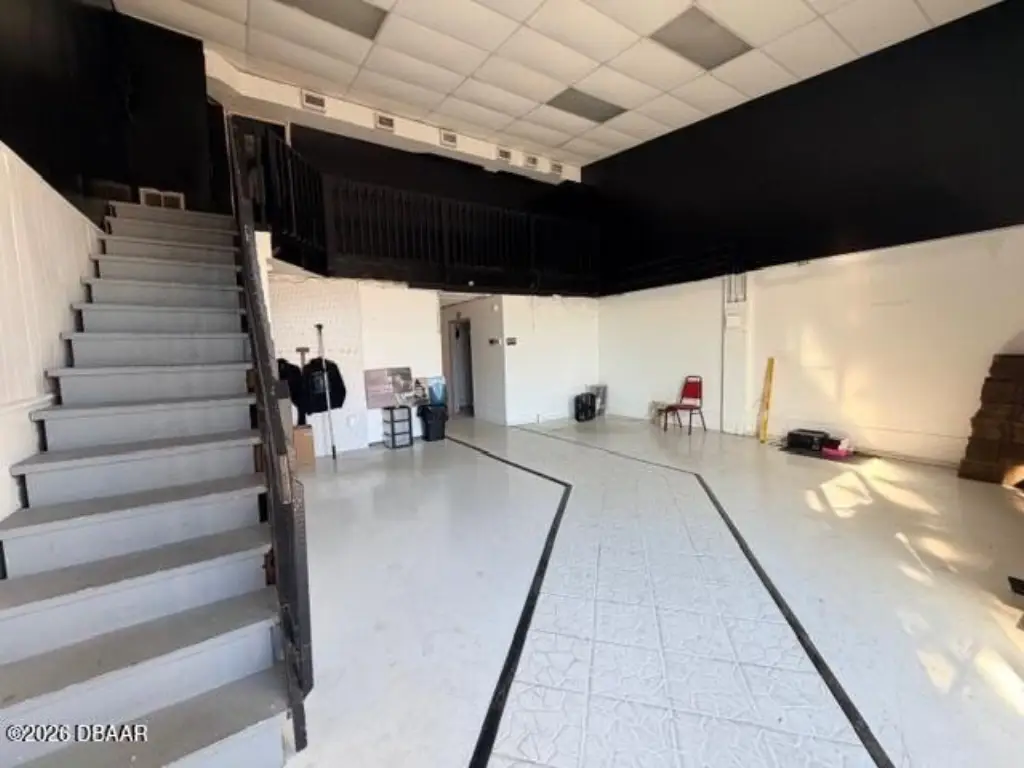
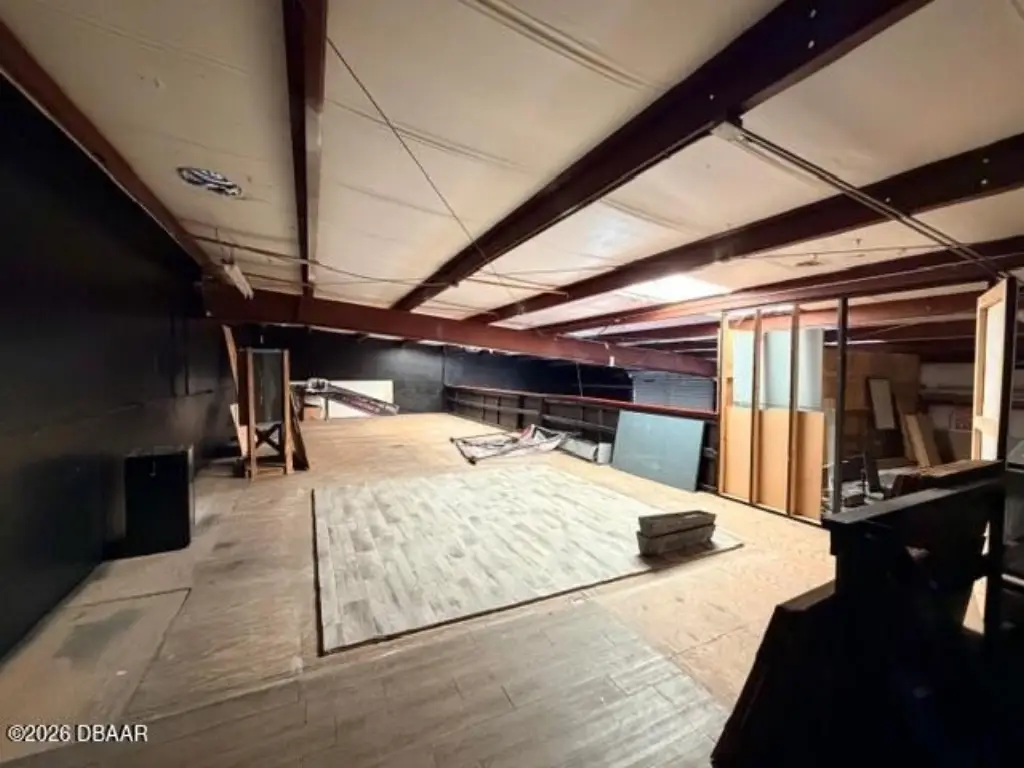
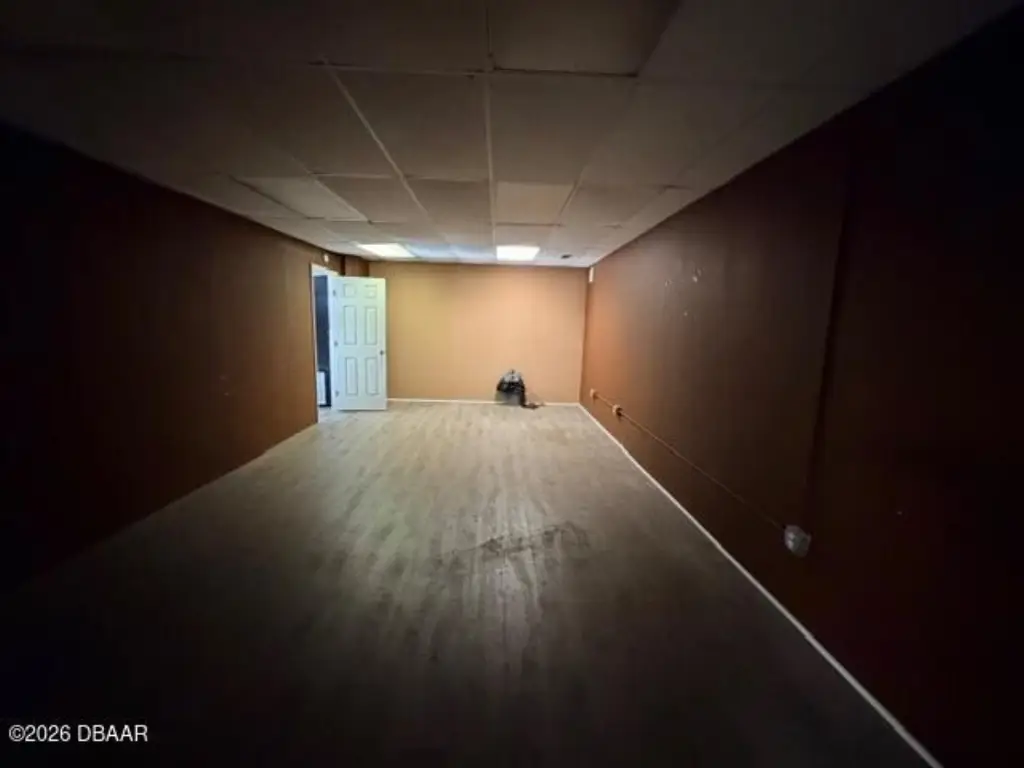
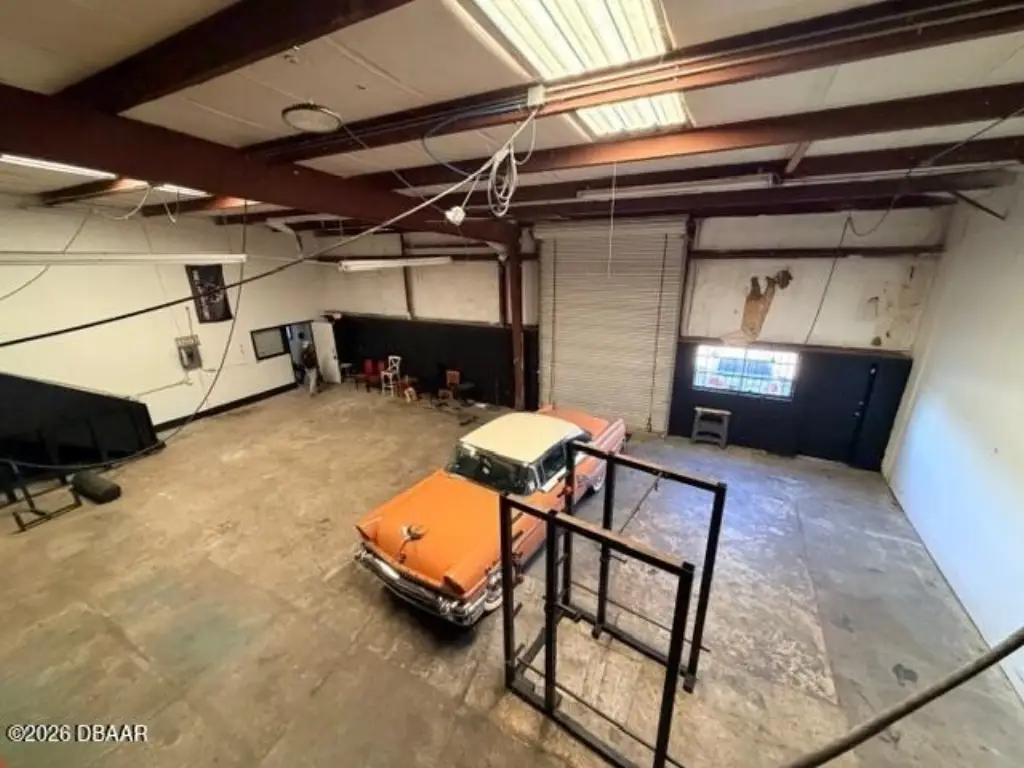
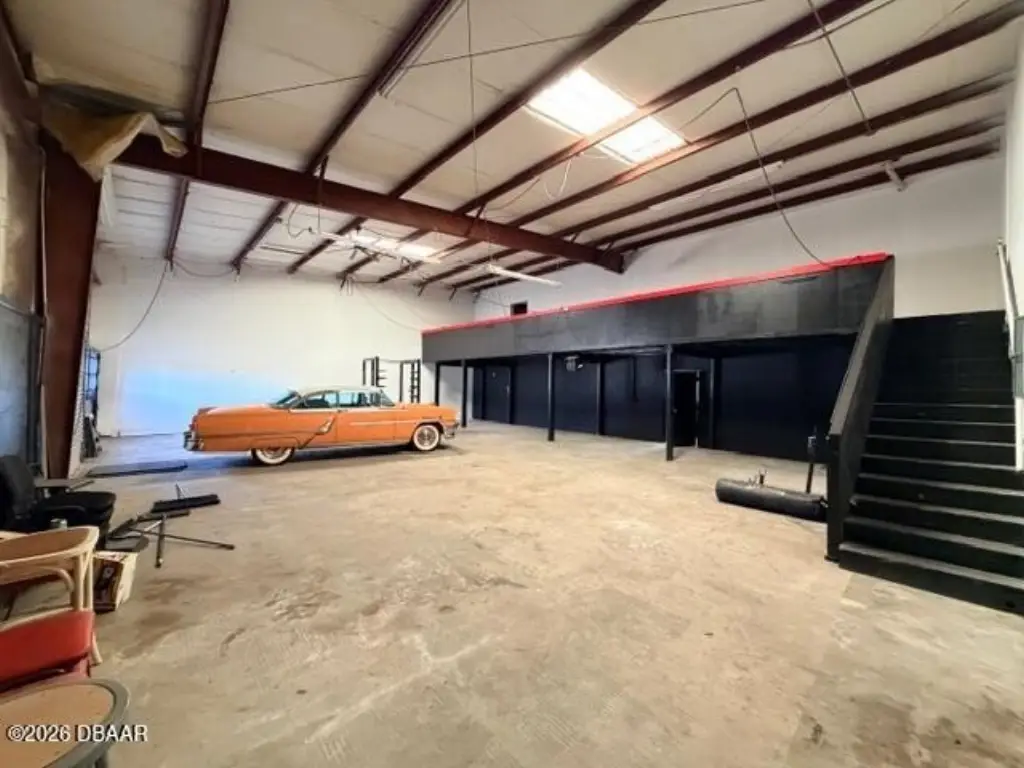
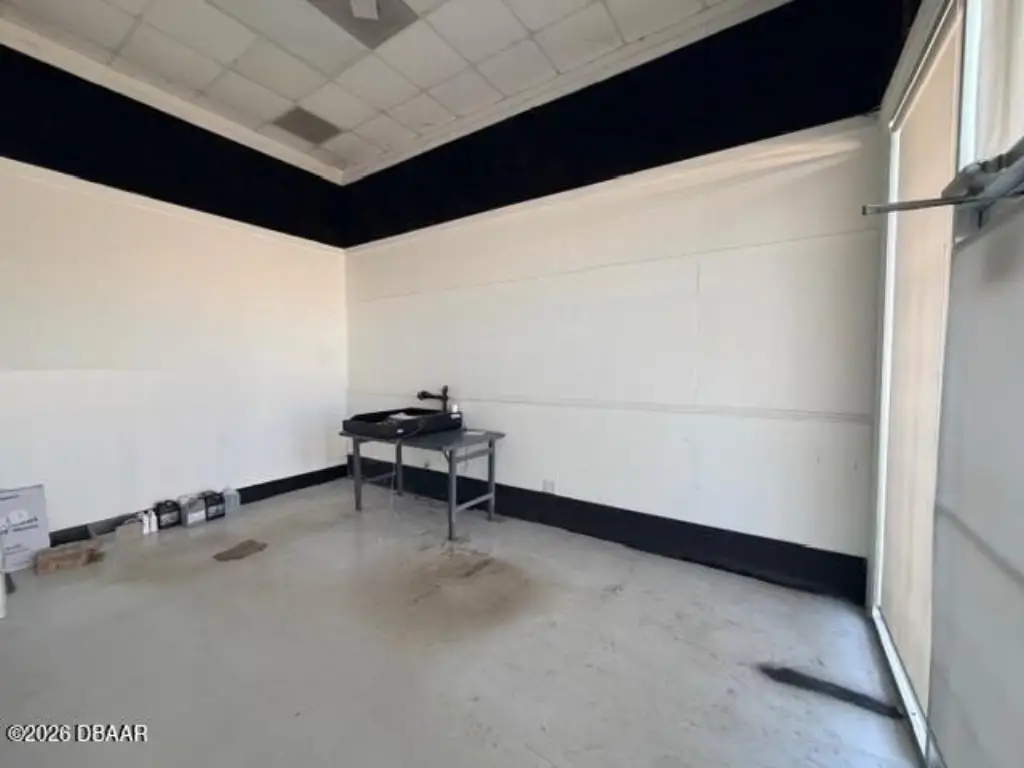
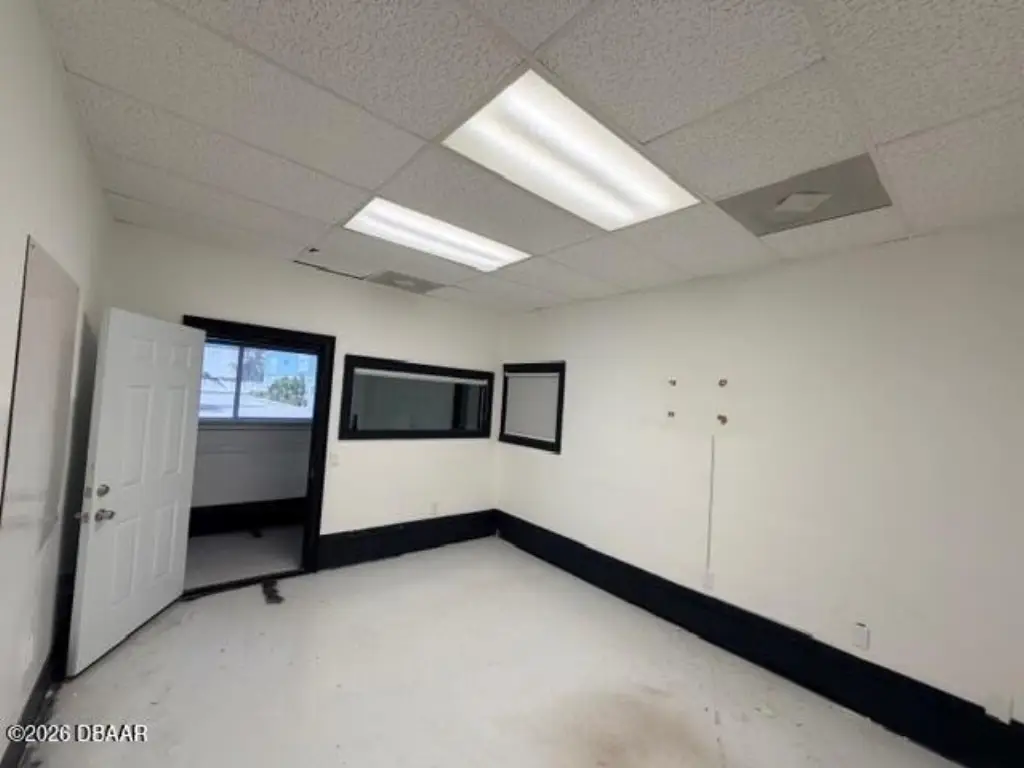
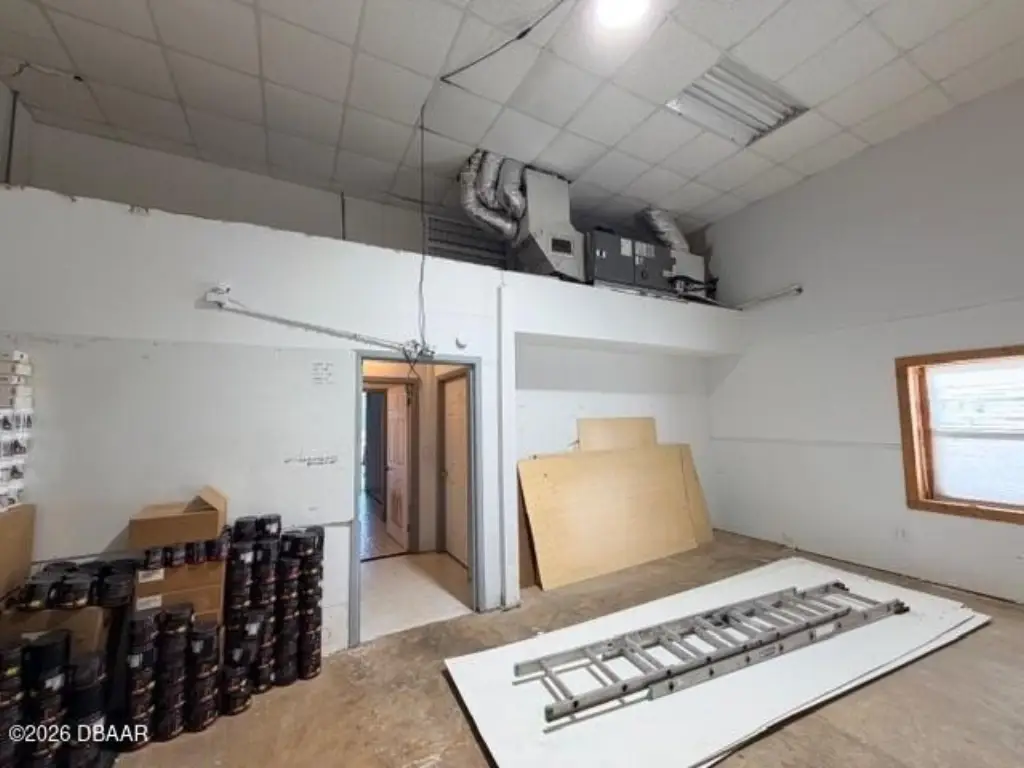
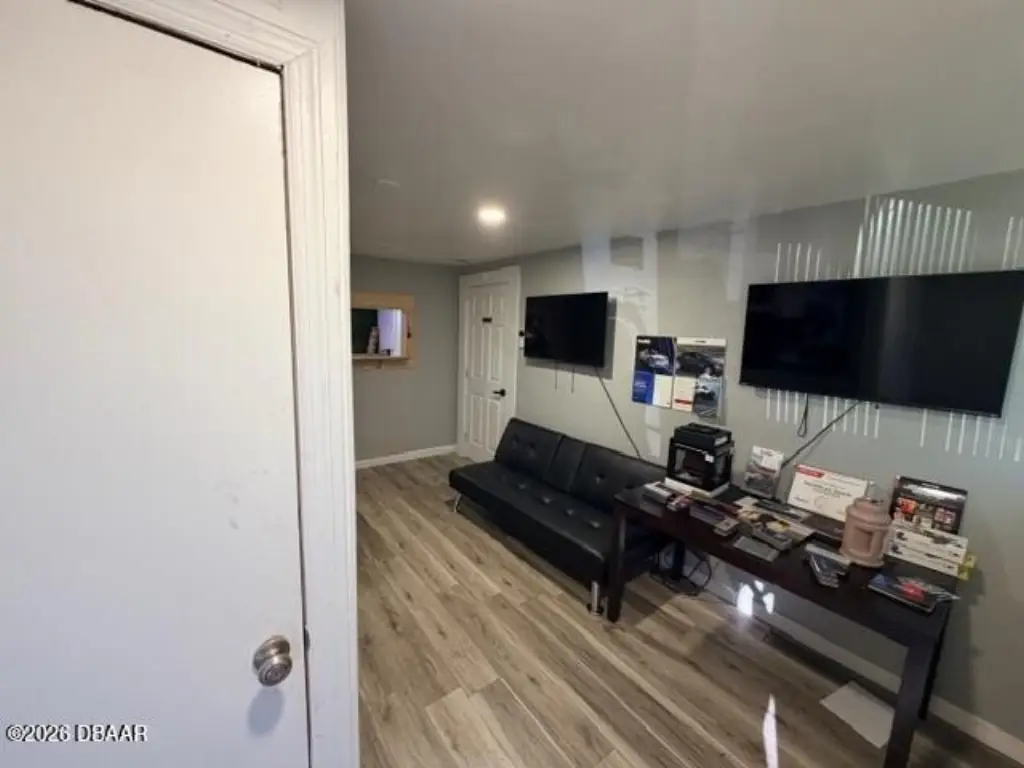
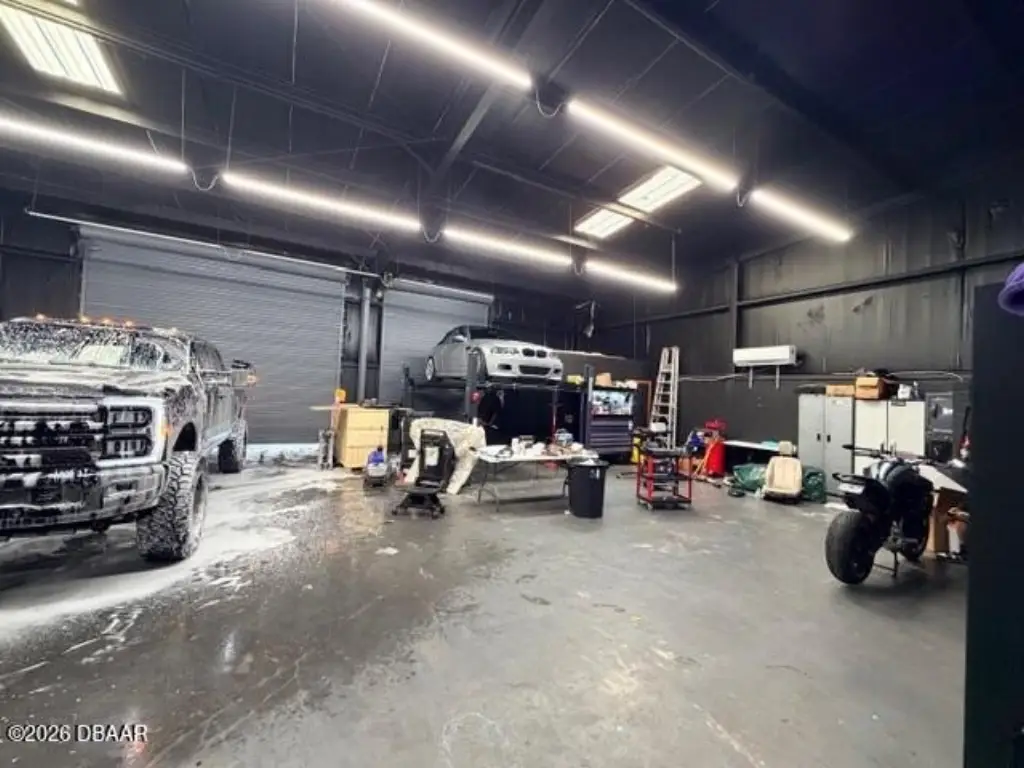
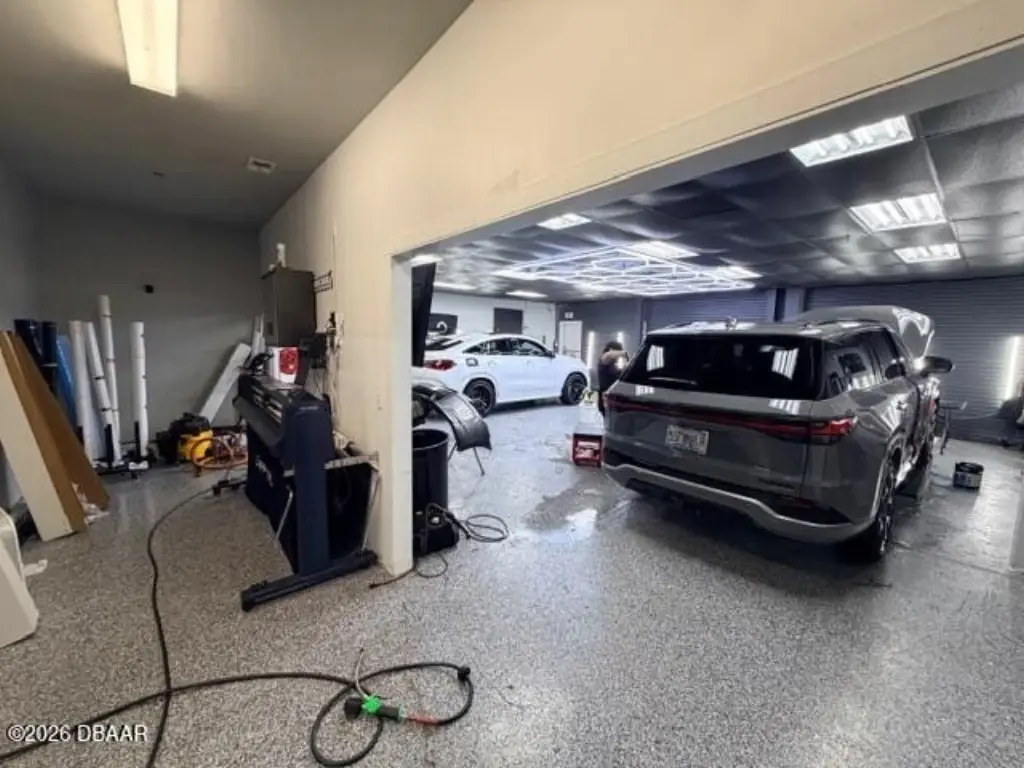
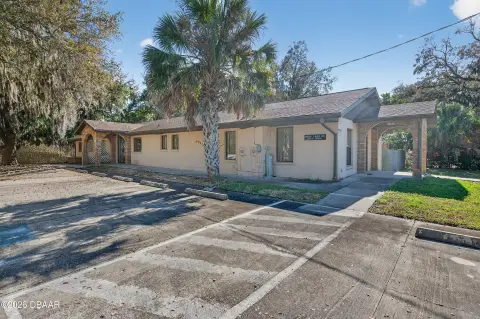
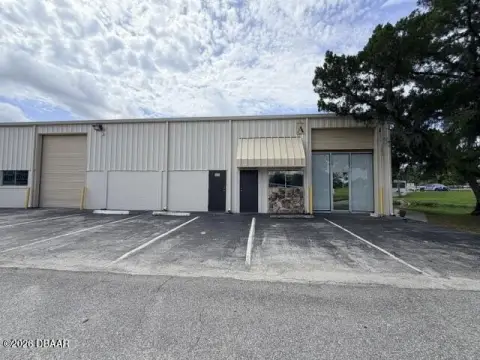
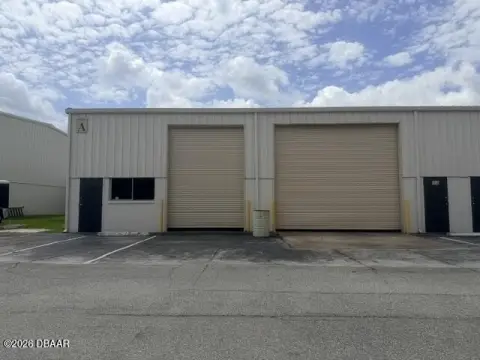
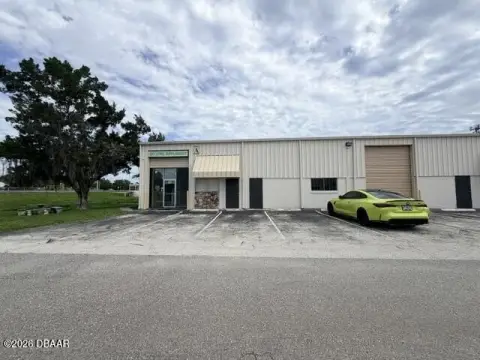
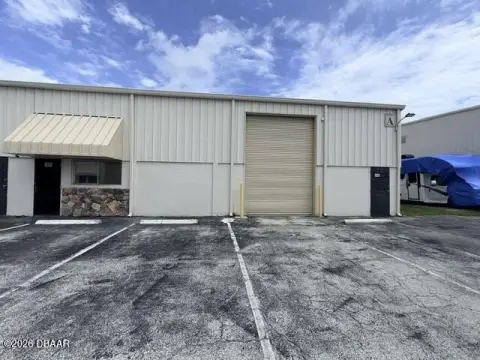
This +/-10,000 SF flex property presents an exceptional opportunity for investors or owner-users, offering outstanding versatility. The building can be purchased as a full asset or sold as individual units, creating multiple ownership and income-producing strategies. The current configuration includes a +/-2,000 SF warehouse with one overhead door and A/C, a +/-2,000 SF air-conditioned warehouse with two overhead doors, and +/-6,000 SF of mixed retail/office/warehouse space. The property consists of 10 parcel IDs and can be reconfigured into multiple layouts, including potential subdivision into up to 10 units based on need. The building is currently vacant, allowing for immediate occupancy or repositioning. It is ideal for warehouse, distribution, light manufacturing, or service-based uses. Positioned along a high-visibility corridor with approximately 29,500 AADT, the property provides easy access to I-95 and major thoroughfares. Located in South Daytona, Florida, within a condominium association where exterior maintenance is included, the property sits on a lot of approximately 0.02 acres.
Key Highlights
- +/-10,000 SF flex property suitable for warehouse, distribution, light manufacturing, or service‑based uses.
- High‑visibility location along a corridor with approximately 29,500 AADT and easy access to I‑95.
- Exceptional versatility for investors or owner‑users due to flexible configuration options.
Financial Insights For Flex RnD
Simulate Cap Rate and NOI
NOI Build-Up
- Vacancy
- income lost from leasable area expected to sit empty during the year — subtracted from gross rent.
- EGI (Effective Gross Income)
- gross rent minus vacancy losses — the realistic income before paying operating costs.
- OpEx (Operating Expenses)
- recurring costs to operate the property (property tax, insurance, utilities, maintenance, management) — excludes financing and capital improvements.
- NOI (Net Operating Income)
- income a property generates after operating costs but before financing and taxes.
| Component | $ | $/SF |
|---|---|---|
| Gross rent | $189.6k | $18.96 |
| − Vacancy | −$16.1k | −$1.61 |
| EGI | $173.5k | $17.35 |
| − OpEx | −$60.7k | −$6.07 |
| NOI | $112.8k | $11.28 |
10,000 SF · lease $18.96/SF/yr · vacancy 8.50% · expense 35.00%
Alternative Uses
Best Use
Flex RnD
$1.61M
$1.41M – $1.88M
NOI $112,765 @ 7.0% cap · market cap 8.67%
Second Best
Warehouse
$1.15M
$1.01M – $1.34M
NOI $80,427 @ 7.0% cap · market cap 6.19%
Theoretical Best
Office A
$2.95M
$2.58M – $3.44M
NOI $206,400 @ 7.0% cap · market cap 15.88%
Zoning and permitted uses should be independently verified with authorities.
Property Analytics
Property Profile
Location Intelligence
Current Use
Similar Off Market Nearby
- Cravings To Go — 933 Beville Rd Unit 102C, South Daytona, FL 32119
Frequently Asked Questions
What type of property is this?
Flex space - 10,000 SF flex property ideal for investors or owner-users.
Where is this flex space located?
The property is located at 1725 S Nova Road South Daytona, FL.
What is the asking price?
The asking price for this property is $1,300,000.
What are key features of this property?
This property features: +/-10,000 SF flex property suitable for warehouse, distribution, light manufacturing, or service‑based uses.; High‑visibility location along a corridor with approximately 29,500 AADT and easy access to I‑95.; Exceptional versatility for investors or owner‑users due to flexible configuration options.



