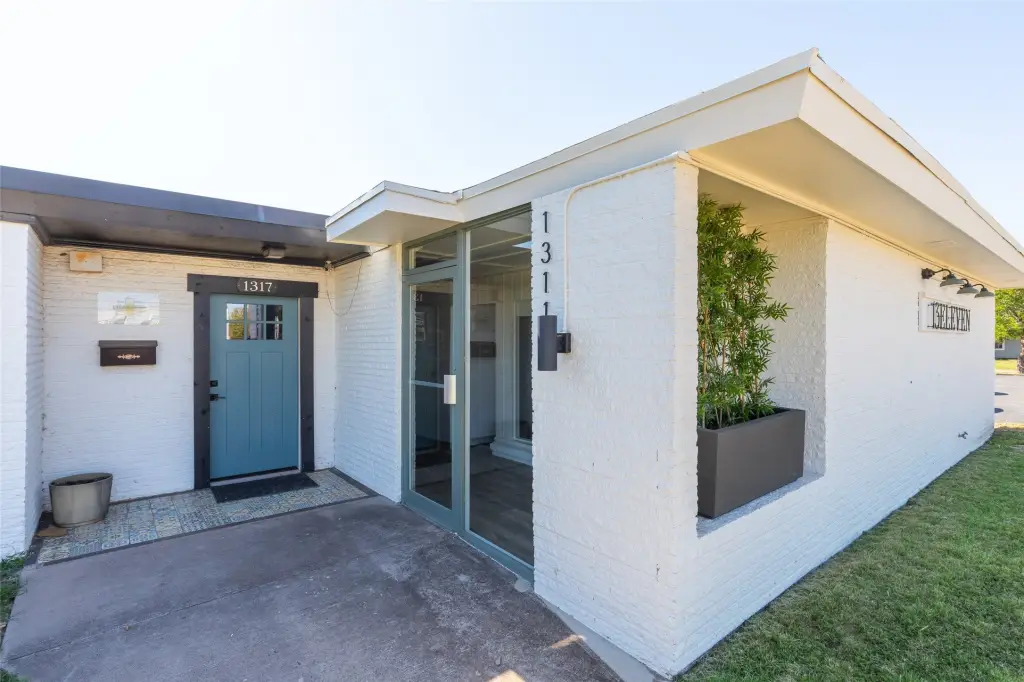
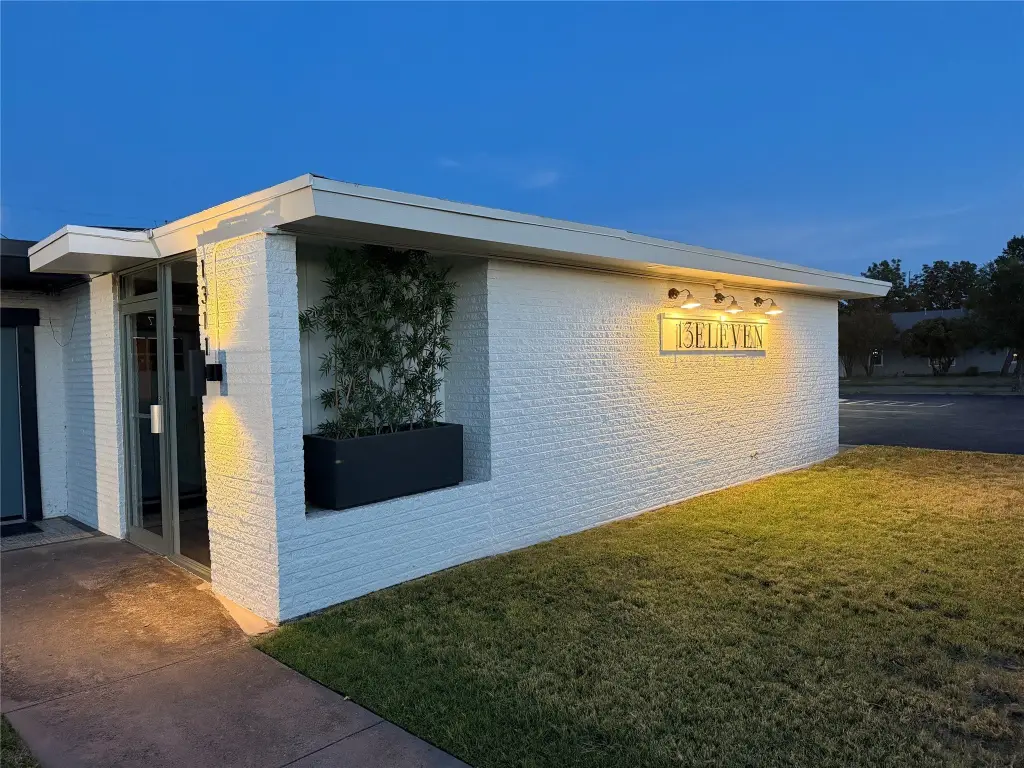
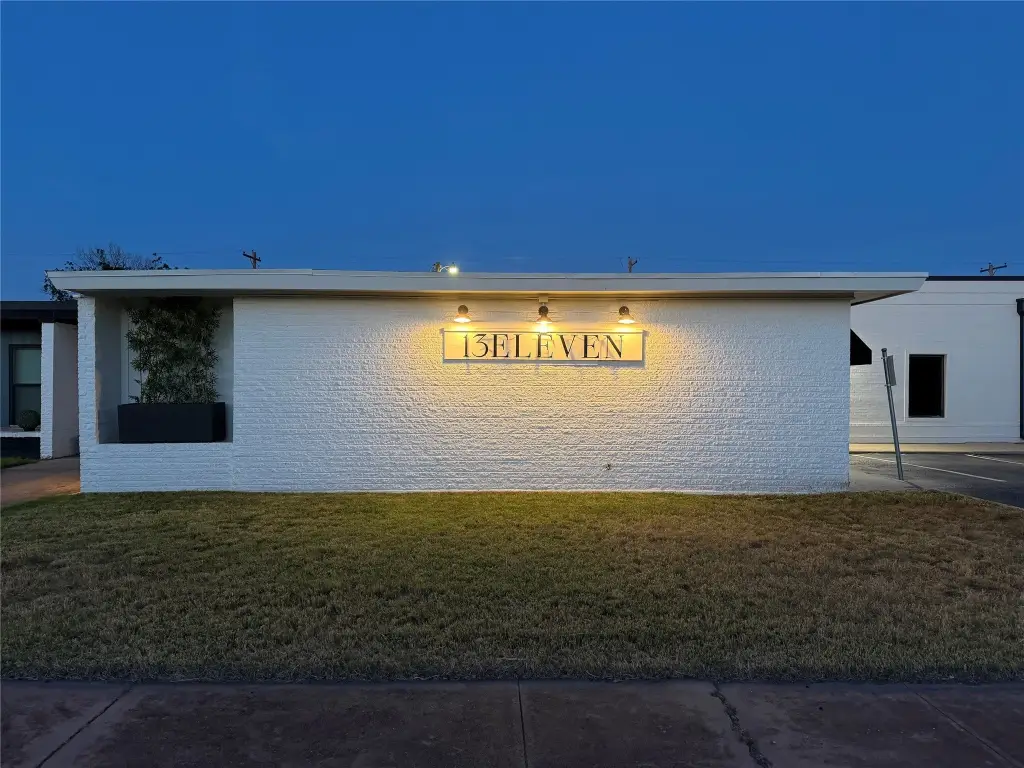
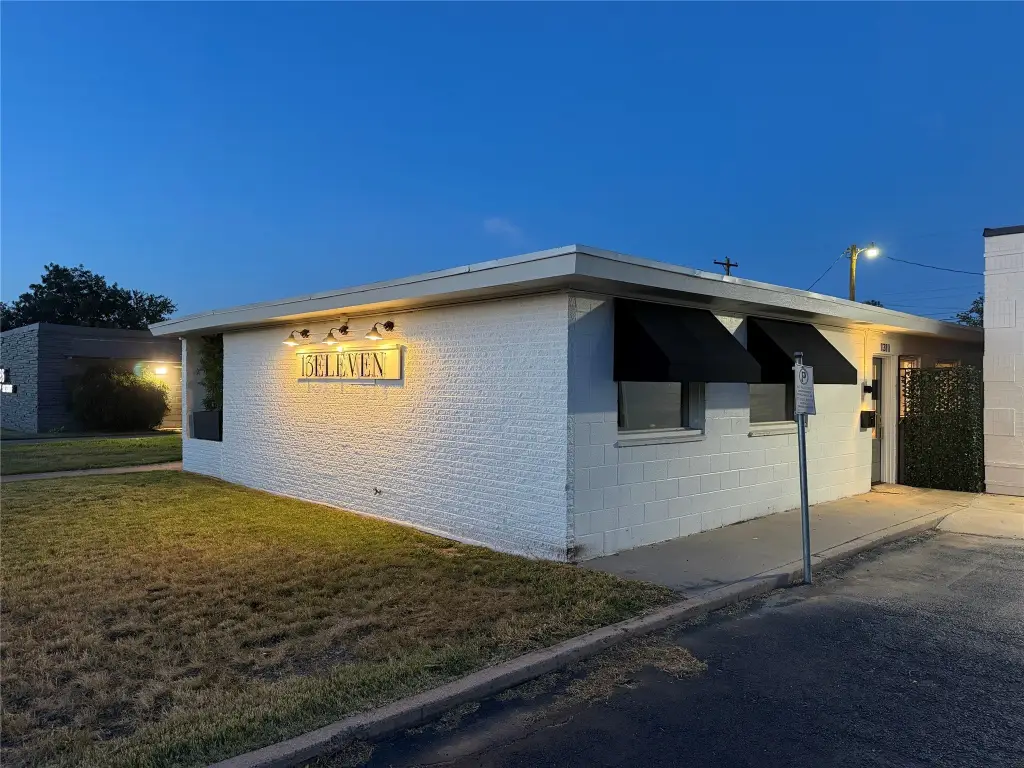
Remodeled Medical Office
For Sale
$429,000
1311 Hickory Street, Abilene, TX 79601
CommercialSale, Abilene, TX
Property Size2,000 SF
Lot Size0.11 Acres
Price / SF$214.50
Days on Market70
Property Features for 1311 Hickory Street
General Information
Property type
Commercial Sale
Property subtype
Office
Zoning description
Office
Parking features
Alley, On Street
Subdivision
Ot Abilene
Directions
1311 Hickory Street
Standard status
Active
APN
20711
Lot size
0.11 Acres
Taxes and HOA fees
Tax Description
N35FT S 110 W140 202 W1-3 2 OT ABL
Tax Annual Amount
2835
Legal Description
N35FT S 110 W140 202 W1-3 2 OT ABL
Utilities
Sewer type
Public Sewer
Heating system
Central
Cooling system
Central Air
Water source
Public
Building Details
Year built
1956
Floors in Building
1
Number of units
1
Flooring type
Vinyl
Building materials
Concrete
Roof type
Asphalt
Listing Agency:
Barnett & Hill
(325) 677-3500
Listed By:
Timothy Smith · License #0824681
(904) 465-4345
Added: Jul 30
Changed: Sep 4
Last Checked: Oct 7 at 11:06PM
MLS# 21327910
Copyright © 2026 North Texas Real Estate Information Systems, Inc. All rights reserved. All information provided by the listing agent/broker is deemed reliable but is not guaranteed and should be independently verified.
Investment Insights
Based on property information with market context.
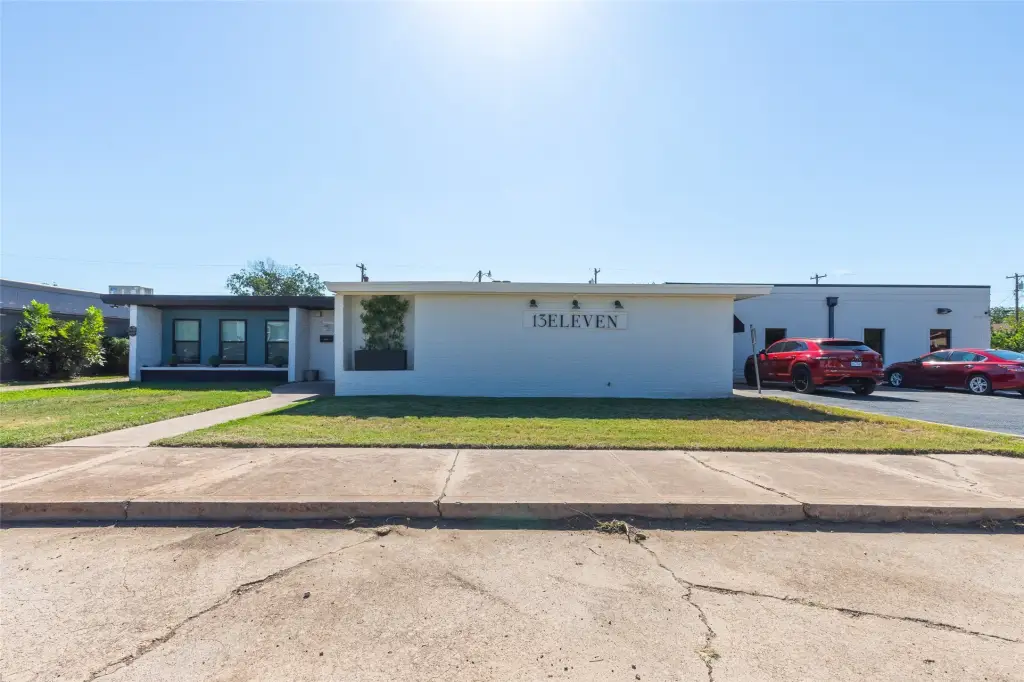
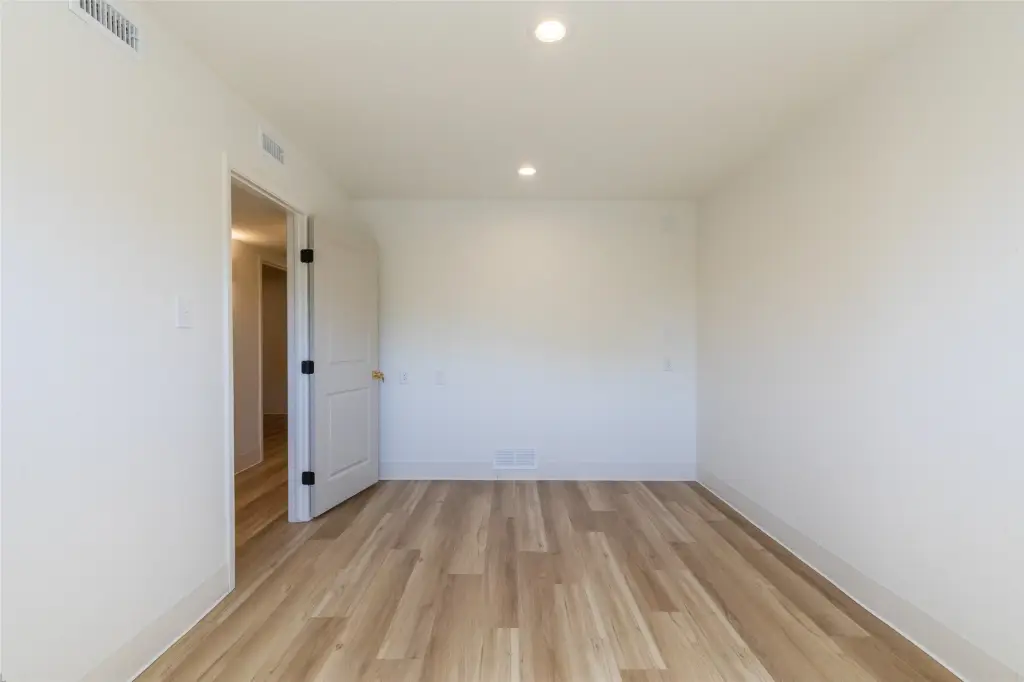
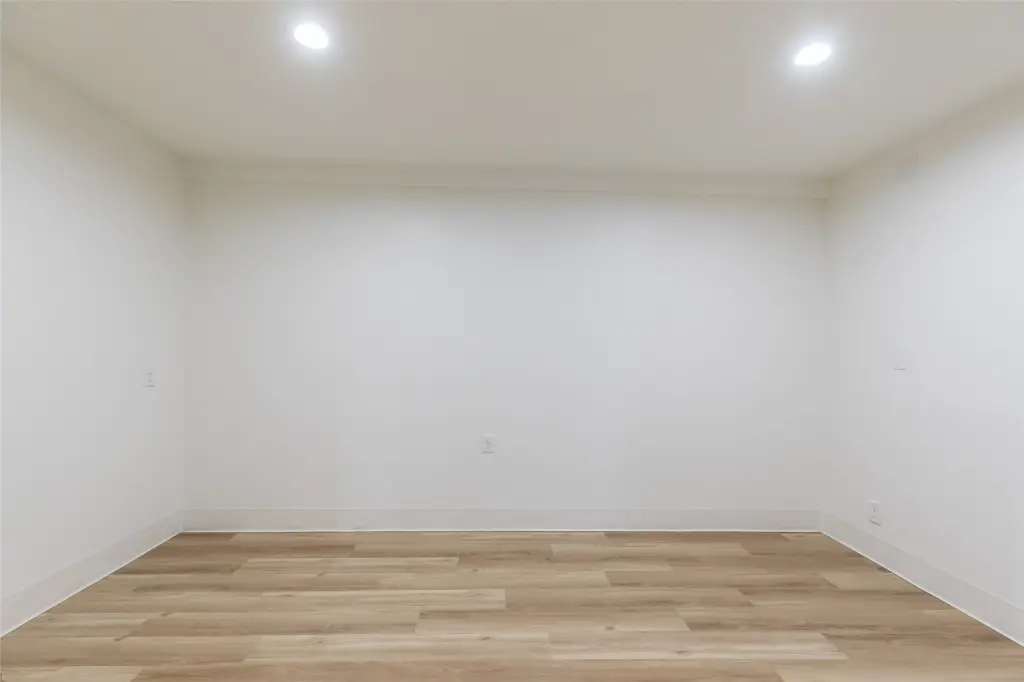
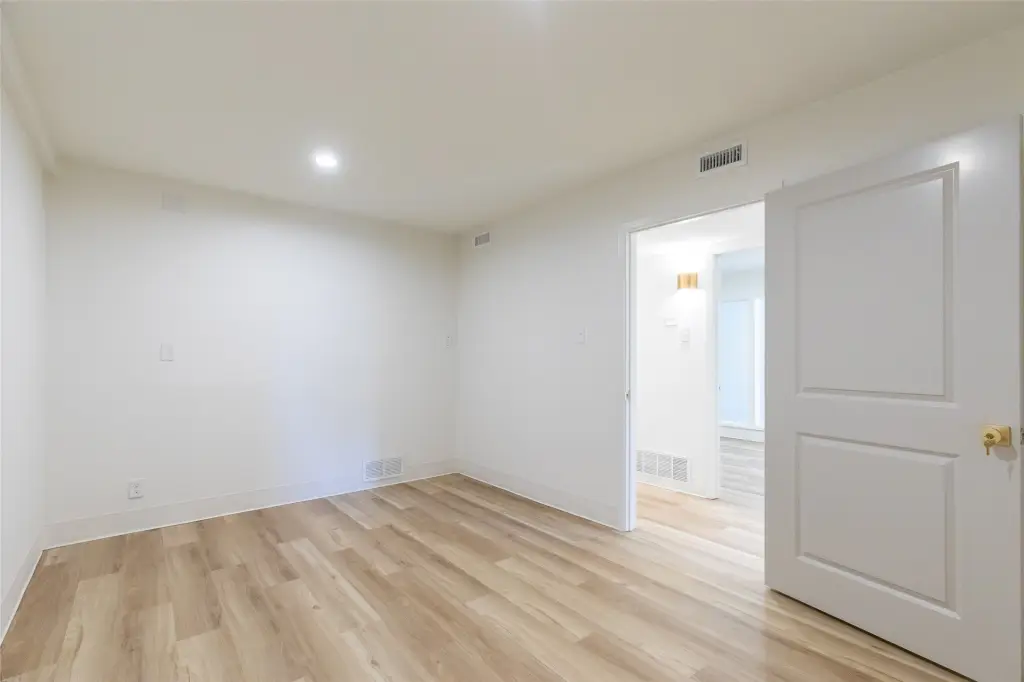
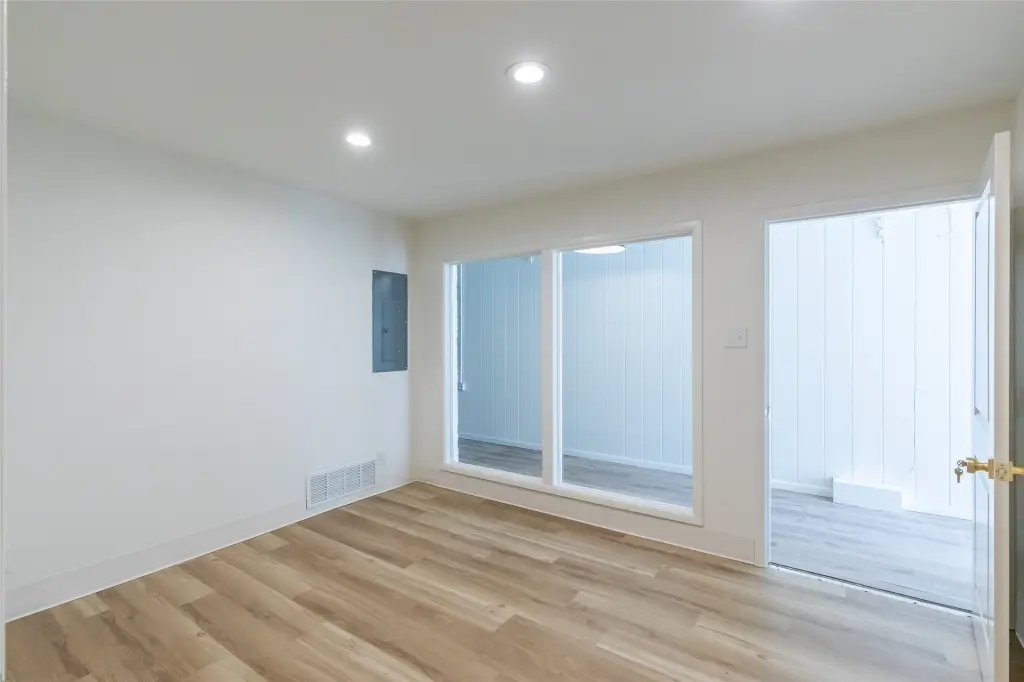
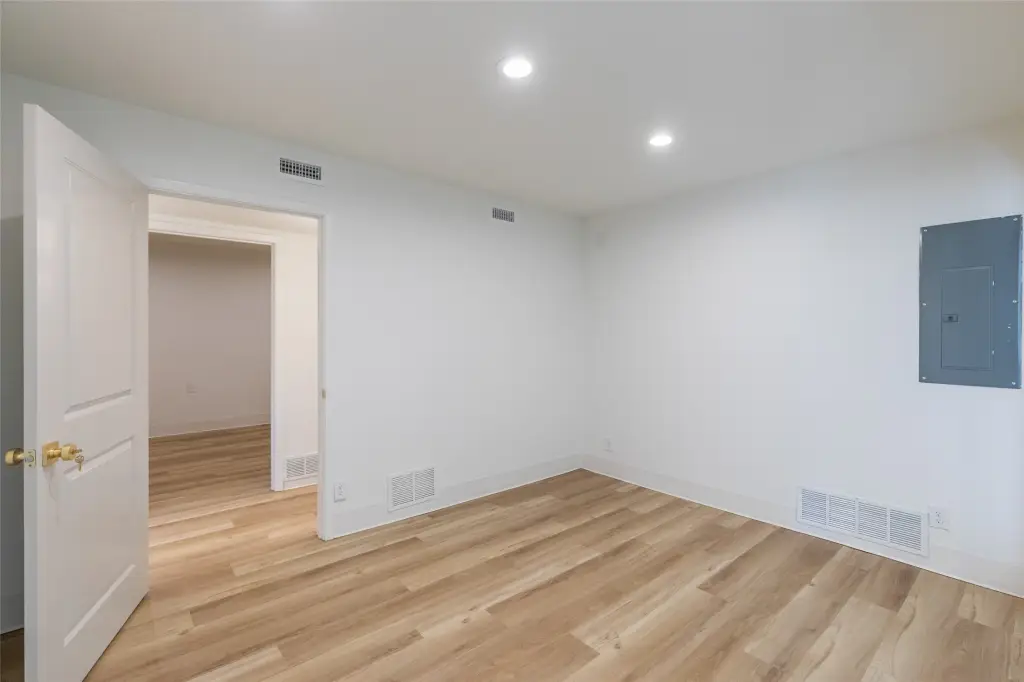
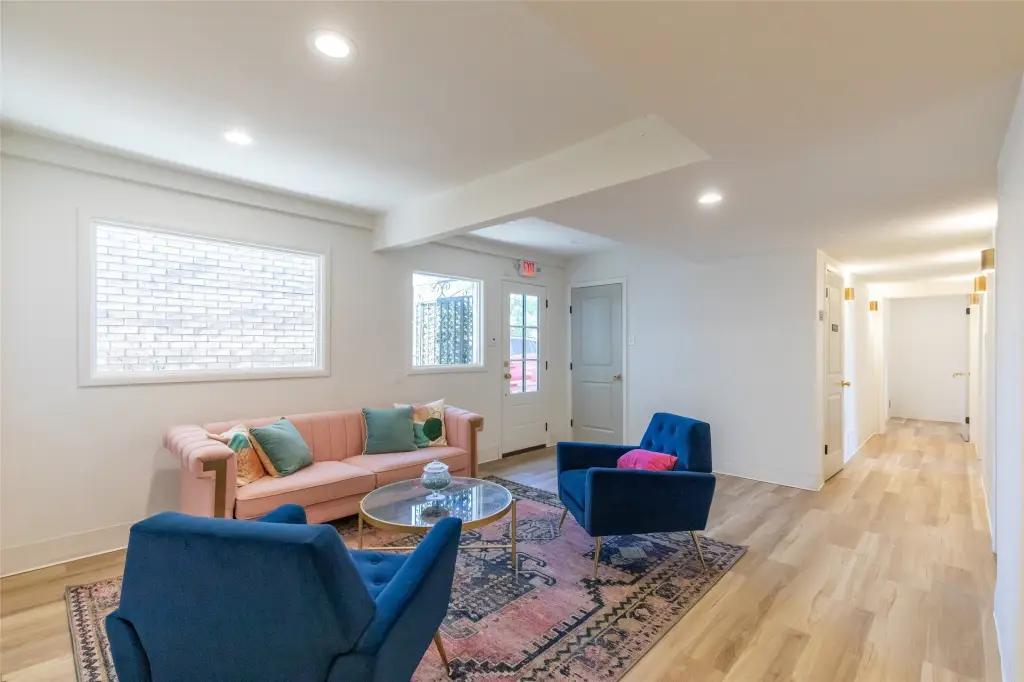
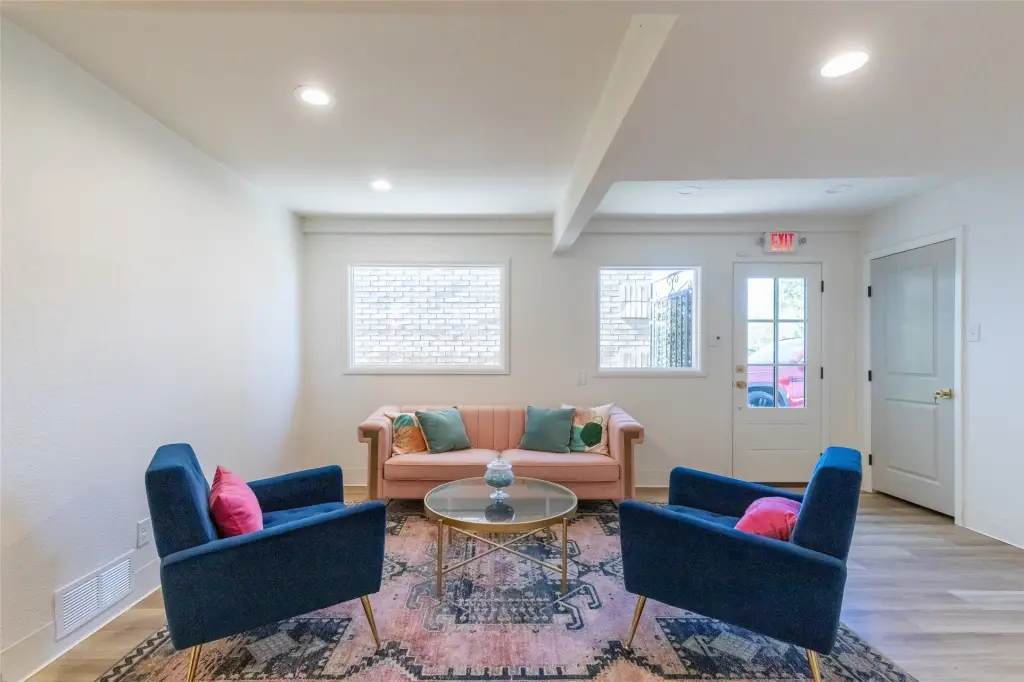
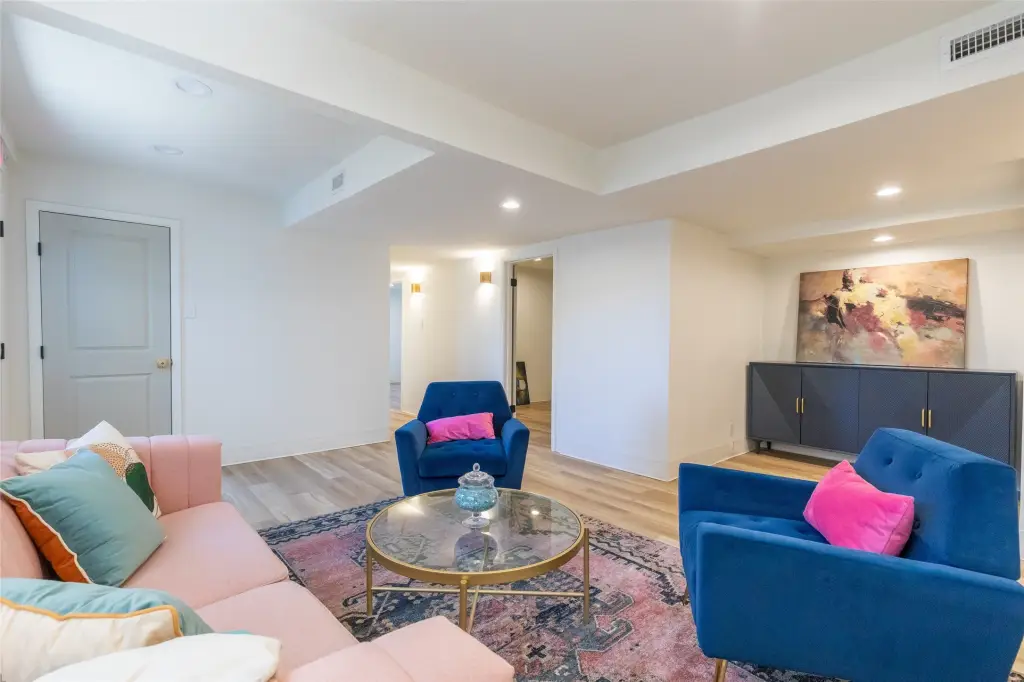
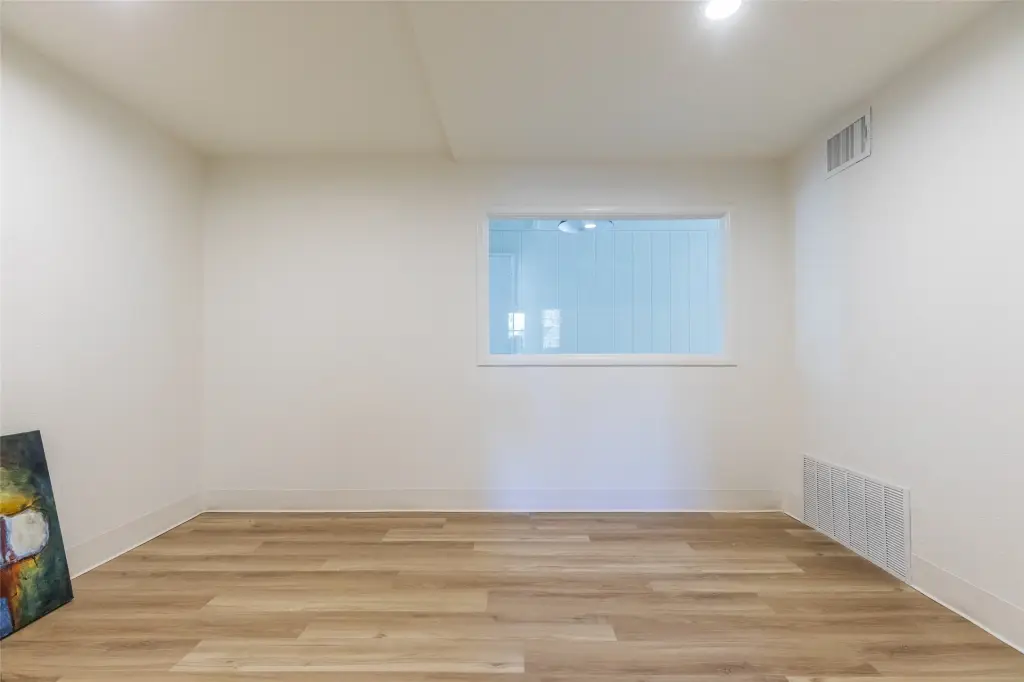
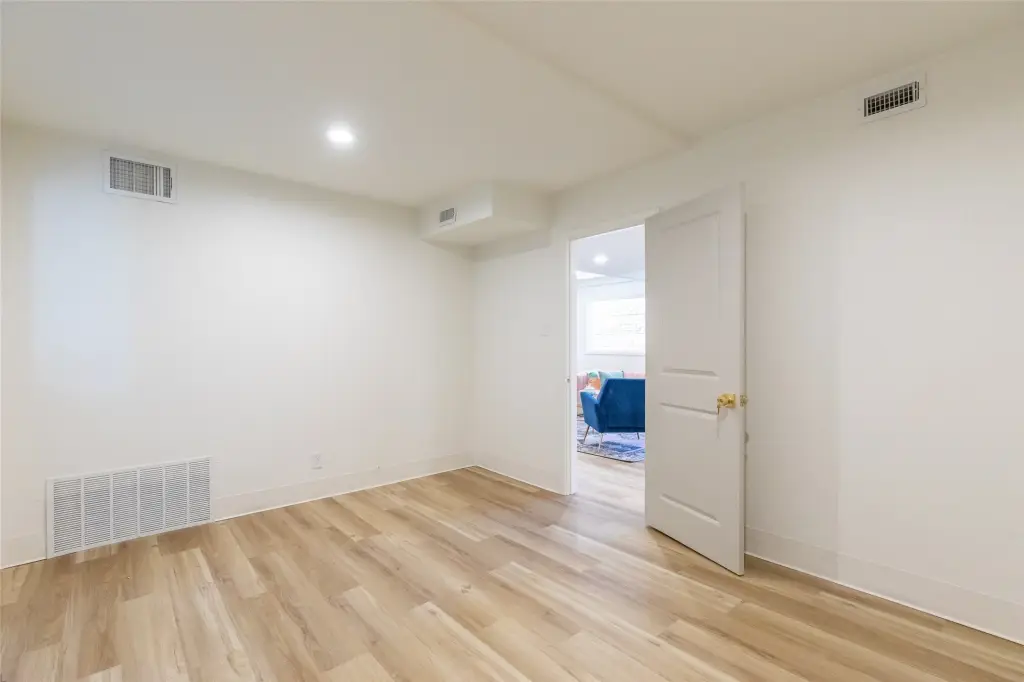
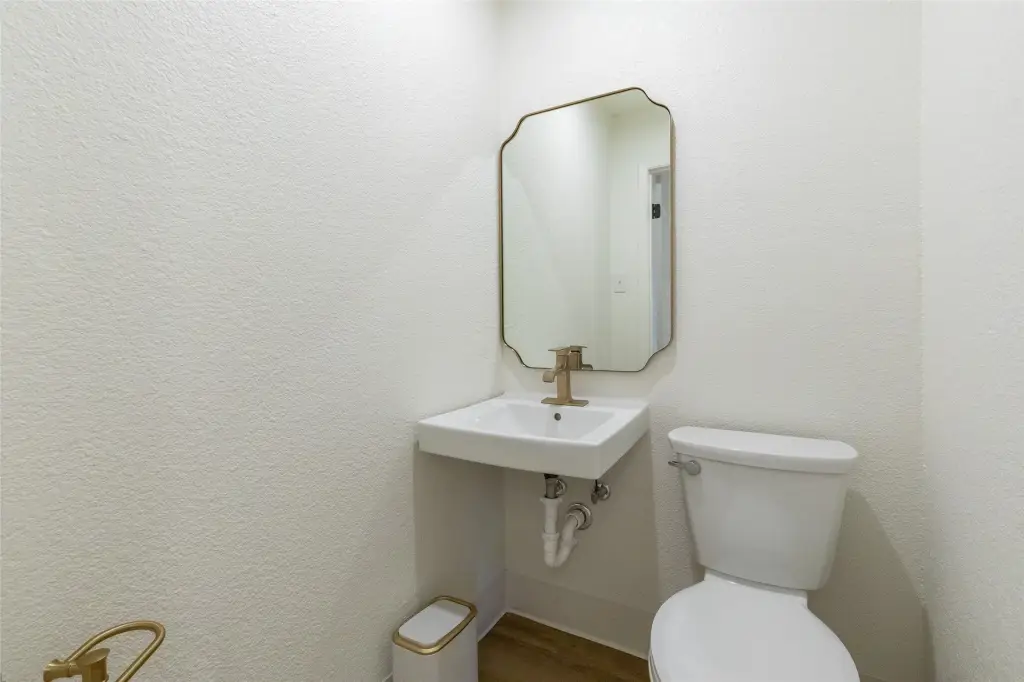
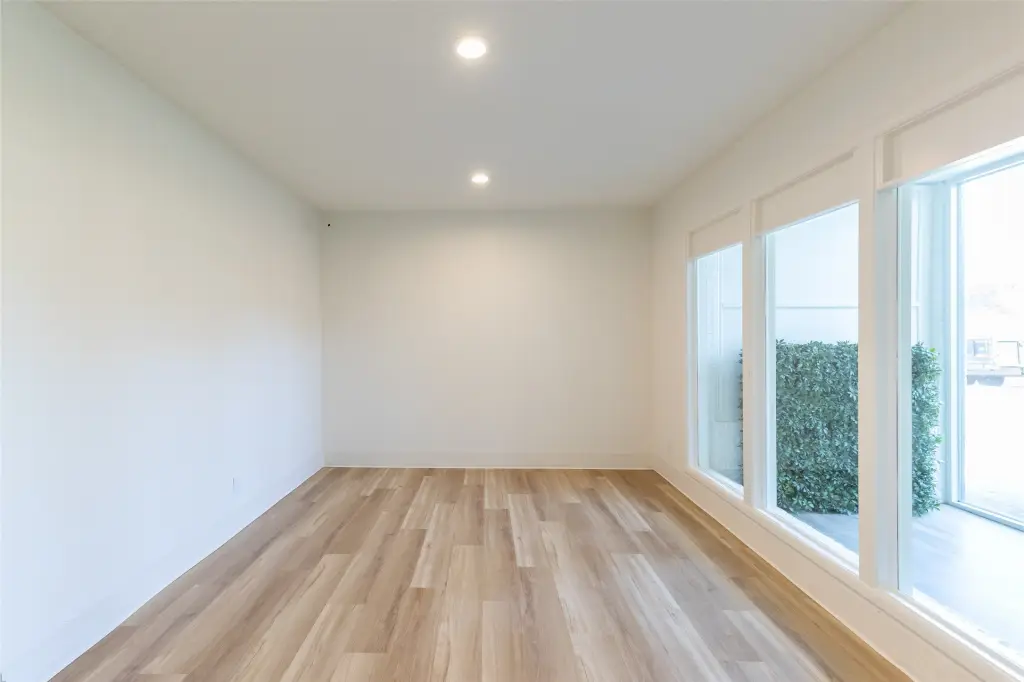
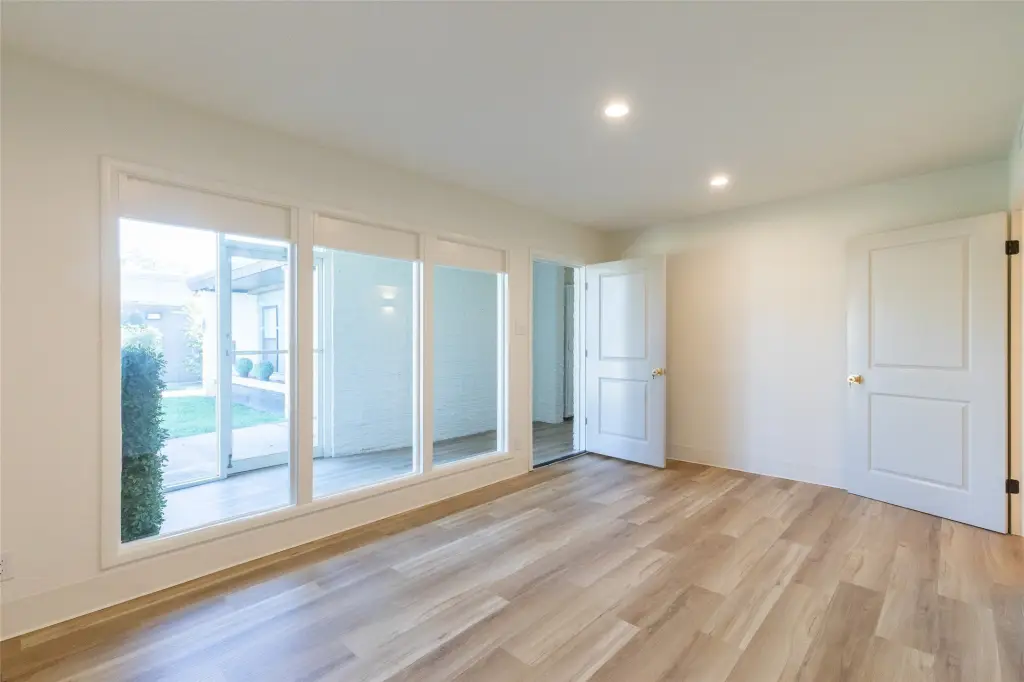
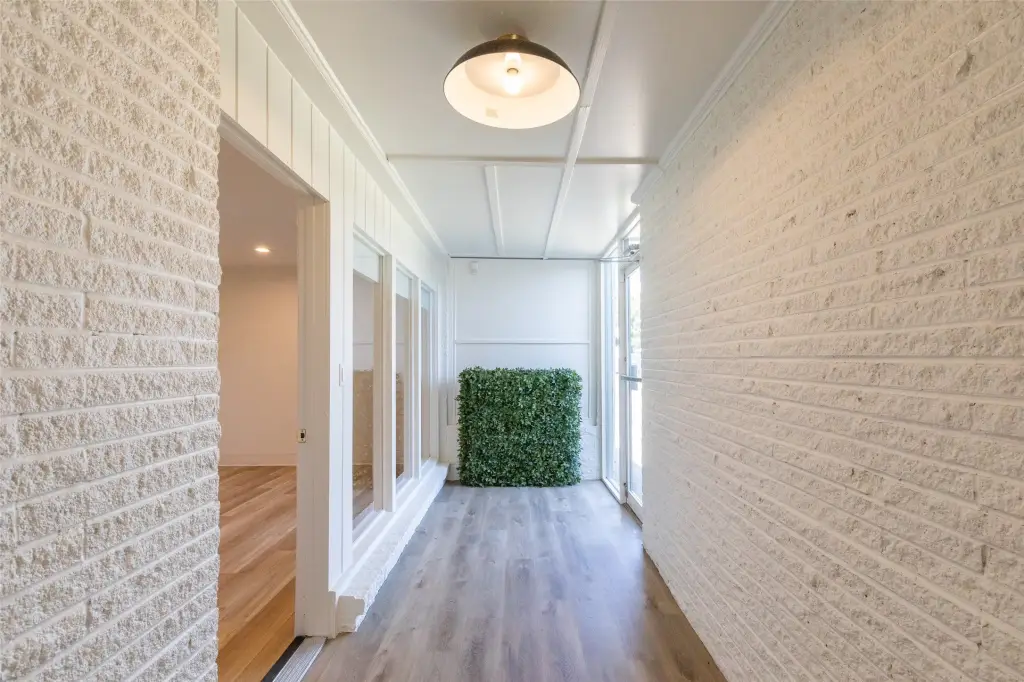
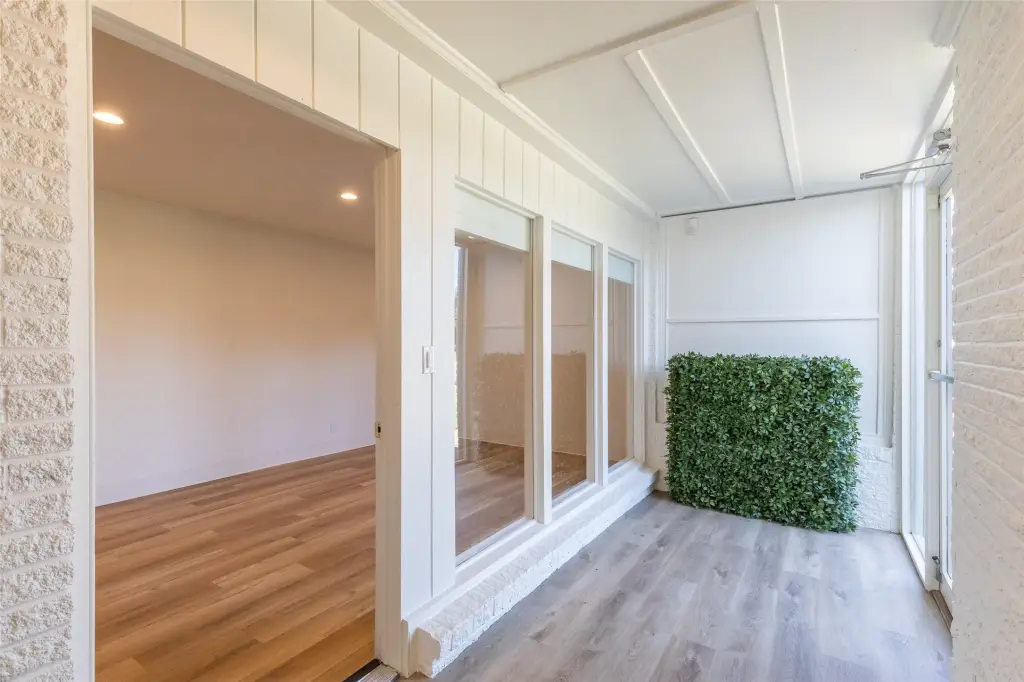
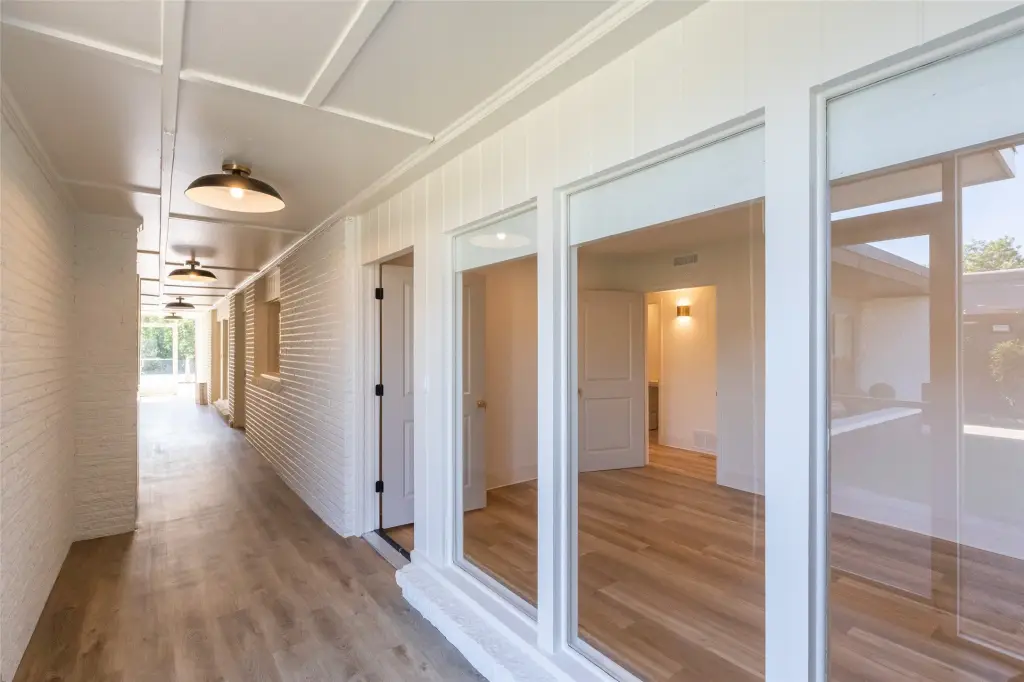
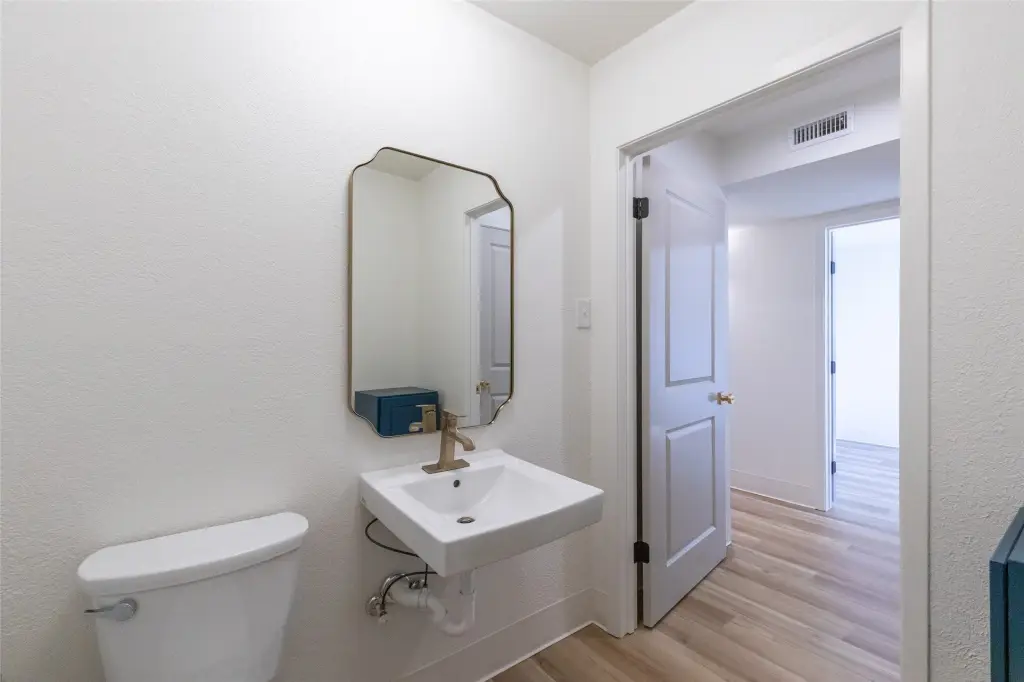
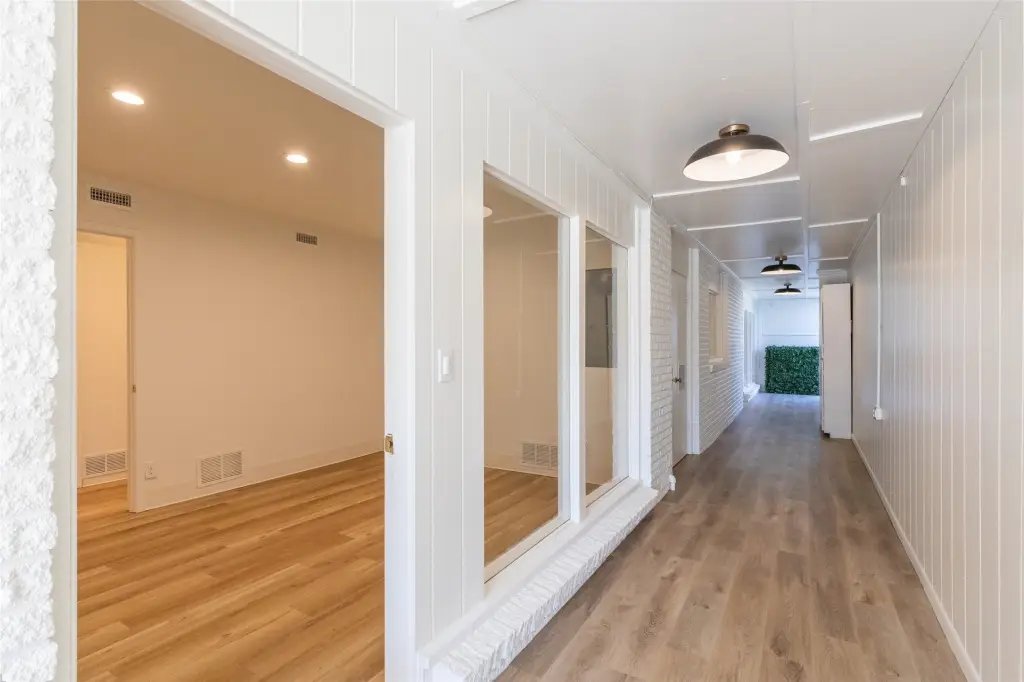
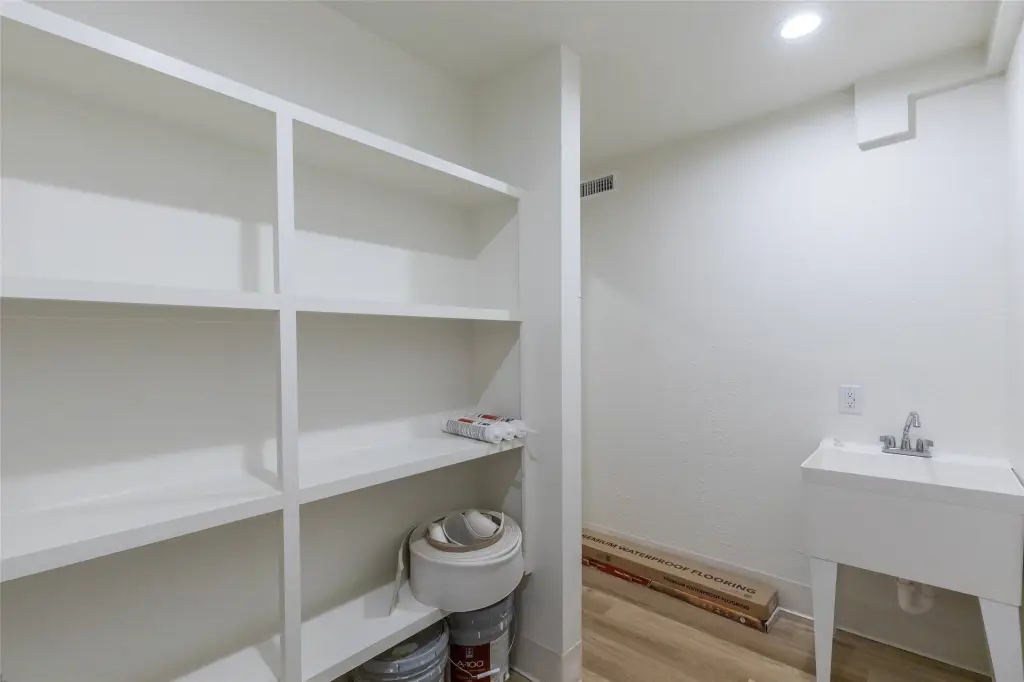
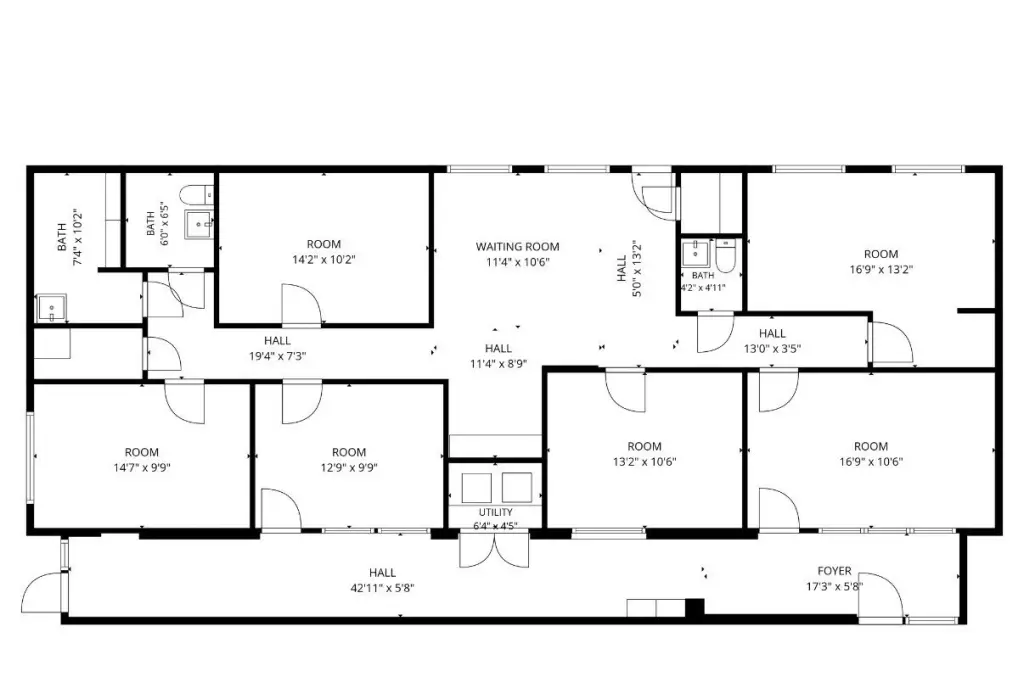
Located at 1311 Hickory Street, this approximately 2,000-square-foot medical office property offers six private offices, two restrooms, a reception or lobby area, and interior storage. A central corridor runs through the building and connects multiple entry points, with additional room for shelving or workspace organization.
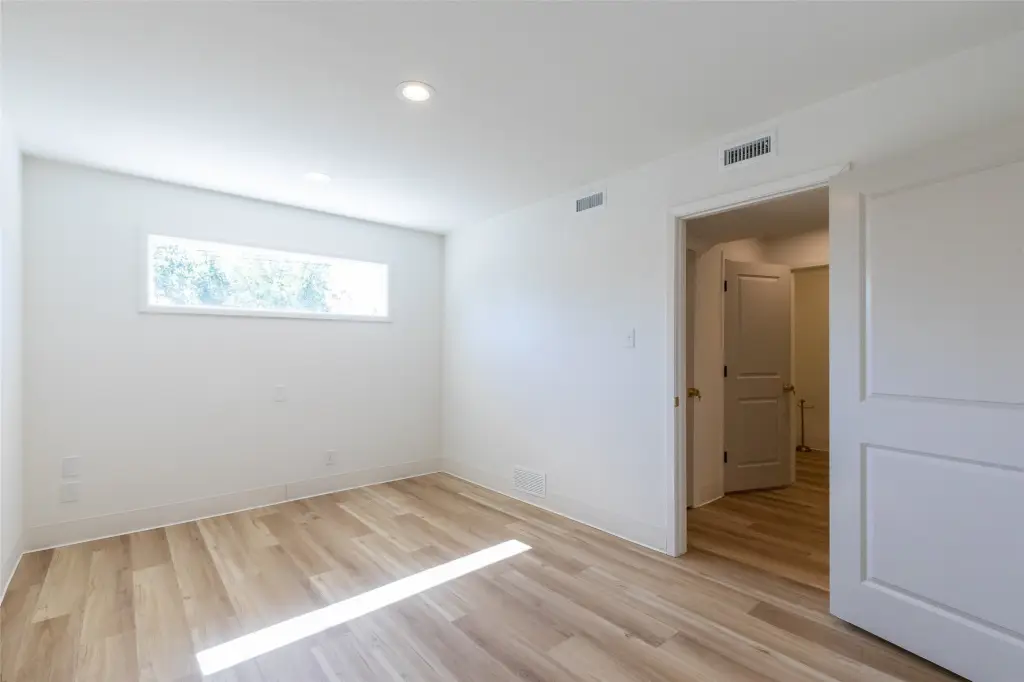
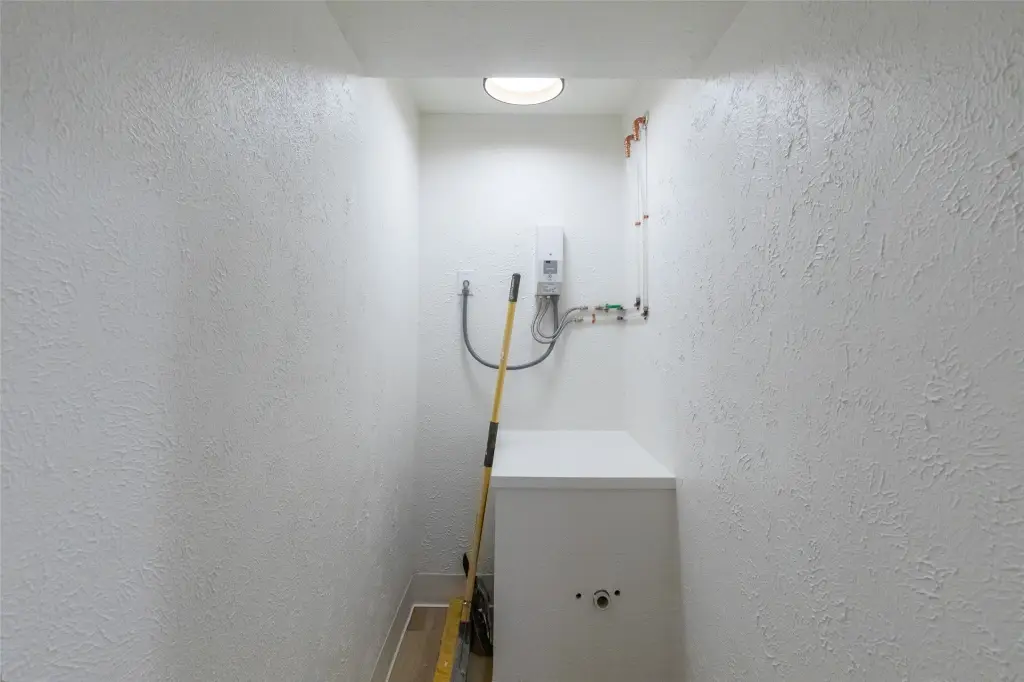
Recent improvements include LVT flooring, interior paint, light fixtures, plumbing, electrical components, and brand-new HVAC systems. The concrete building was constructed in 1956 and has central heating, central air, vinyl flooring, an asphalt roof, public water, and public sewer.
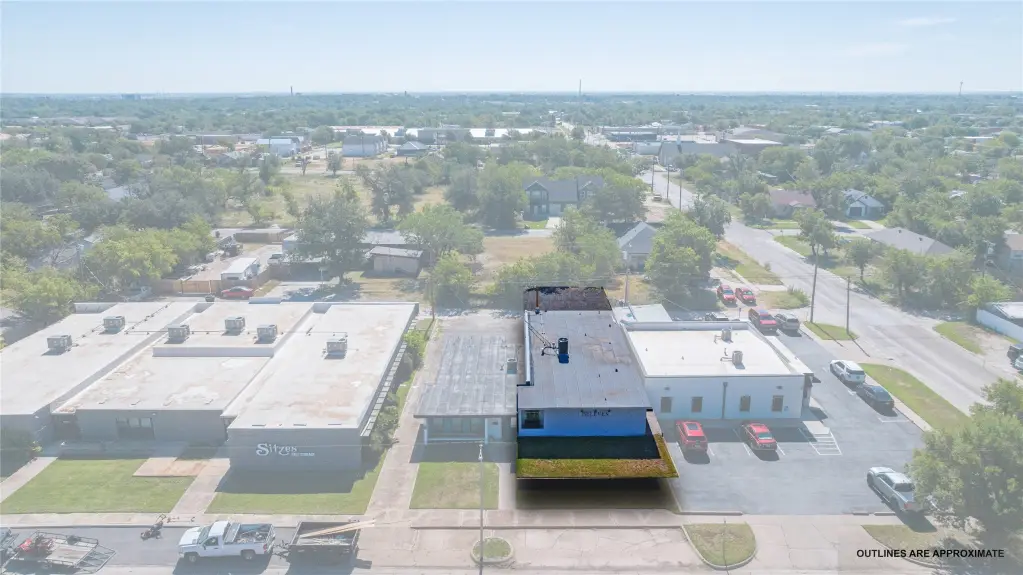
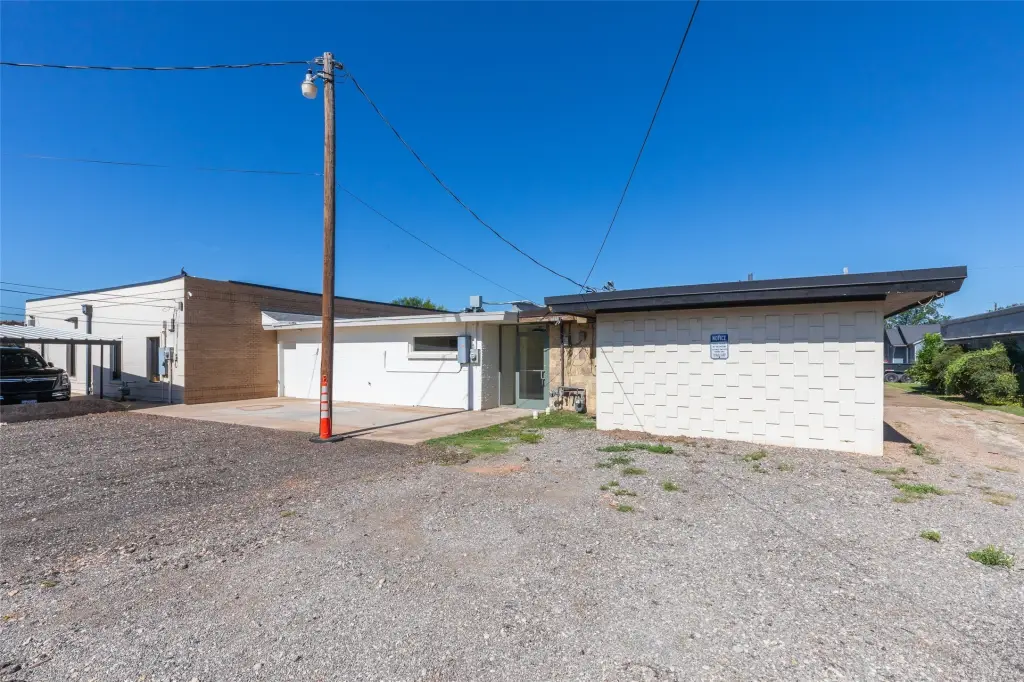
The property includes front parking, rear-entry parking, alley access, and on-street parking. It is near Hendrick Medical Center and the Abilene North medical district. The owners would consider leasing to a qualified applicant.
Recent improvements include LVT flooring, interior paint, light fixtures, plumbing, electrical components, and brand-new HVAC systems. The concrete building was constructed in 1956 and has central heating, central air, vinyl flooring, an asphalt roof, public water, and public sewer.
The property includes front parking, rear-entry parking, alley access, and on-street parking. It is near Hendrick Medical Center and the Abilene North medical district. The owners would consider leasing to a qualified applicant.
Key Highlights
- Approximately 2,000 square feet with six private offices and two restrooms
- Near Hendrick Medical Center and the Abilene North medical district
- Recent upgrades include LVT flooring, paint, lighting, plumbing, electrical, and brand‑new HVAC
Financial Insights
Estimated NOI and Cap Rate
NOI / Yr
$22,889
Cap Rate
5.34%
Suggested Prices Based on Cap Rates
Cap Rate 5%
$457,780
$457.8K
Cap Rate 7%
$326,986
$327.0K
Cap Rate 9%
$254,322
$254.3K
Market Conditions
NOI Build-Up for 2,000 SF
Gross rent
$40.8K $20.40/SF
− Vacancy
−$2.7K −$1.33/SF
EGI
$38.1K $19.07/SF
− OpEx
−$15.3K −$7.63/SF
NOI
$22.9K $11.44/SF
Area
Abilene, TX
Vacancy
6.50%
Lease Rate
$20.40 /SF/Yr
Expense Ratio
40.00%
Simulate Cap Rate and NOI
Suggested Prices Based on Cap Rates
Cap Rate 5%
$457,780
Cap Rate 7%
$326,986
Cap Rate 9%
$254,322
Alternative Uses
Best Use
Healthcare Medical
$327.0K
$286.1K – $381.5K
NOI $22,889 @ 7.0% cap · market cap 5.34%
Second Best
Office B
$316.9K
$277.3K – $369.8K
NOI $22,185 @ 7.0% cap · market cap 5.17%
Theoretical Best
Office A
$446.5K
$390.7K – $521.0K
NOI $31,258 @ 7.0% cap · market cap 7.29%
Zoning and permitted uses should be independently verified with authorities.
Property Analytics
Unlock full access to Insights
Subscribe to Realmo Intelligence
Open Analytics
Current Use
Location Intelligence
Trade Area within ½ mile
1,021
Businesses Nearby
Under-served
Demand for This Use
Explore this area
Business Placement
Demographics for 79601, TX
26,515
Population
9,422
Households
2.8
Avg Household Size
32
Median Age
21%
College-Educated
84%
High-School Grad
263.0 sq mi
ZIP Area
101
Density / Sq Mi
$54,515
Median Household Income
$24,704
Median Earnings
$988
Median Rent
$182,900
Median Home Value
Check the figures for this property
Cap Rate, Value Estimation, Potential NOI and more
View Realmo Analytics
Market
Vacancy Rate% for Office in South region

Questions? Ask Rey
Realmo’s AI knows this listing — price, zoning, demand, history. Ask anything.




Similar Off Market Nearby
- West Texas Veterinary Supply — 431 N 7th St, Abilene, TX 79601
- Callan Animal Hospital — 1801 N Treadaway Blvd, Abilene, TX 79601
Frequently Asked Questions
What type of property is this?
Medical Office Space - Updated interior includes private offices, reception space, storage, and multiple access points.
Where is this medical office space located?
The property is located at 1311 Hickory Street Abilene, TX.
What is the asking price?
The asking price for this property is $429,000.
What are key features of this property?
This property features: Approximately 2,000 square feet with six private offices and two restrooms; Near Hendrick Medical Center and the Abilene North medical district; Recent upgrades include LVT flooring, paint, lighting, plumbing, electrical, and brand‑new HVAC


