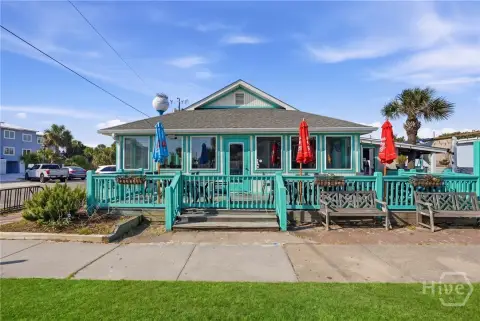
Historic Triplex Near
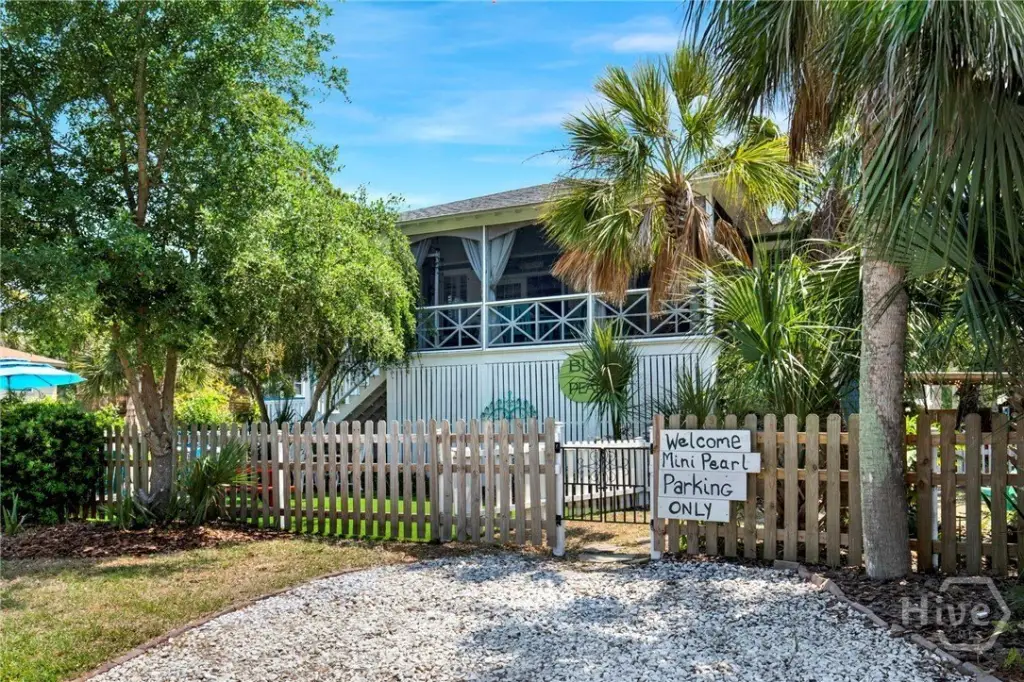
For Sale
$1,149,000
Pending
1102 Lovell Avenue, Tybee Island, GA 31328
Residential Income, Tybee Island, GA
Property Size3,258 SF
Lot Size0.11 Acres
Days on Market167
Property Features for 1102 Lovell Avenue
General Information
Property type
Residential Multi Family
Property subtype
Triplex
Zoning
R2
Zoning description
Multi Family, Single Family
Bedrooms
6
Bathrooms
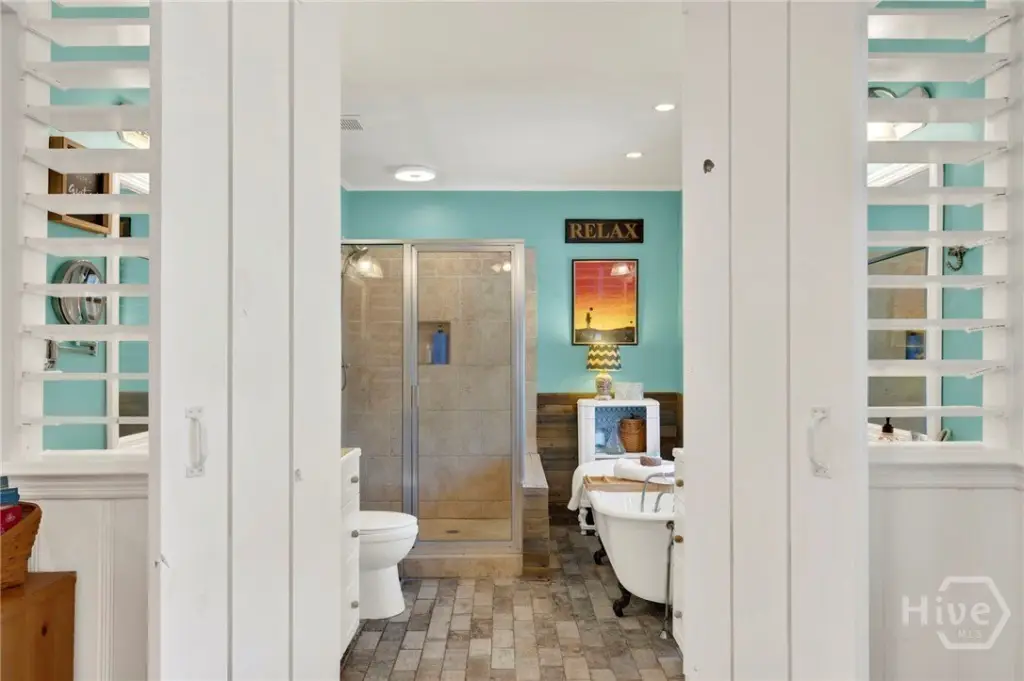
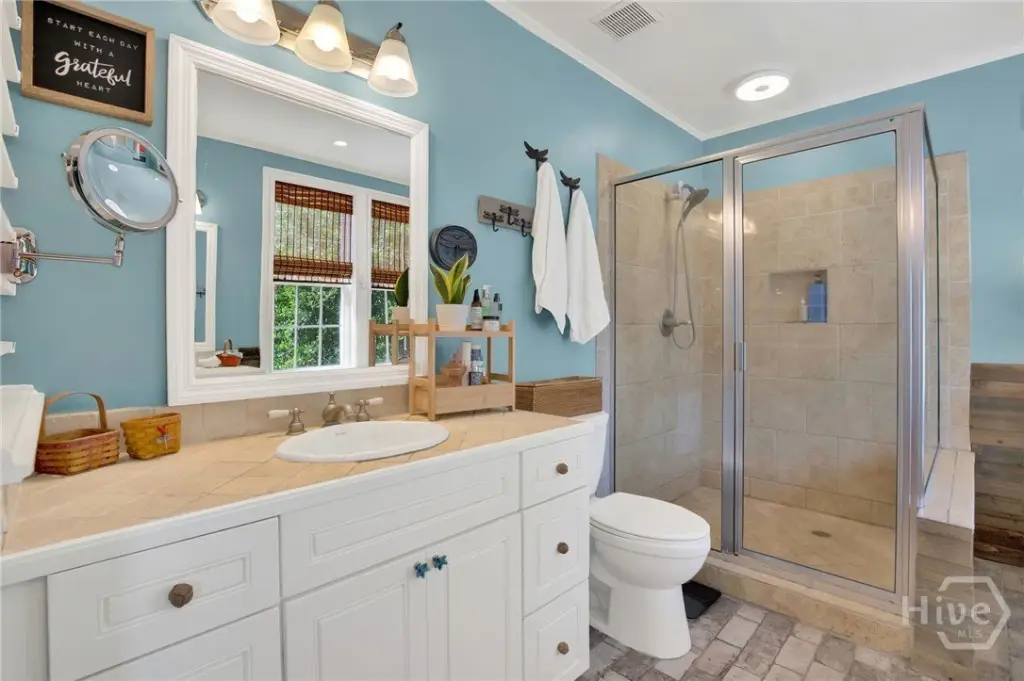
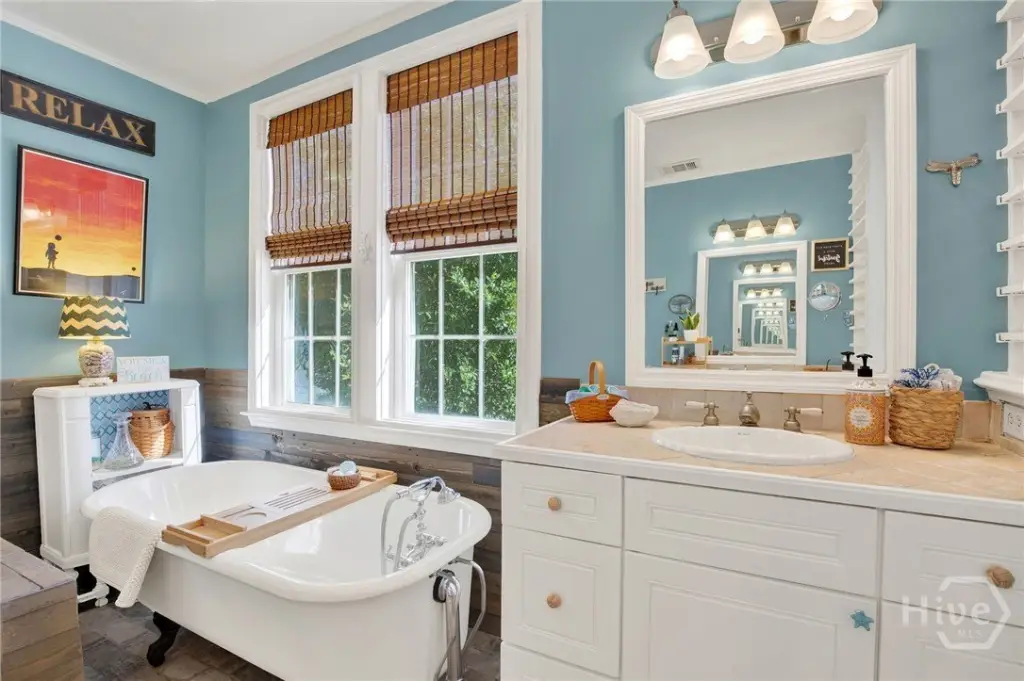
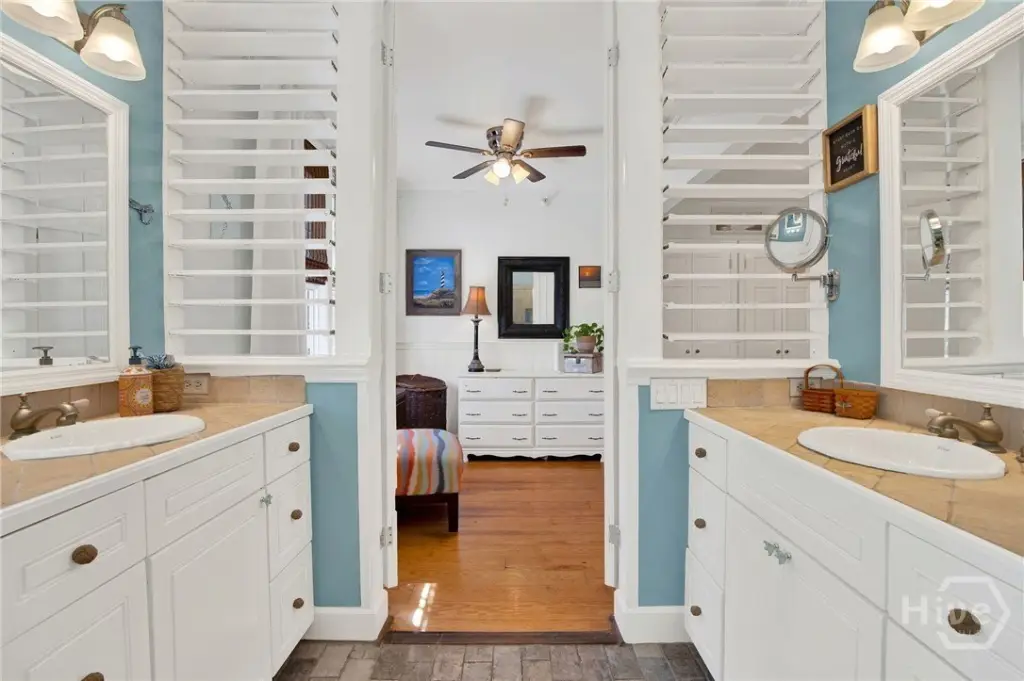
5
Full bathrooms
5
Rooms
Bedroom 3, Bathroom 1, Bathroom 5, Bedroom 1, Bedroom 6, Bathroom 2, Bedroom 2, Bedroom 5, Bathroom 3, Bedroom 4, Bathroom 4
Parking features
Off Street
Patio and Porch features
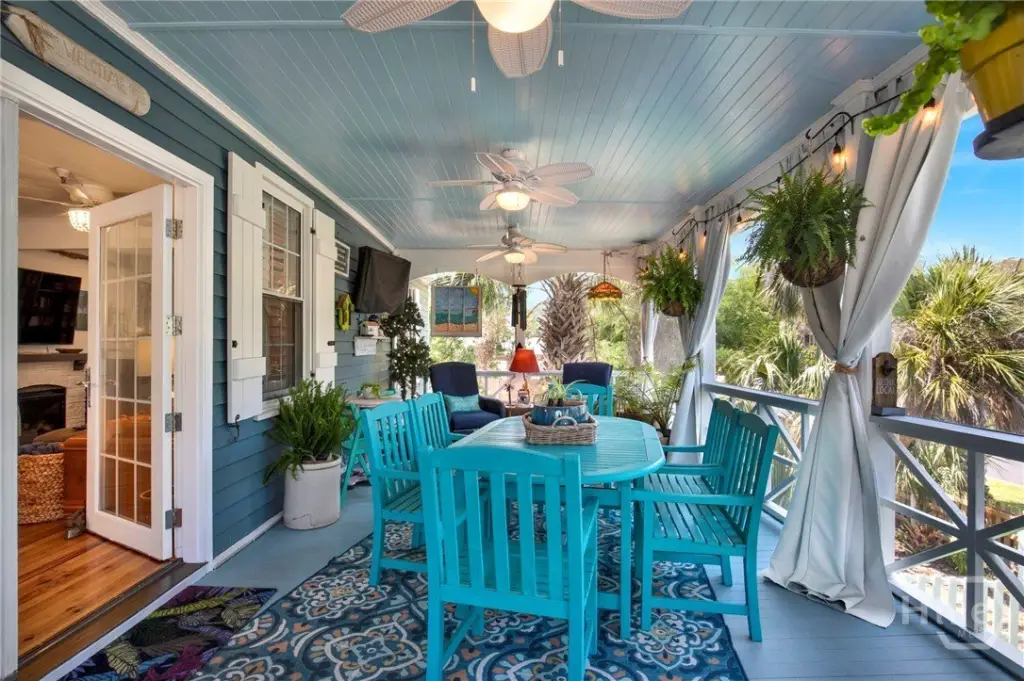
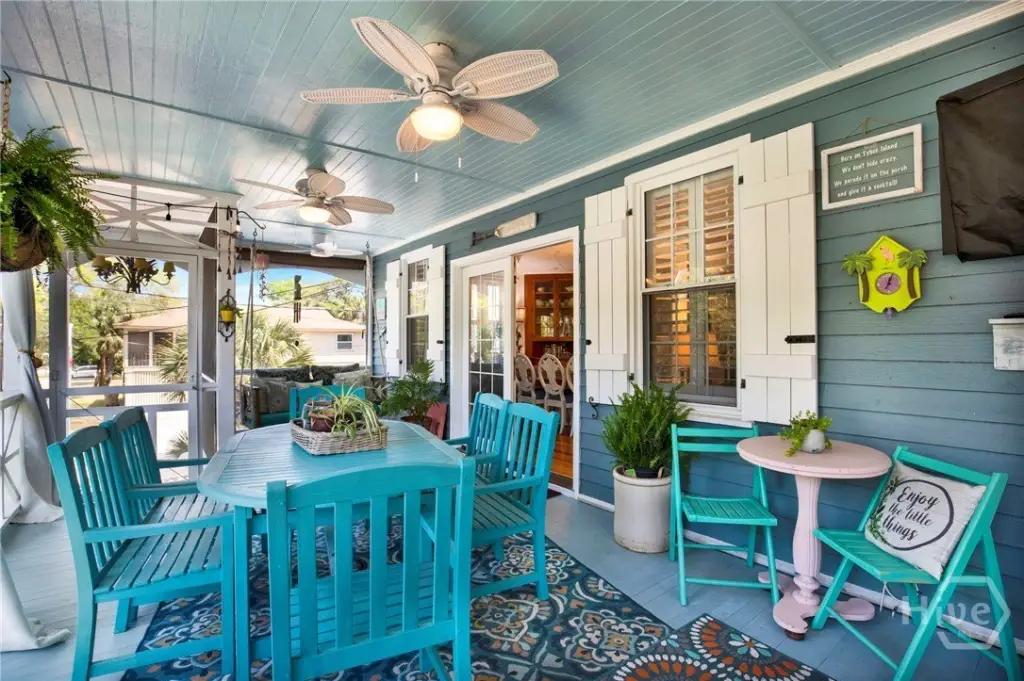
Porch, Patio
Interior features
Ceiling Fan(s), Pull Down Attic Stairs
Exterior features
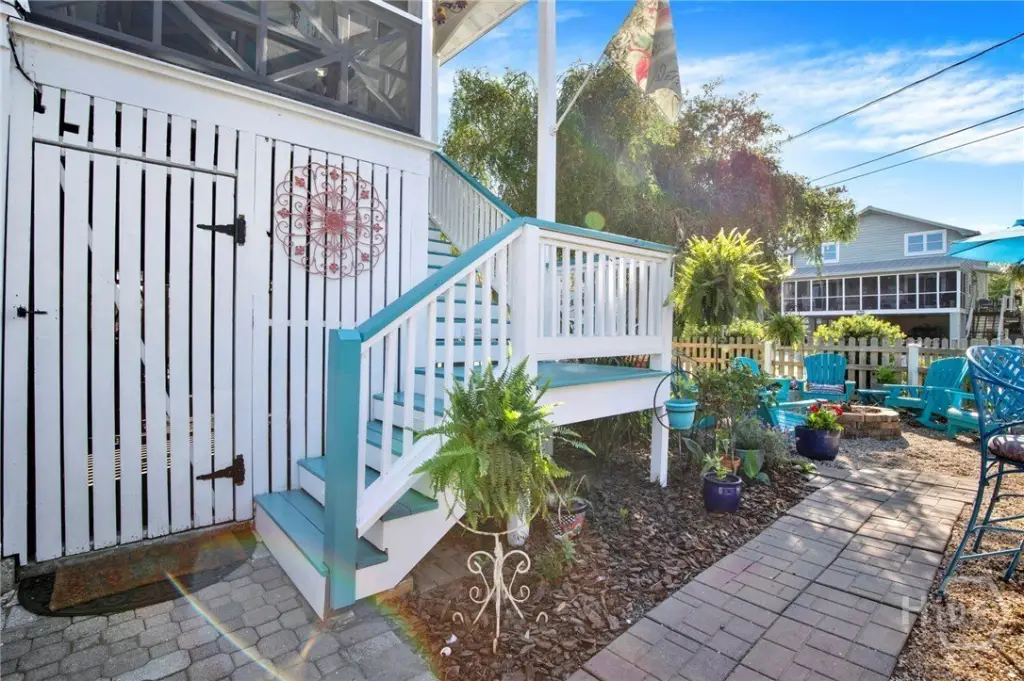
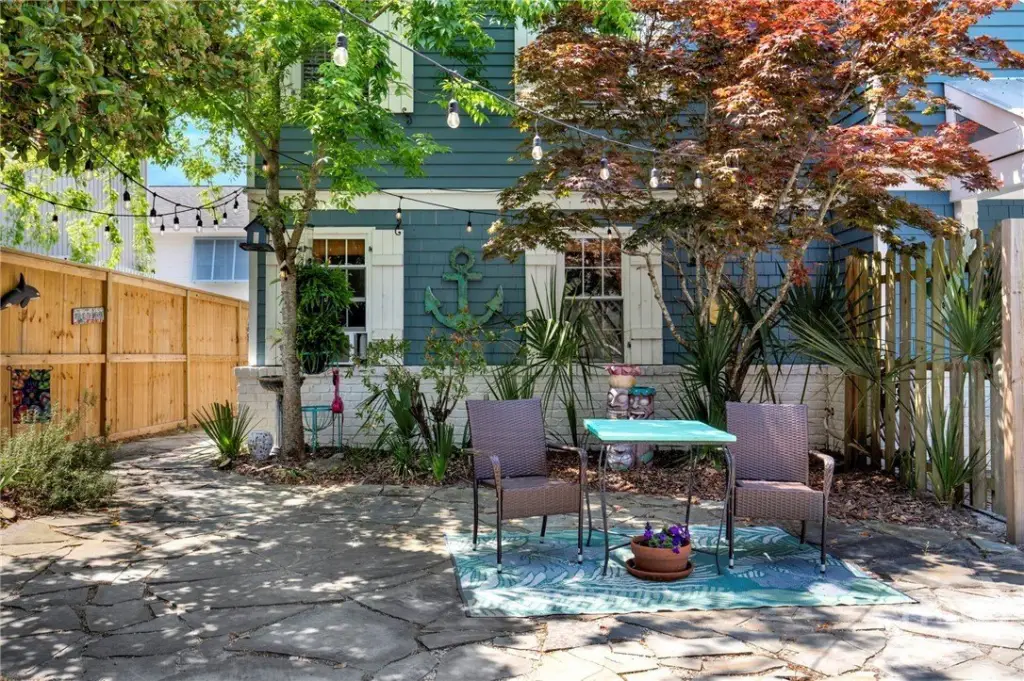
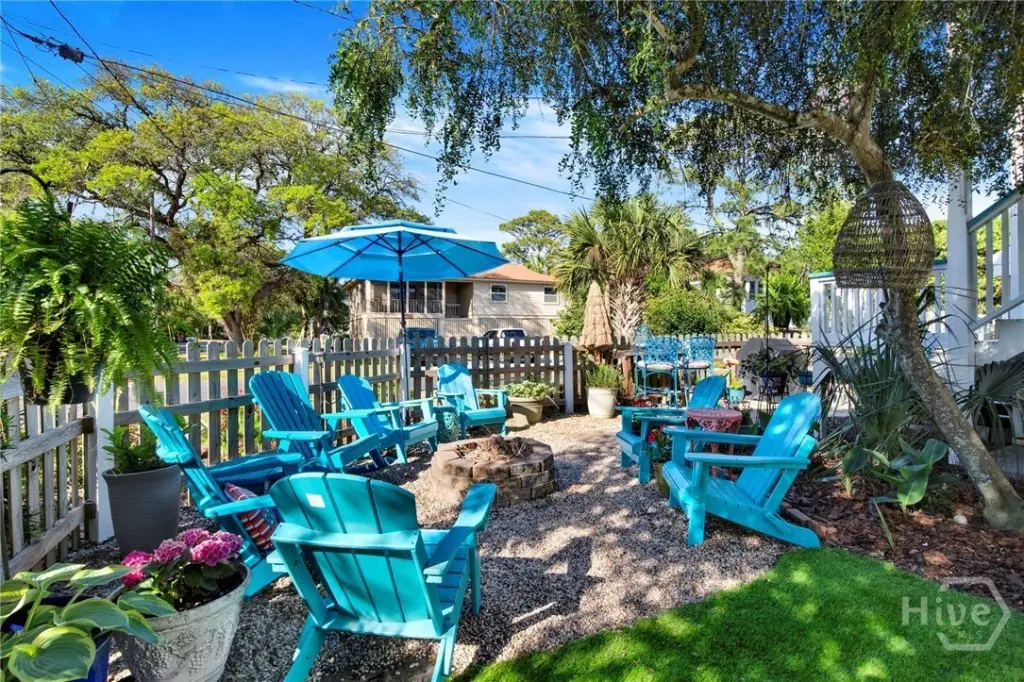
Courtyard, Fire Pit
Fencing
Privacy
Appliances
Some Gas Appliances, Dishwasher, Electric Water Heater, Disposal, Oven, Range, Range Hood, Wine Cooler, Dryer, Refrigerator, Washer
Subdivision
Tybee Island Ward 3
Lot features
Corner Lot
Directions
Hwy 80 E > Butler Ave > right on 11th st> house is immediately on the left
Standard status
Pending
APN
4000619001
Size
3,258 SF
Lot size
0.11 Acres
Taxes and HOA fees
Tax Year
2025
Tax Description
LOT 17B RECOMBINATION OF LOTS 17A & 17B WARD 3 TYBEE PRB 15P 5
Tax Annual Amount
8637
Legal Description
LOT 17B RECOMBINATION OF LOTS 17A & 17B WARD 3 TYBEE PRB 15P 5
Utilities
Utilities
Cable Available
Sewer type
Public Sewer
Heating system
Electric (Heating), Heat Pump (Heating), Forced Air, Central
Cooling system
Heat Pump, Electric, Central Air, Window Unit(s)
Water source
Public
Building Details
Year built
1932
Floors in Building
2
Number of units
3
Flooring type
Wood, Hardwood, Tile - Ceramic
Building materials
Brick, Cedar, Frame, Wood Siding
Roof type
Asphalt
Listing Agency:
Keller Williams Coastal Area P · Keller Williams Realty
(912) 356-5001
Listed By:
Libby Bacon · License #267763
(912) 272-3776
Added: Apr 24
Changed: Sep 30
Last Checked: Oct 7 at 6:06PM
MLS# SA354234
Copyright © 2026 Hive MLS. All rights reserved. All information provided by the listing agent/broker is deemed reliable but is not guaranteed and should be independently verified.
Investment Insights
Based on property information with market context.
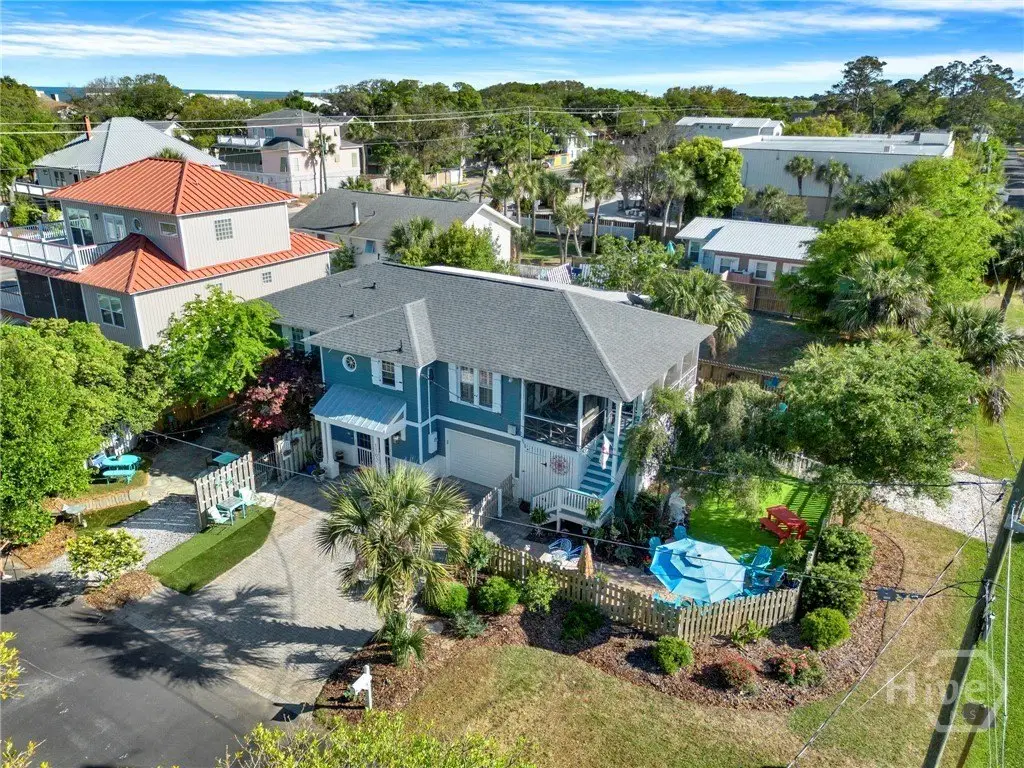
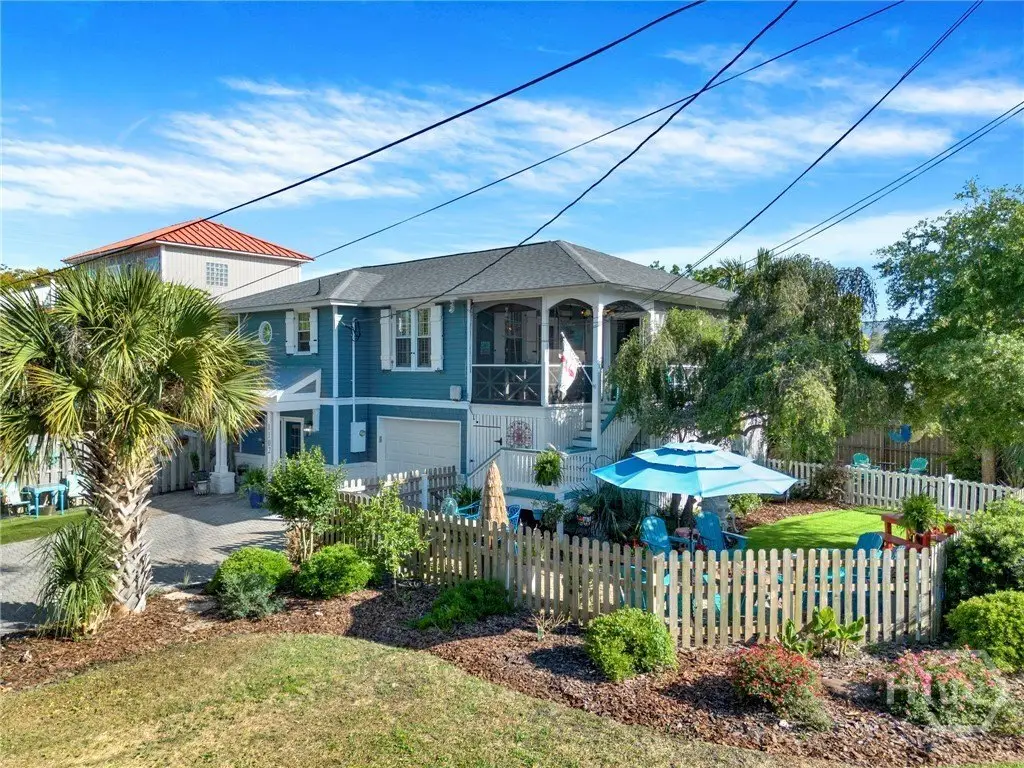
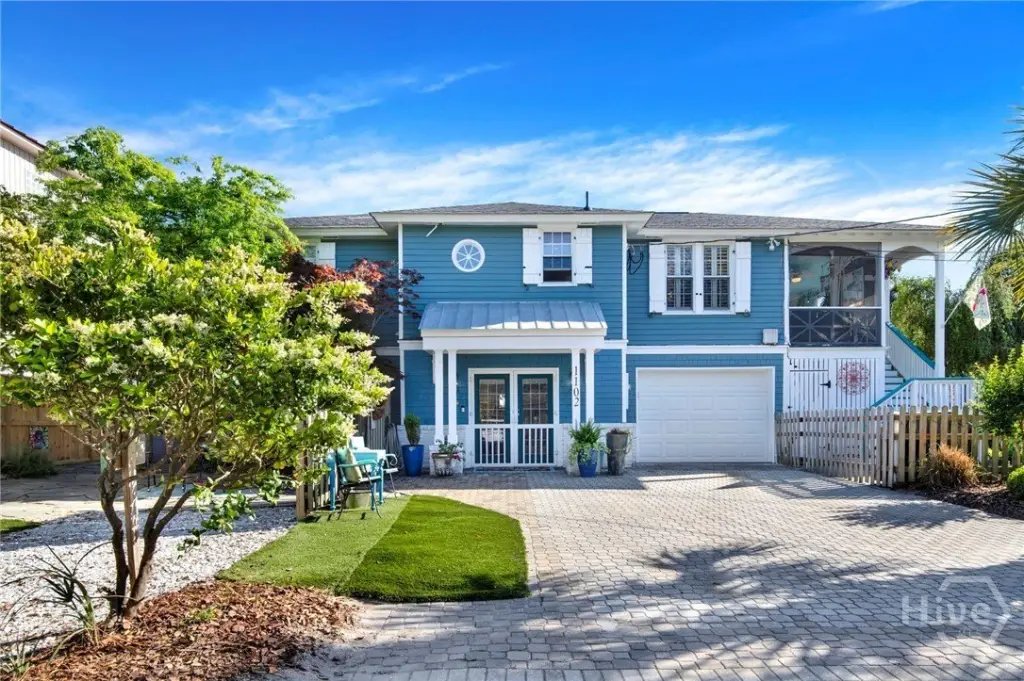
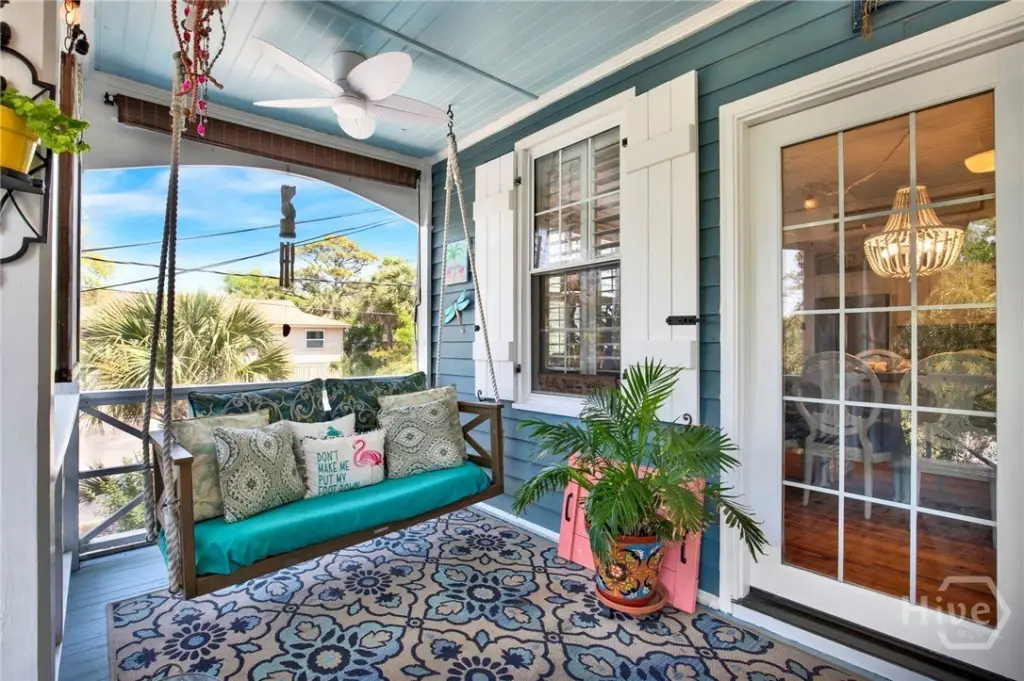
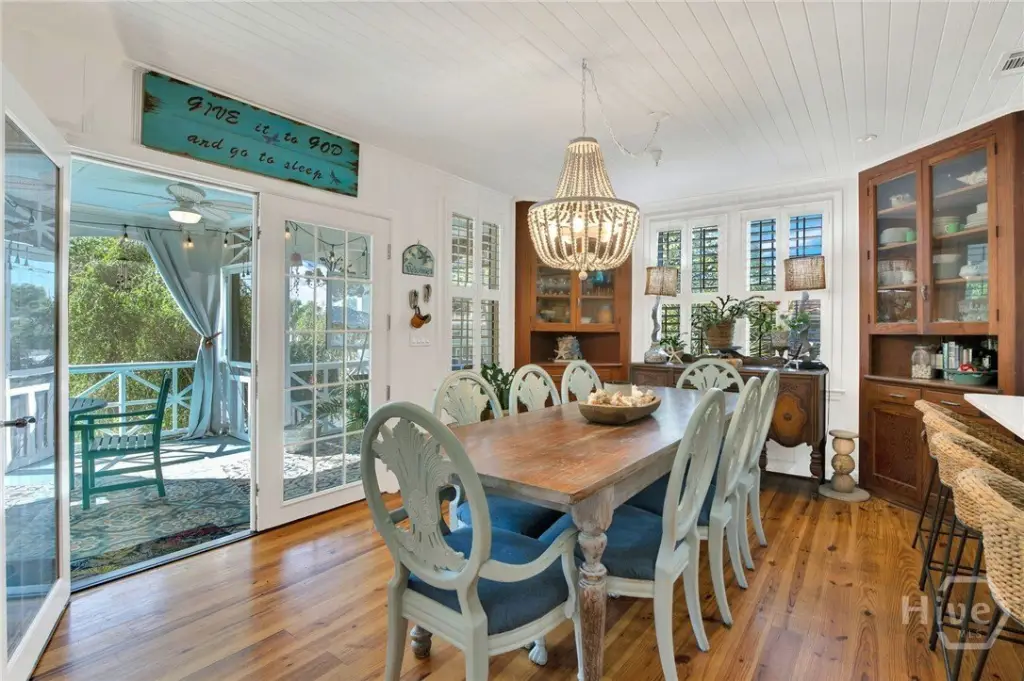
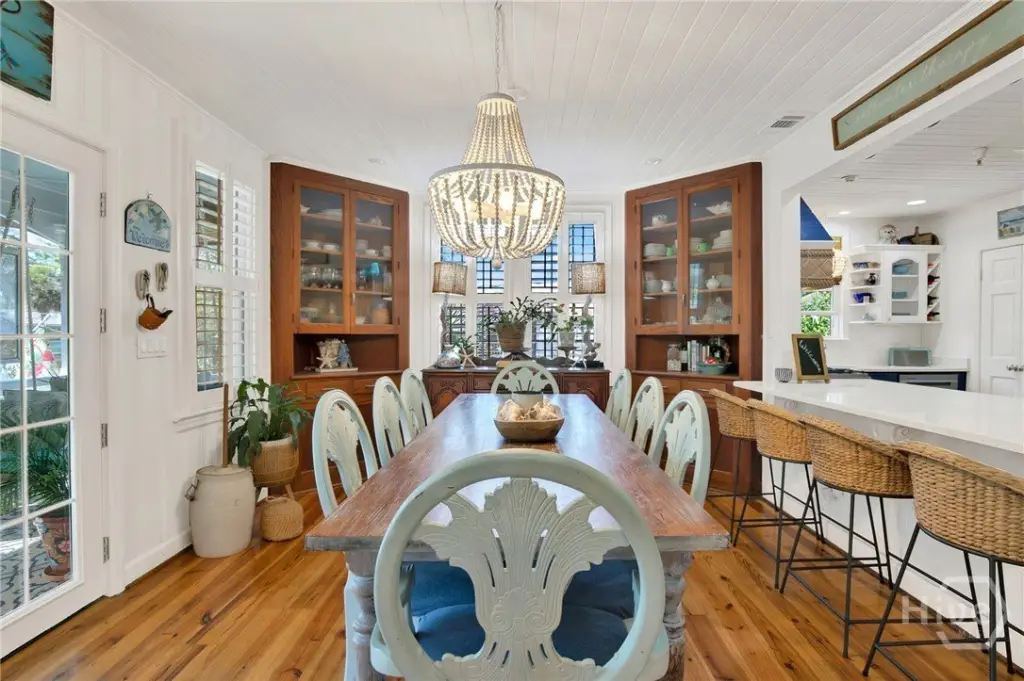
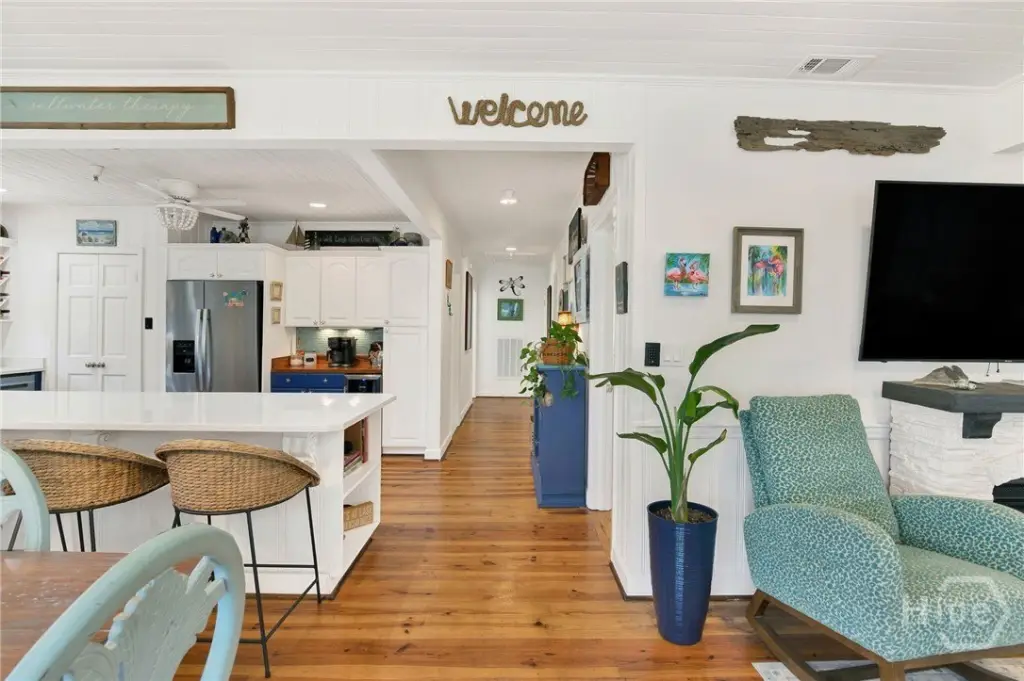
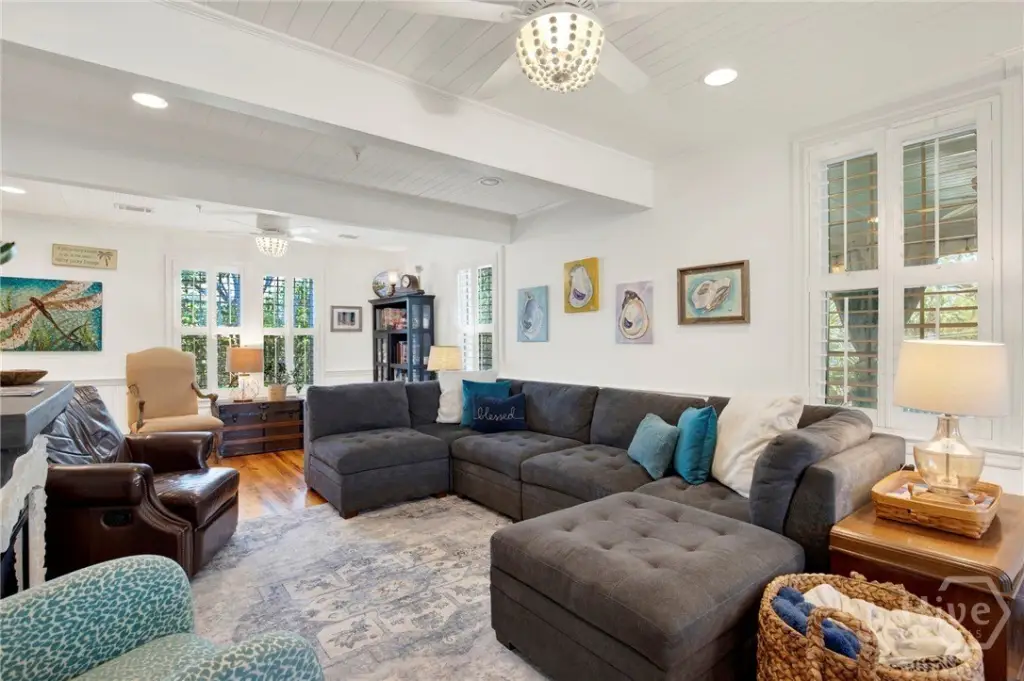
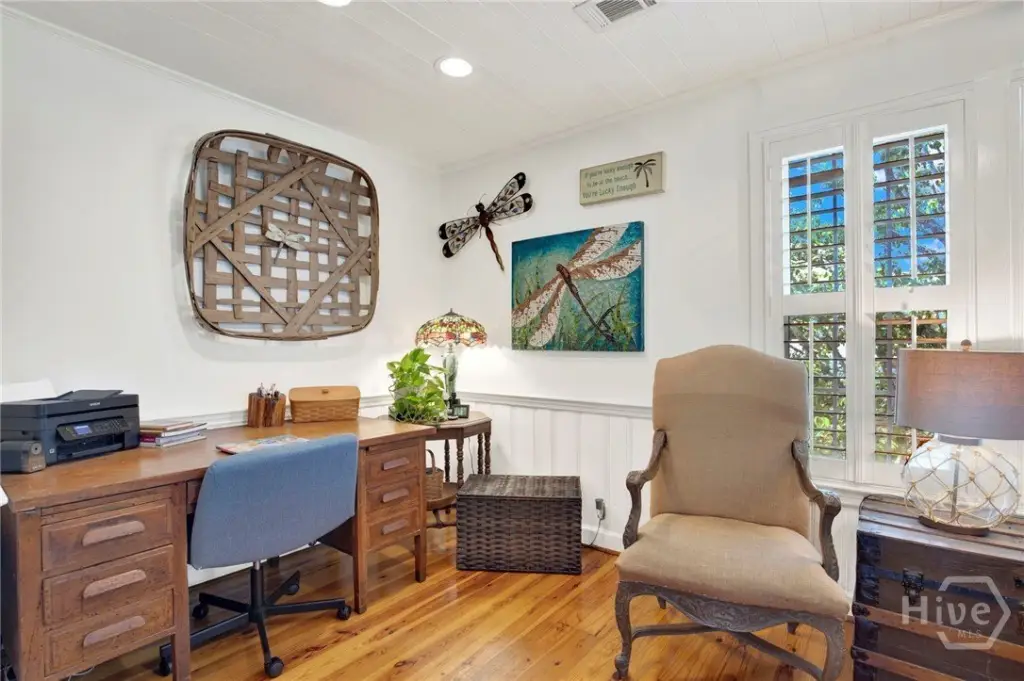
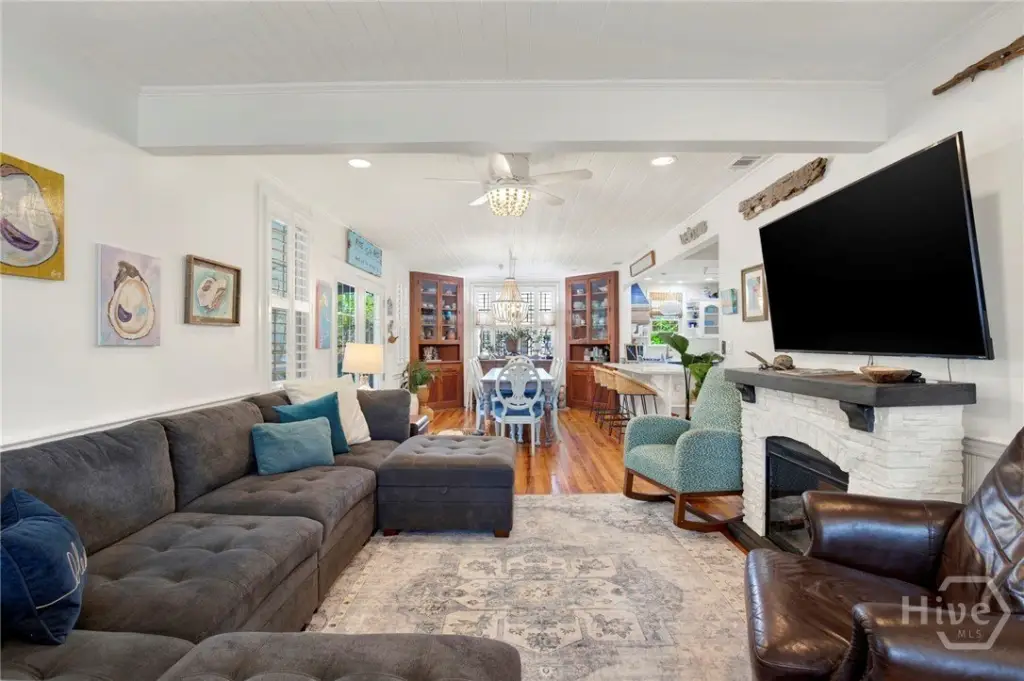
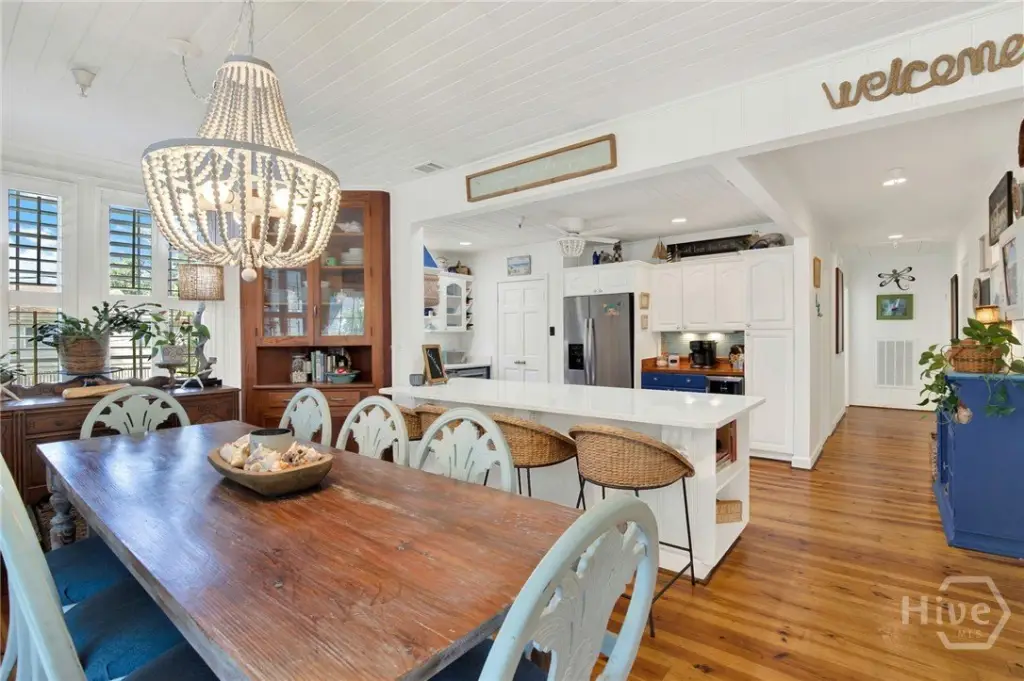
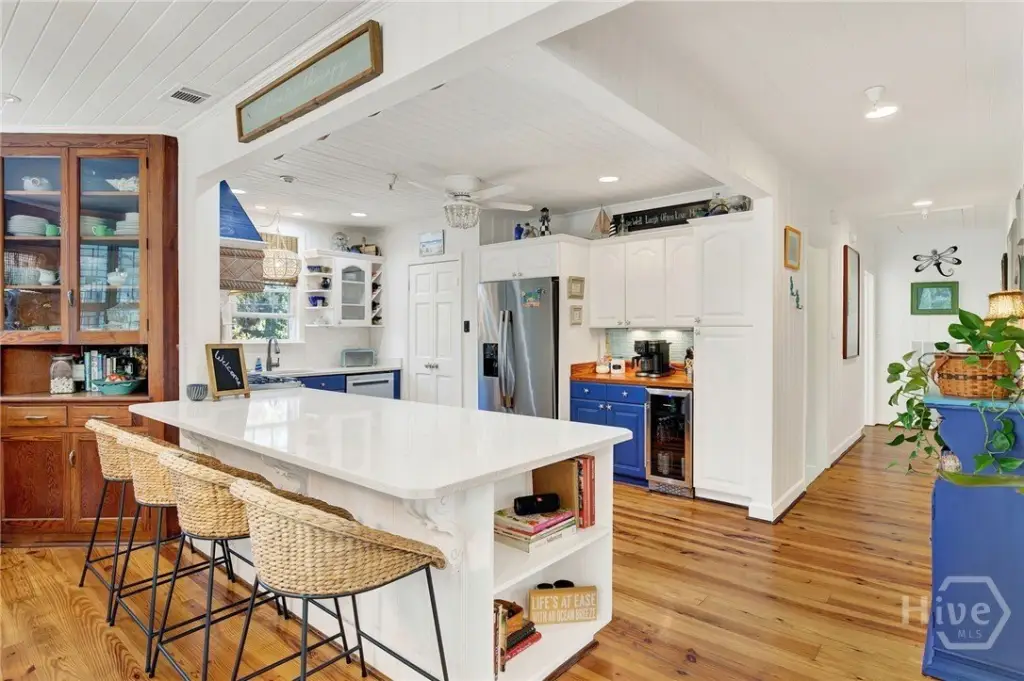
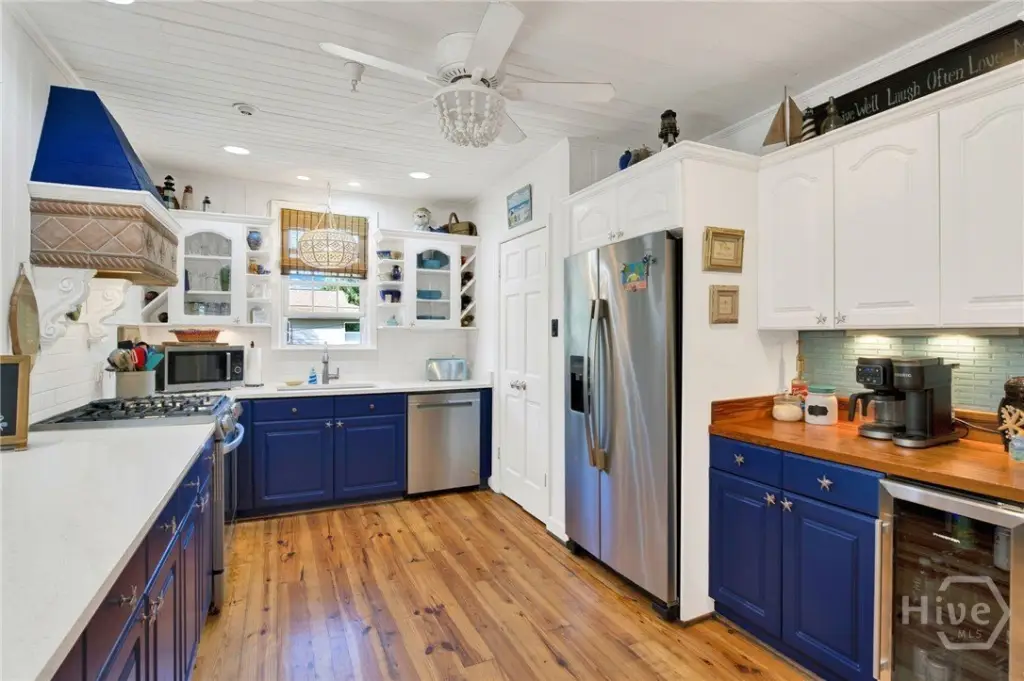
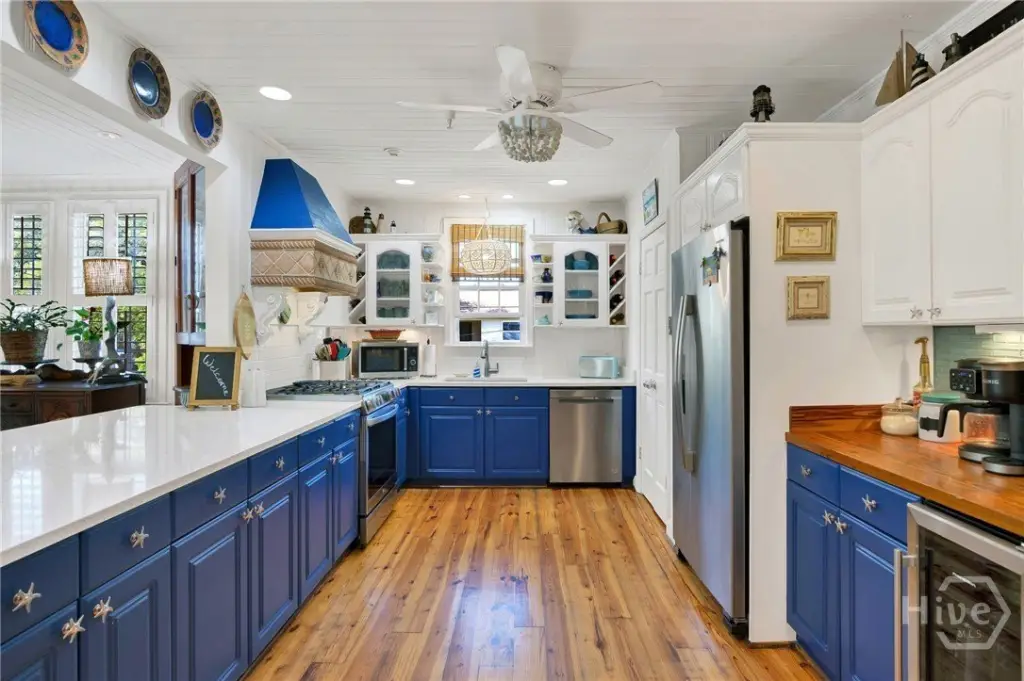
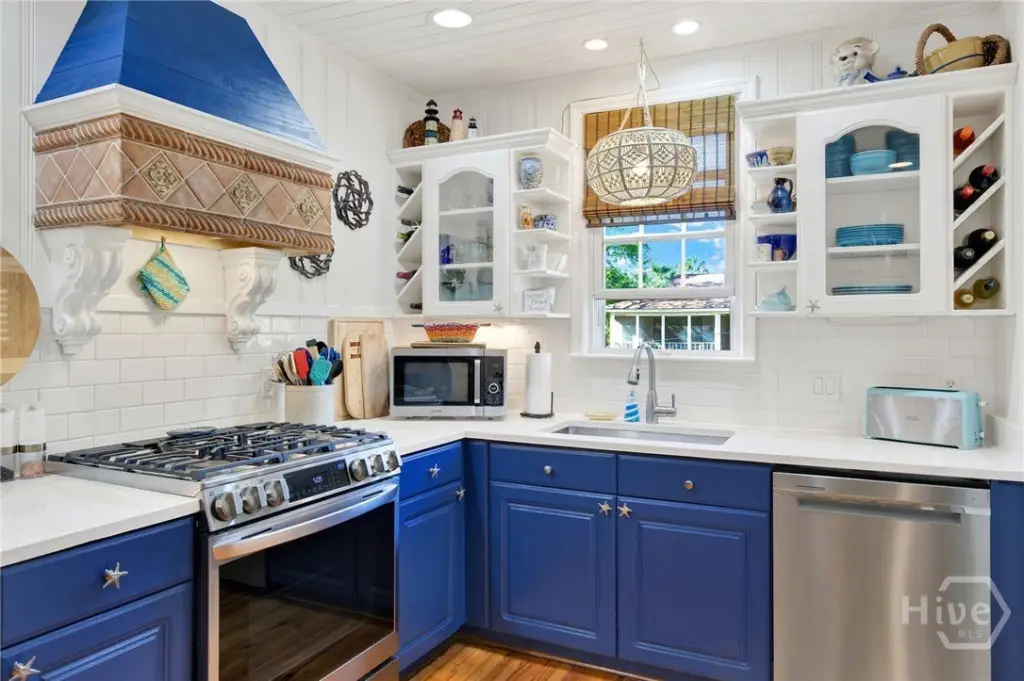
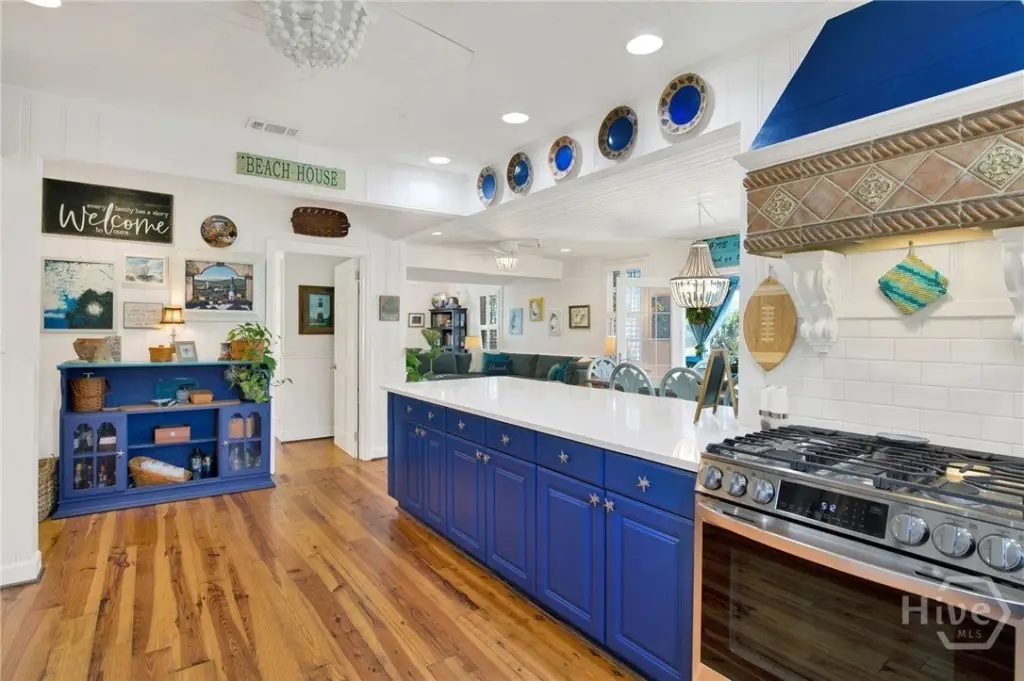
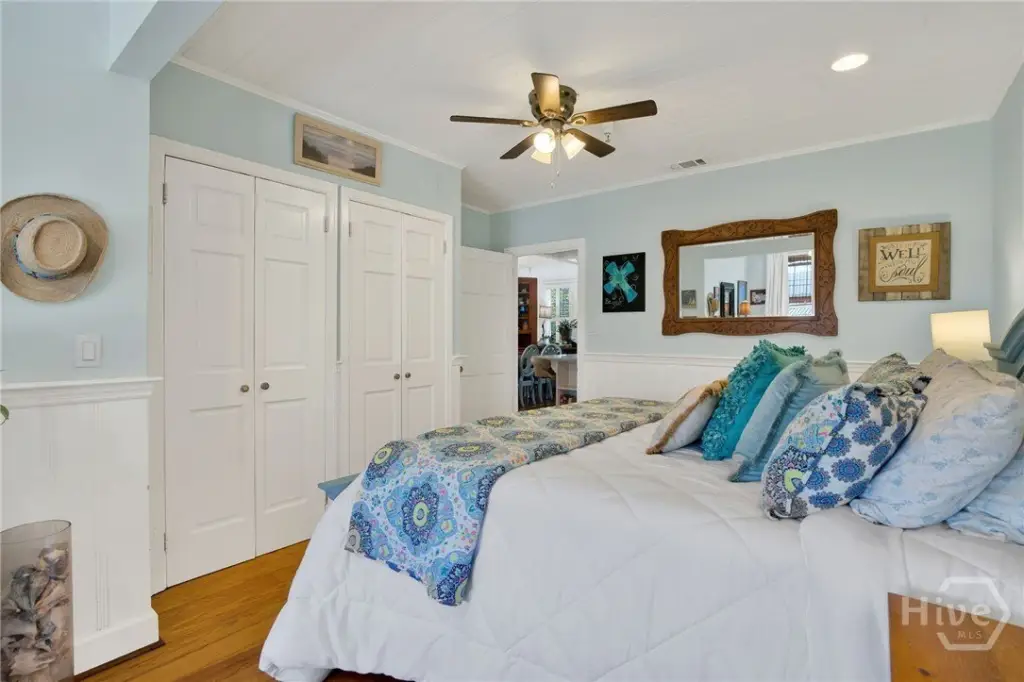
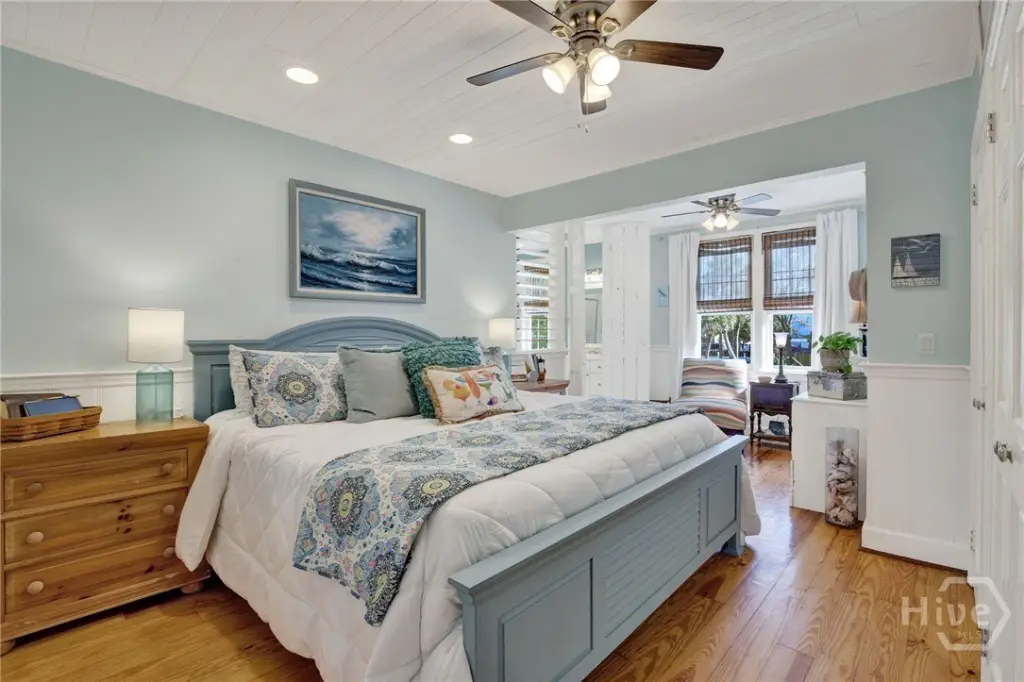
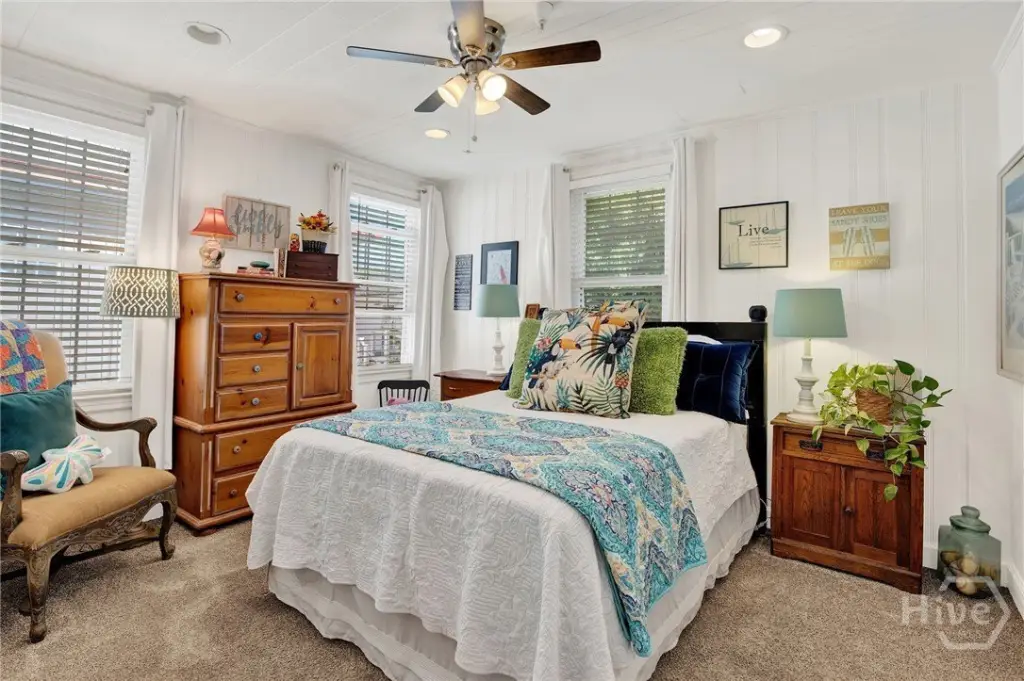
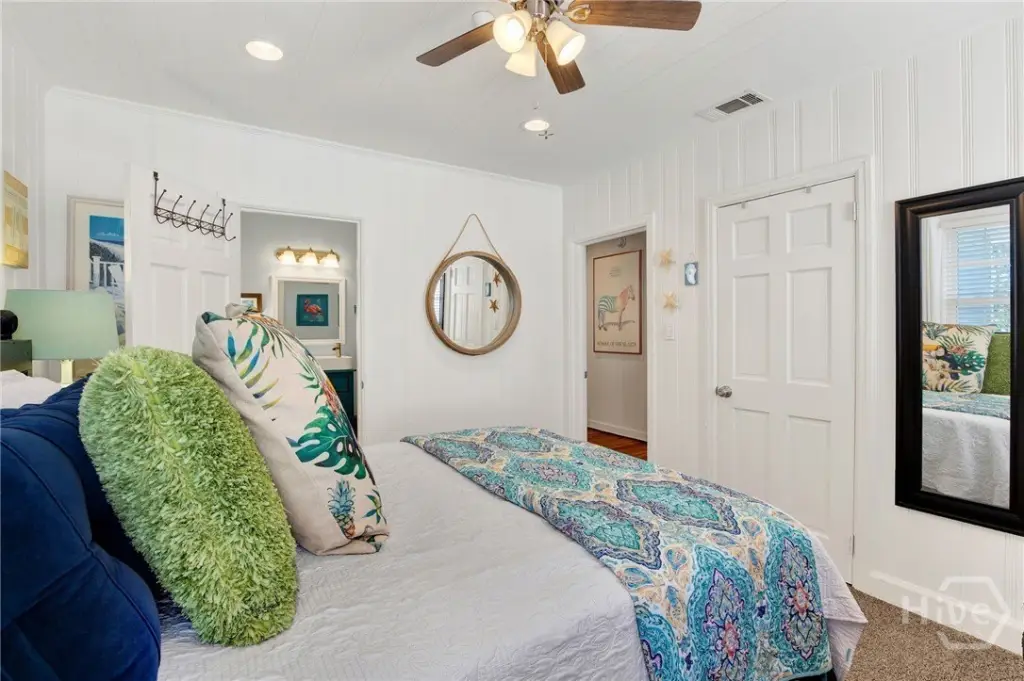
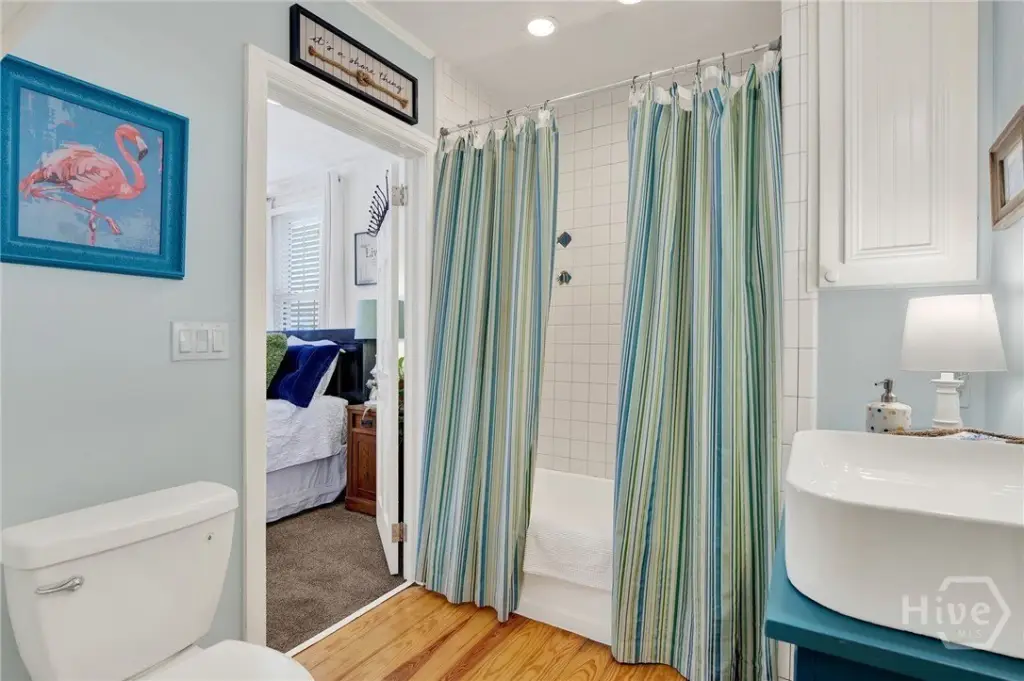
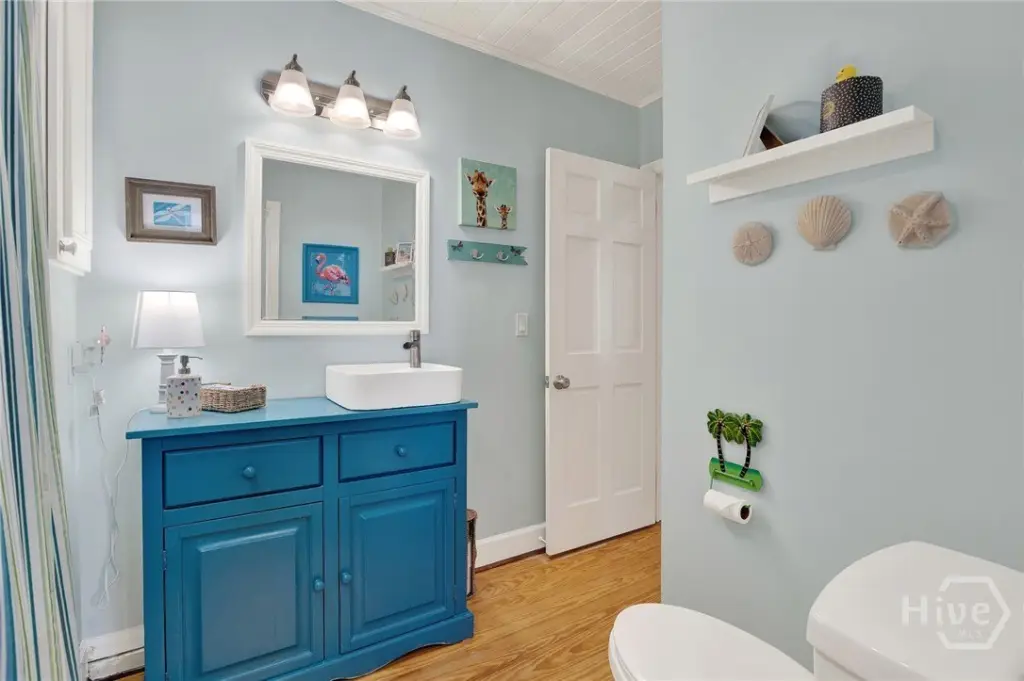
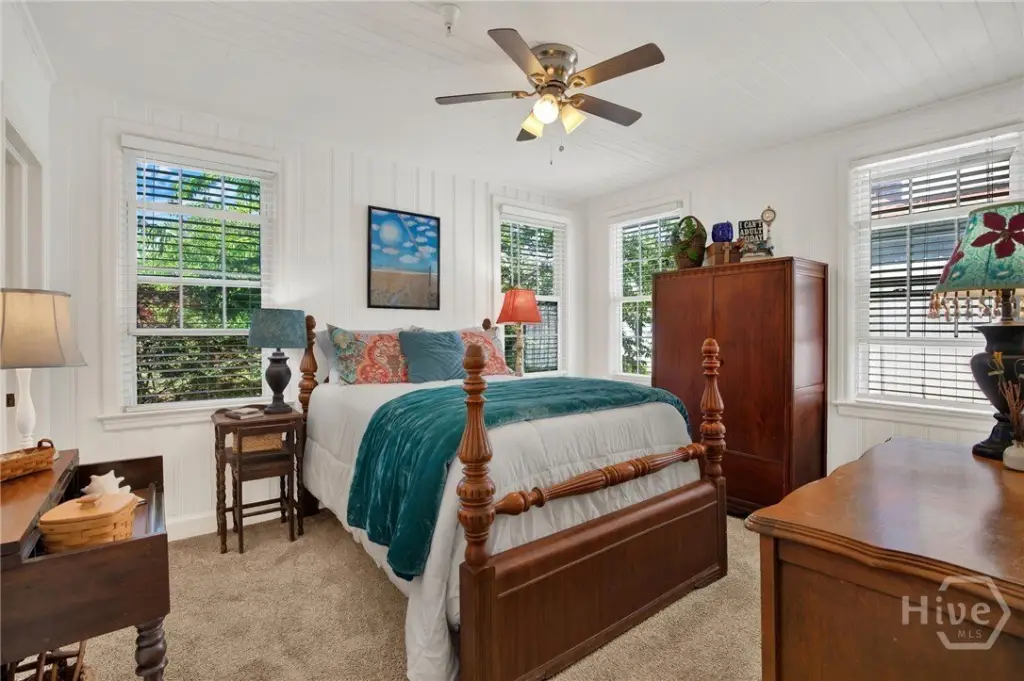
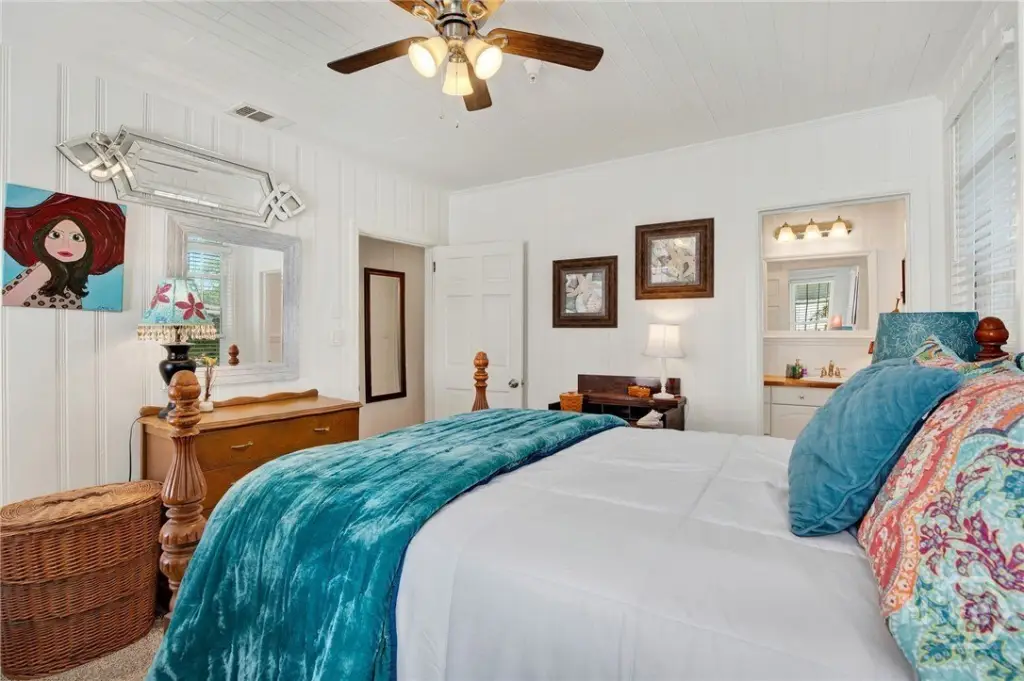
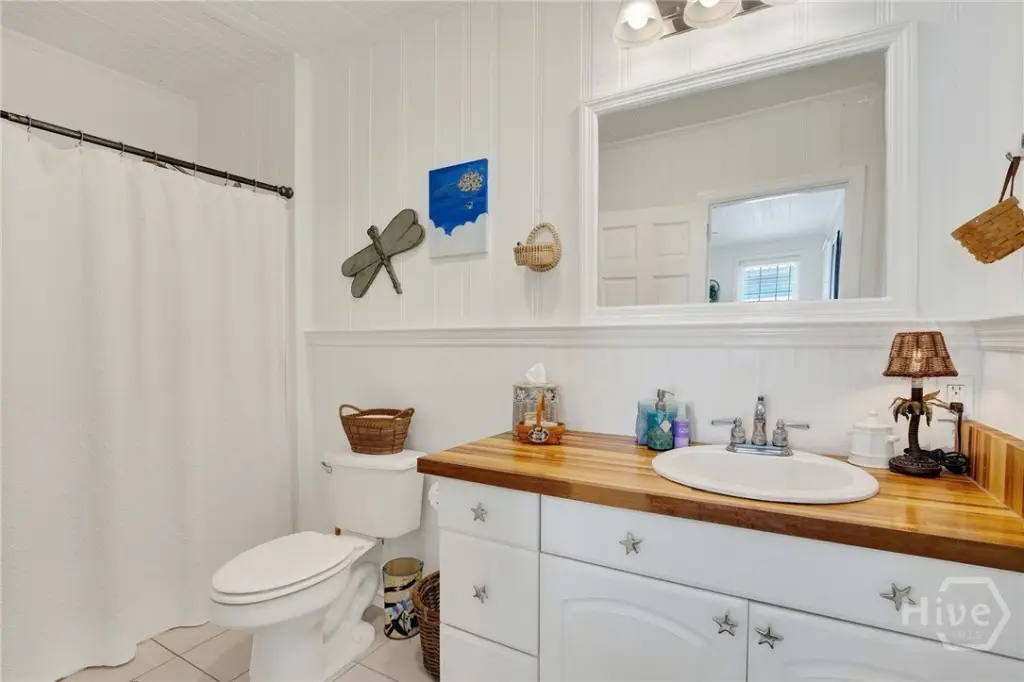
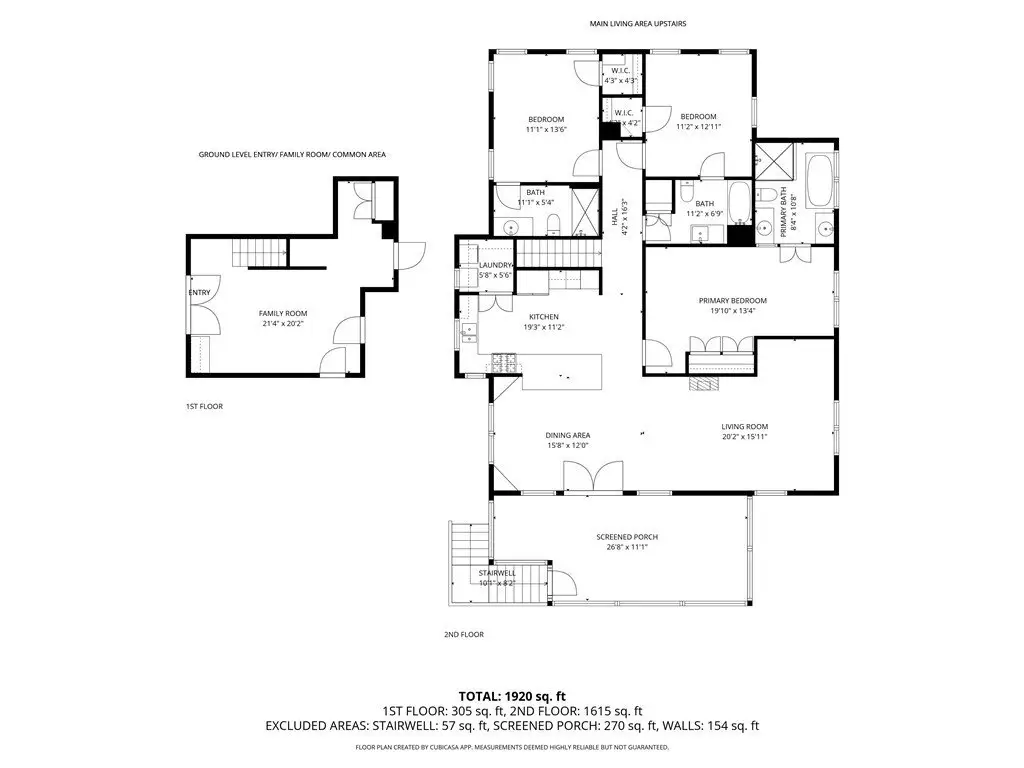
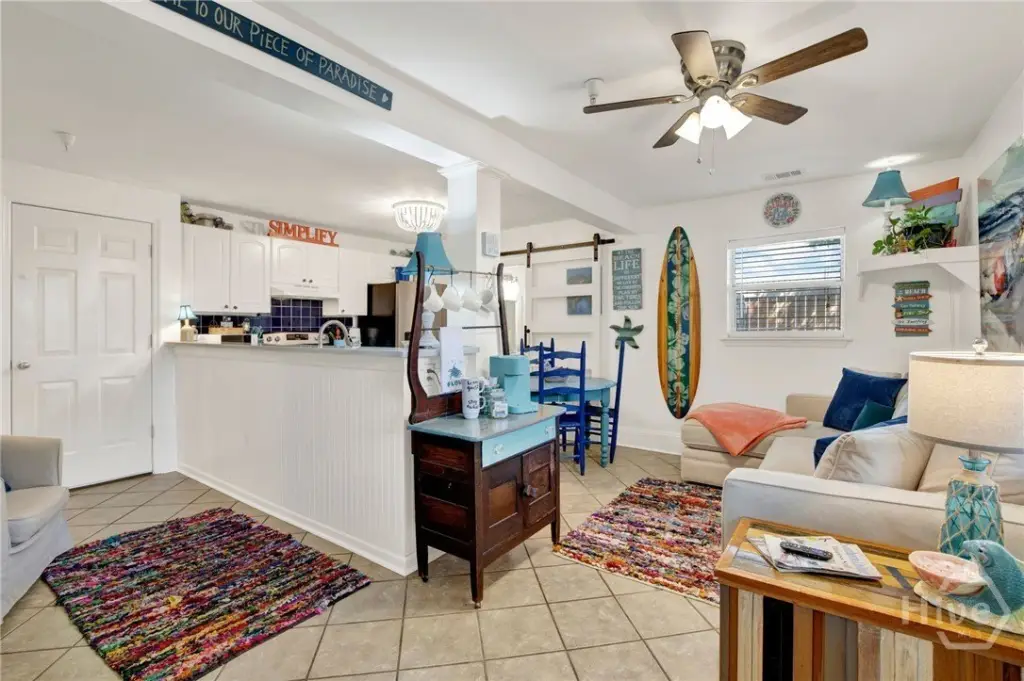
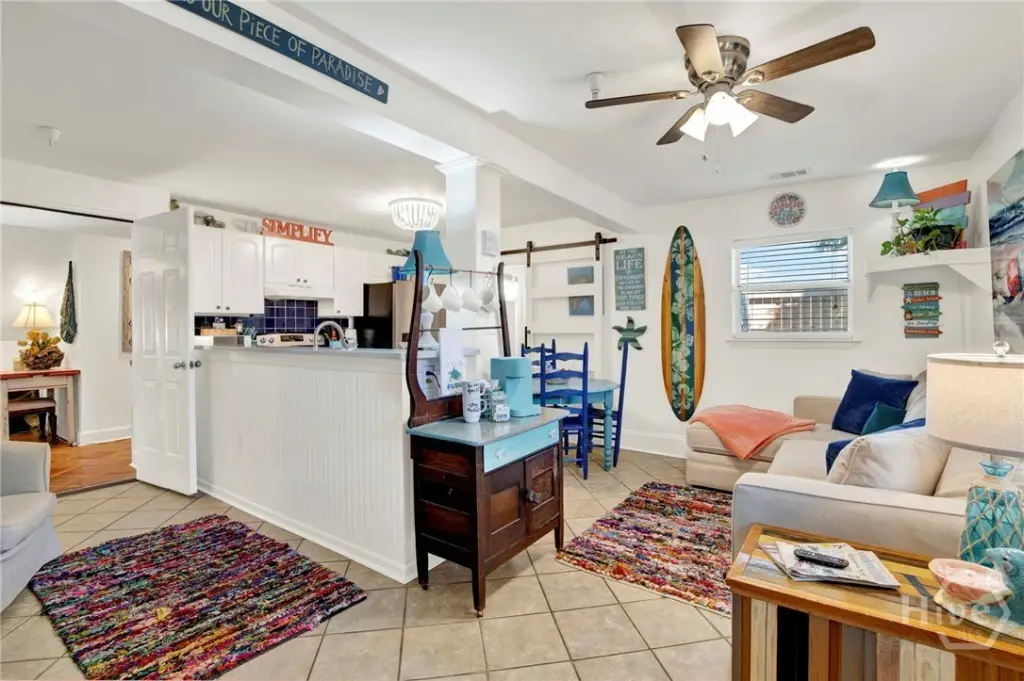
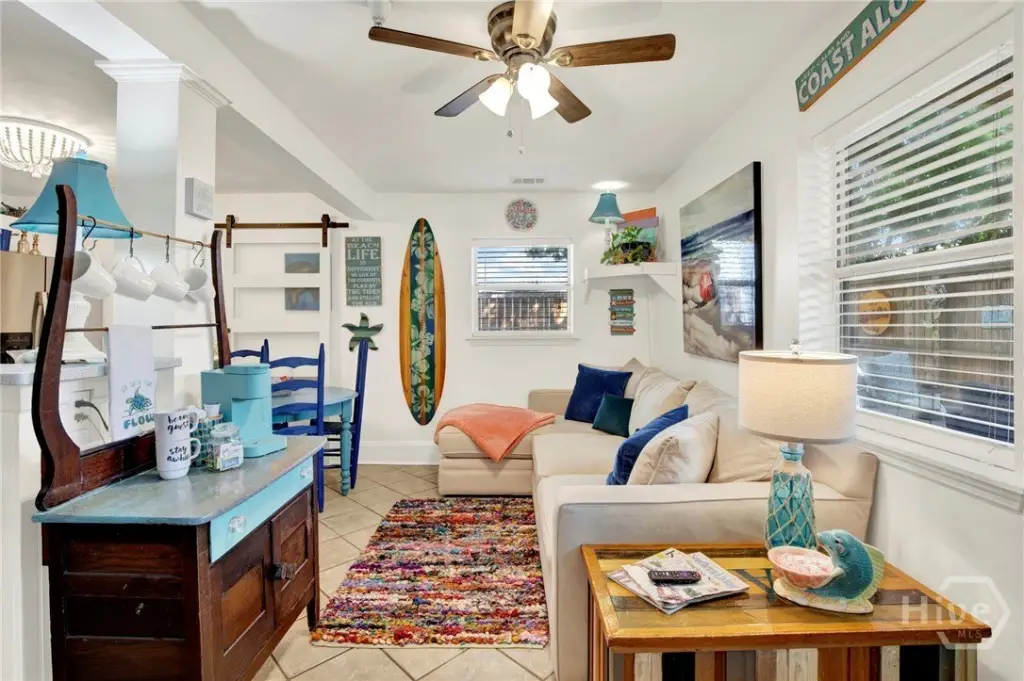
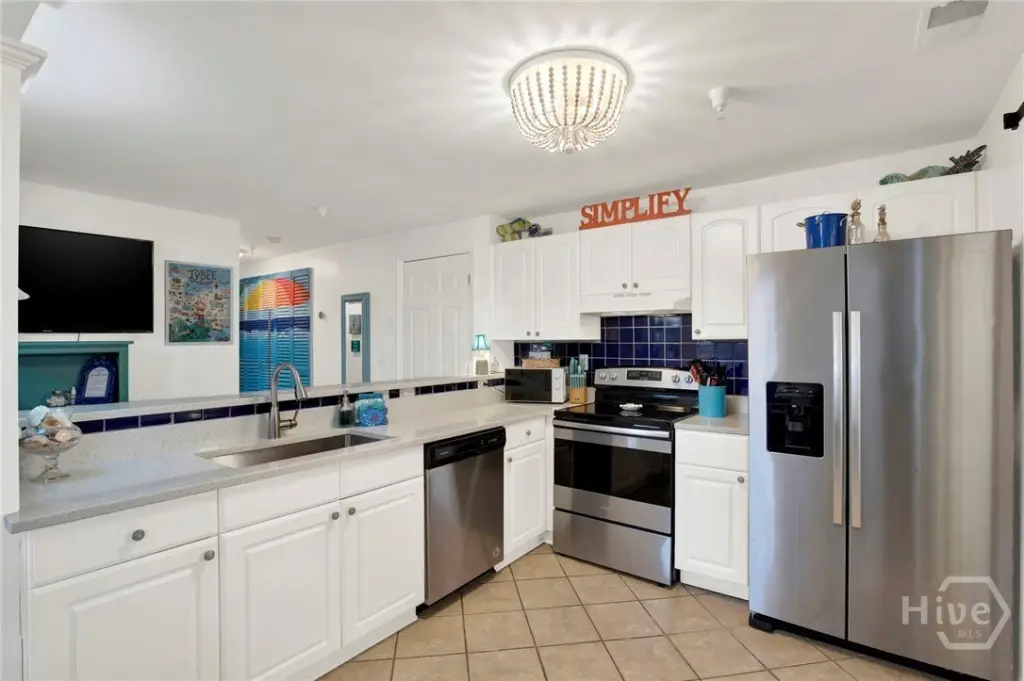
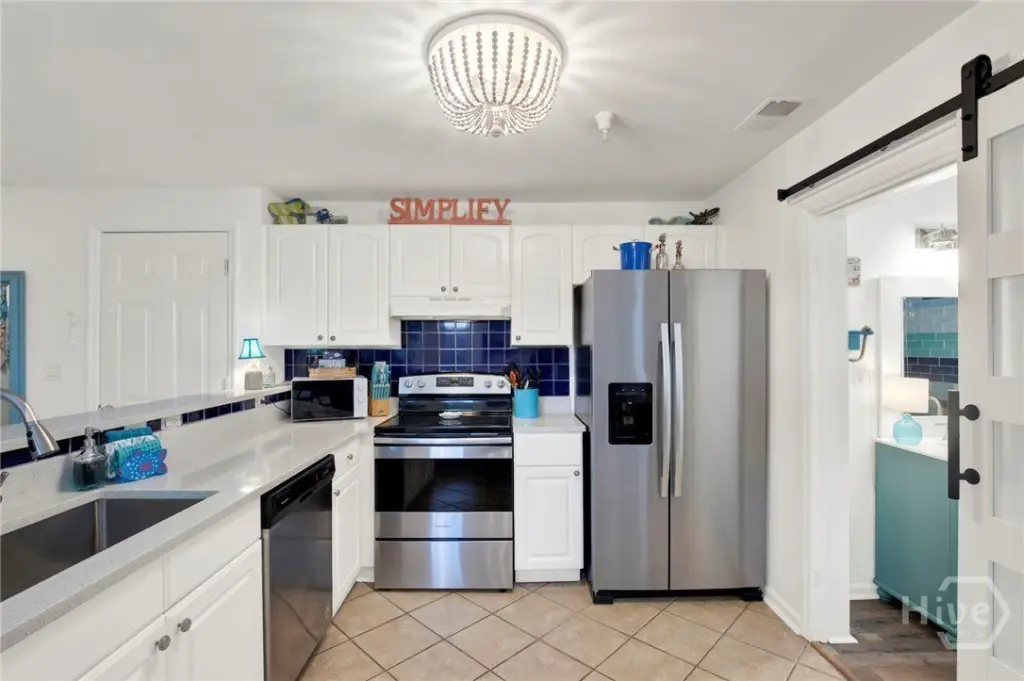
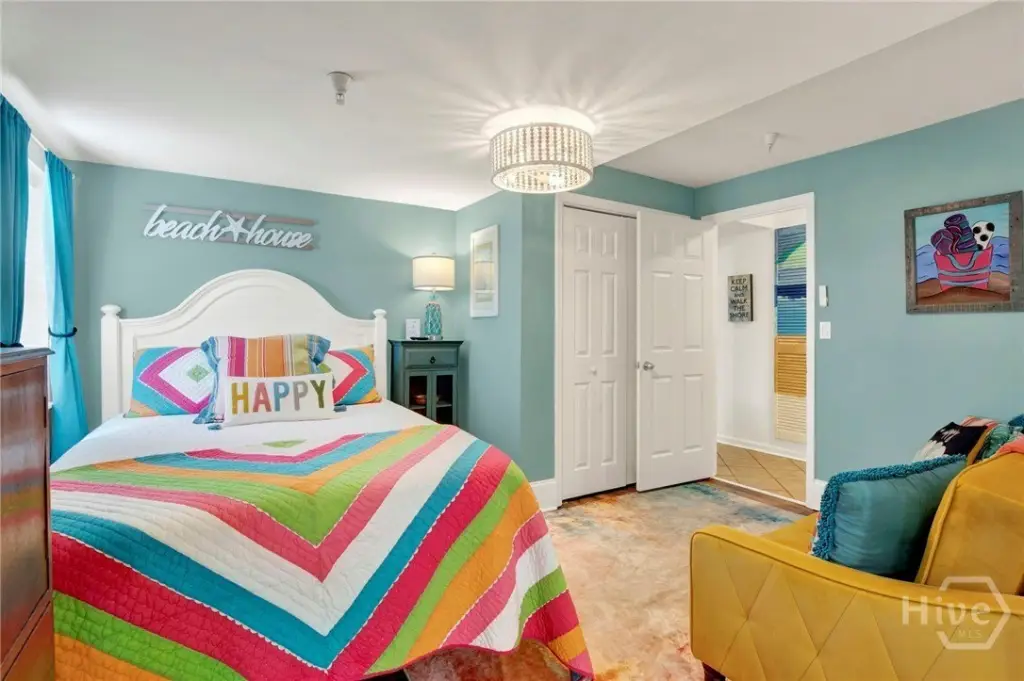
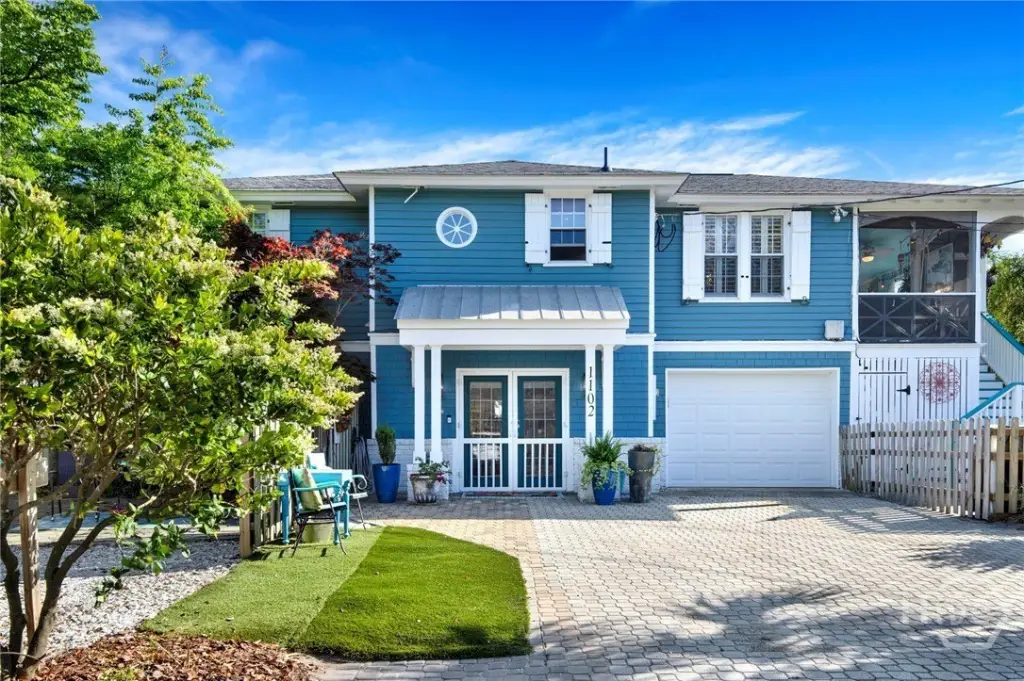
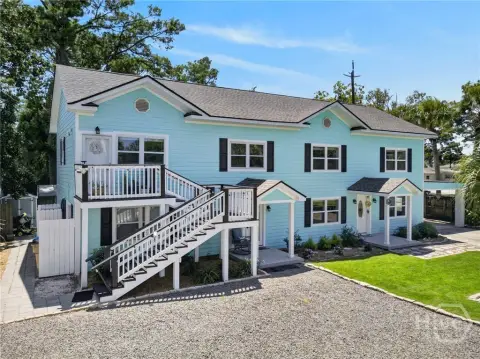
Built in 1932, this 3,258-square-foot triplex combines a principal residence with two separate lower-level accommodations. The upper floor includes three bedrooms, three bathrooms, three living areas, original heart pine flooring, high ceilings, built-in corner cupboards, and other historic architectural details. Its updated kitchen includes quartz countertops, a gas cooktop, wine refrigerator, and a 10-foot peninsula with bar seating.
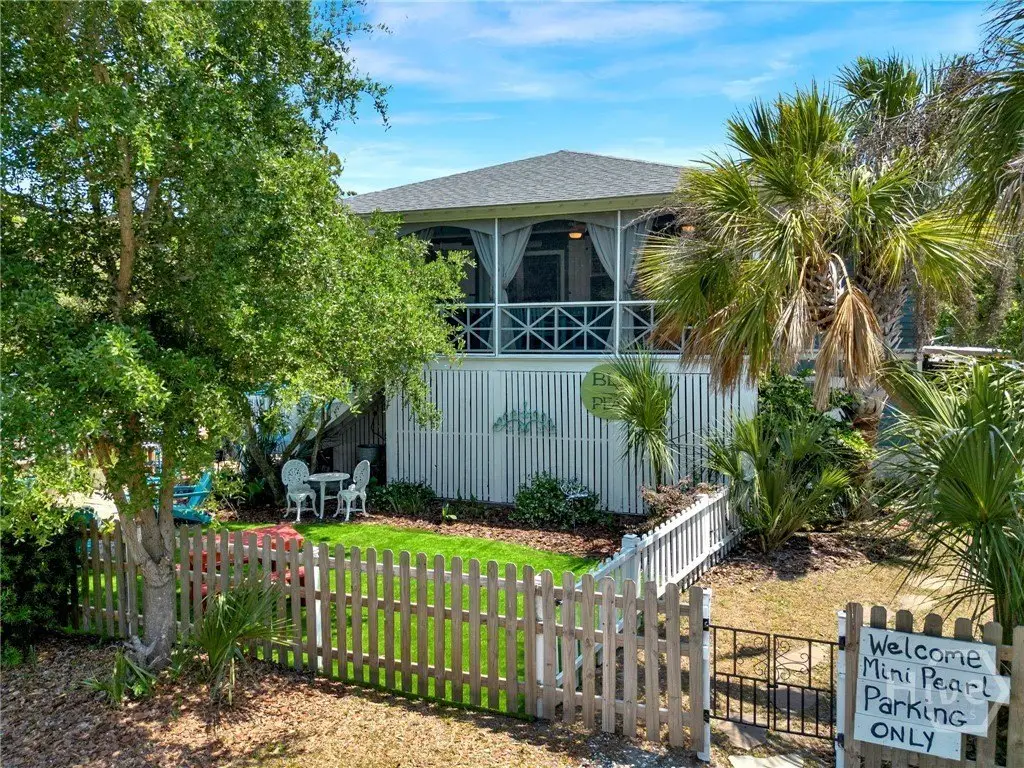
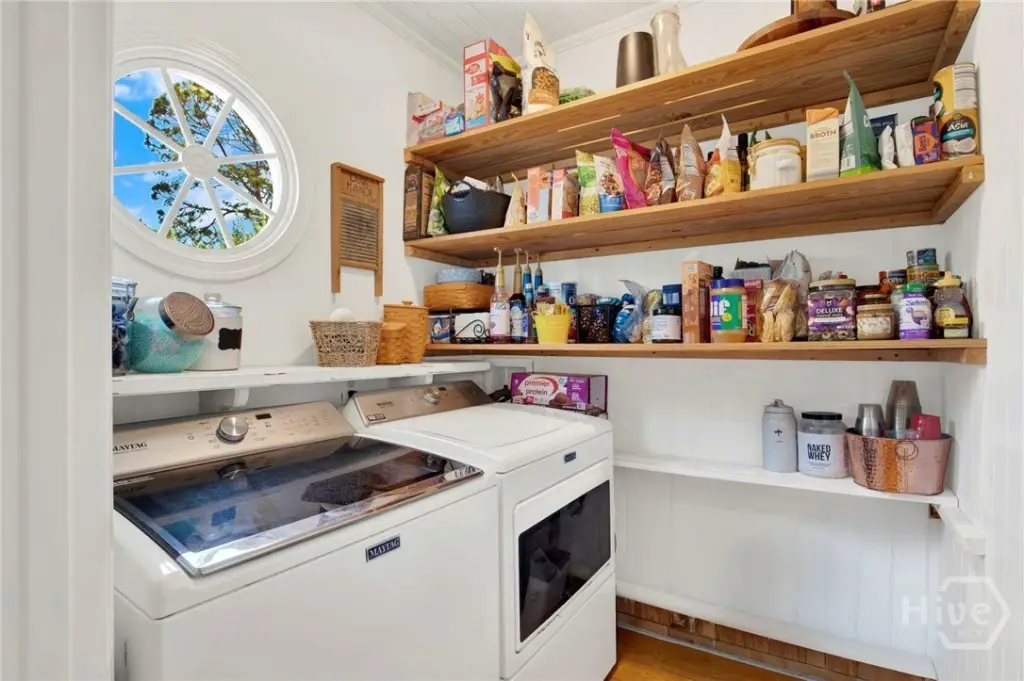
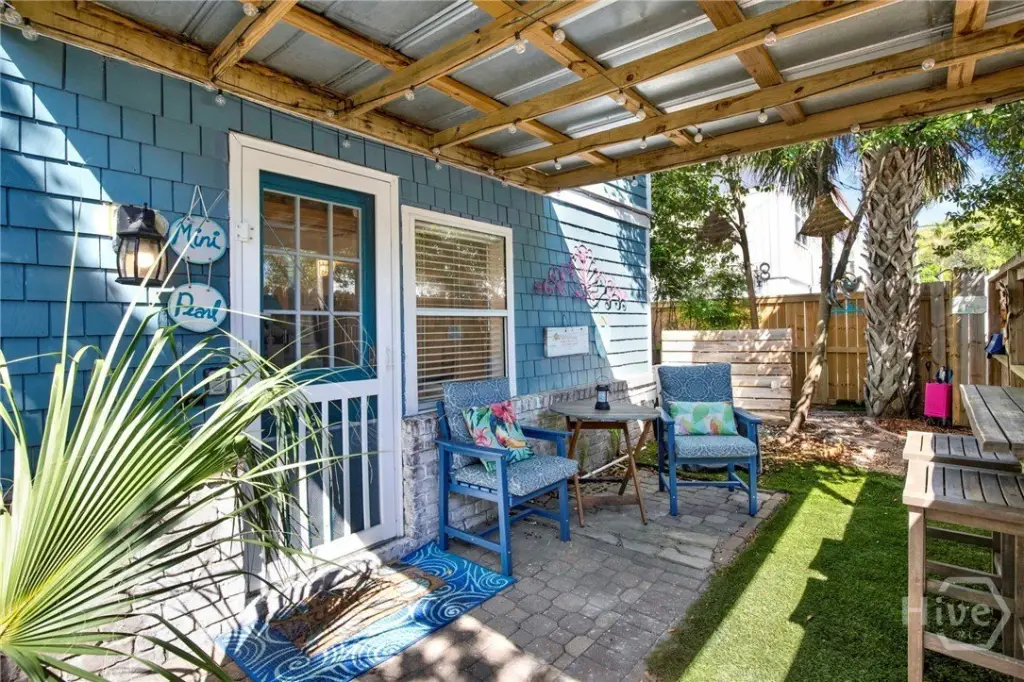
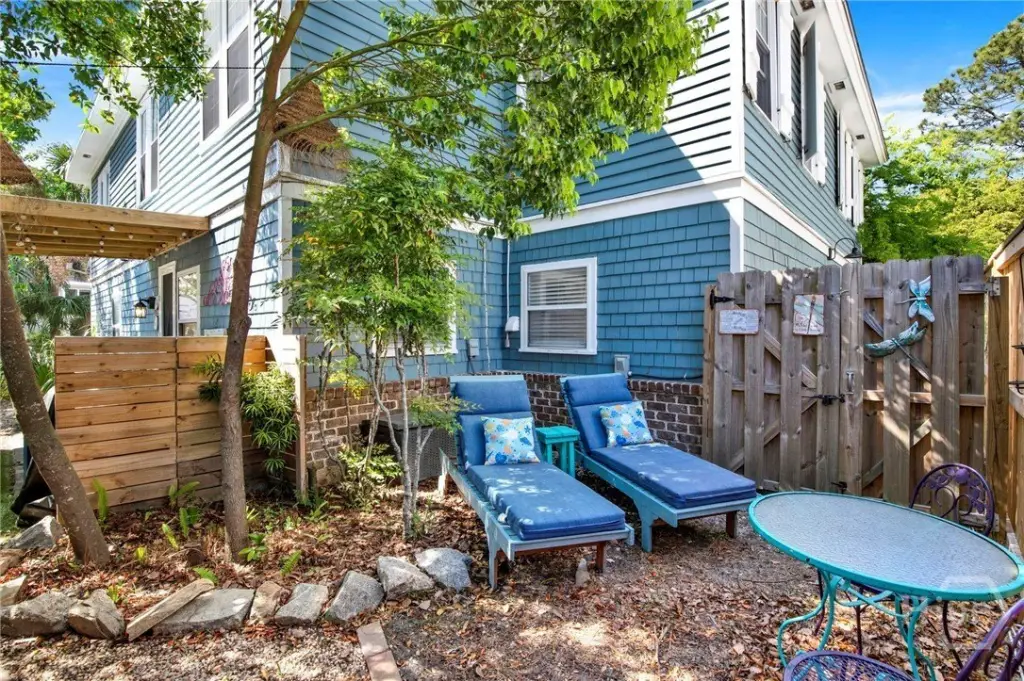
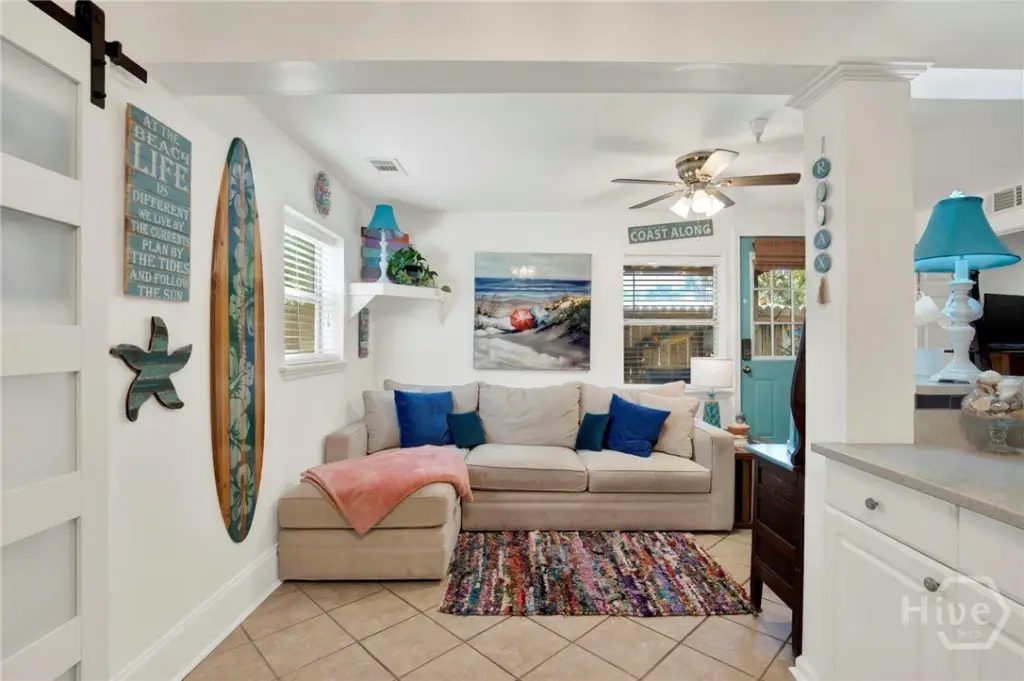
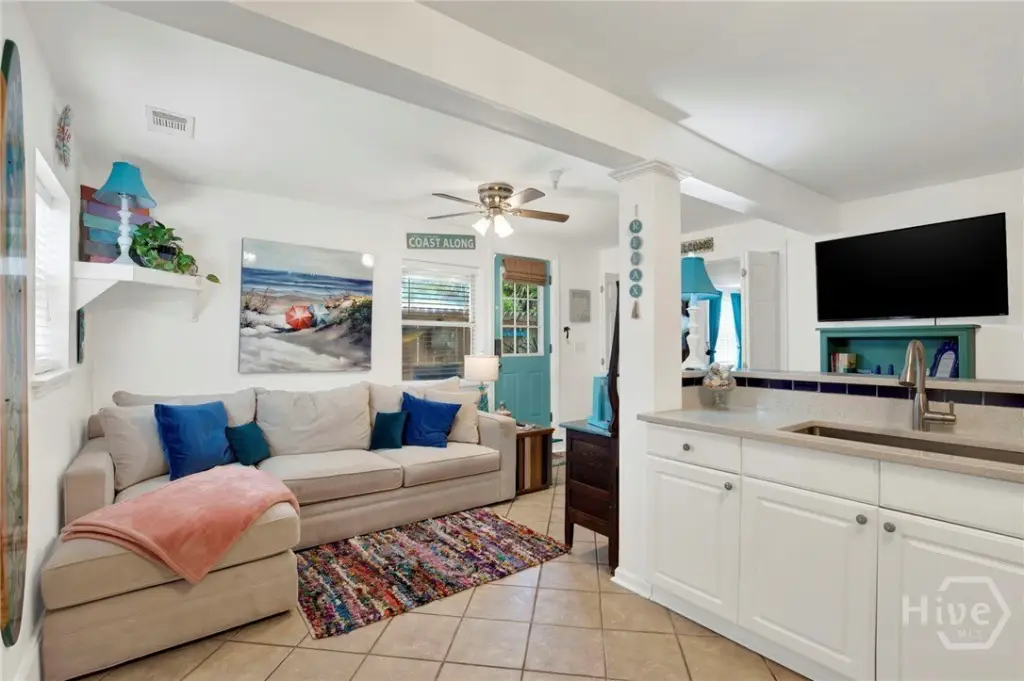
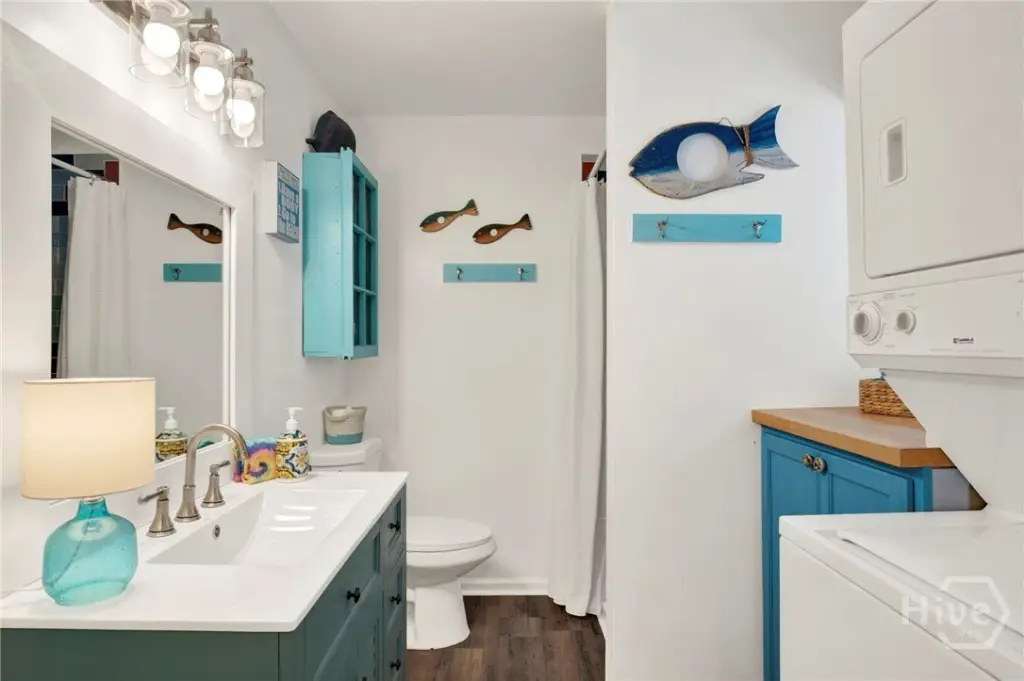
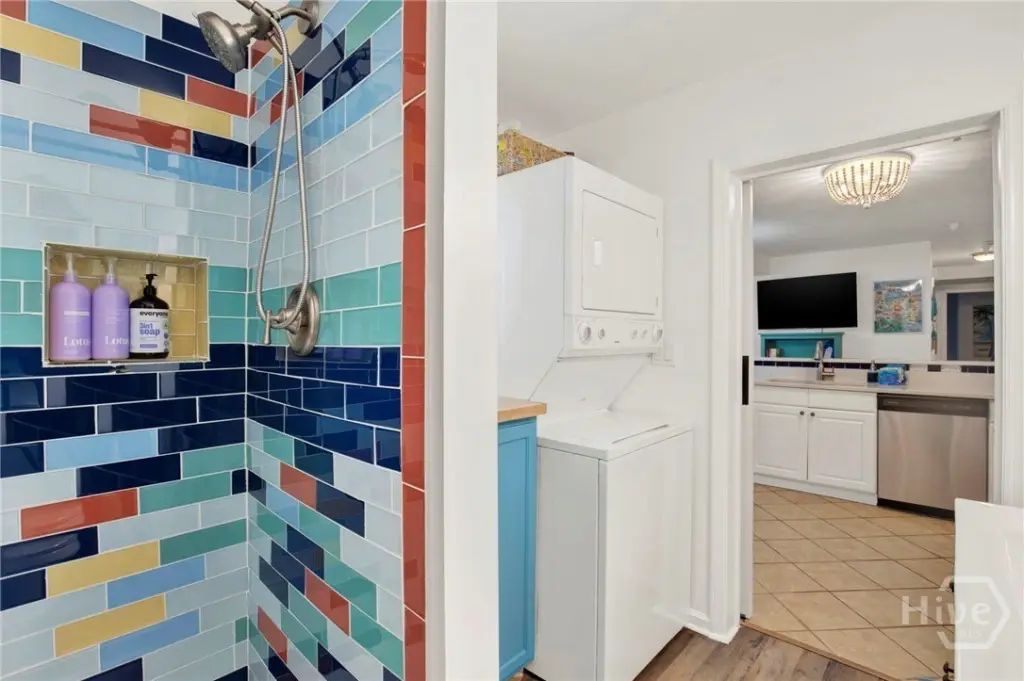
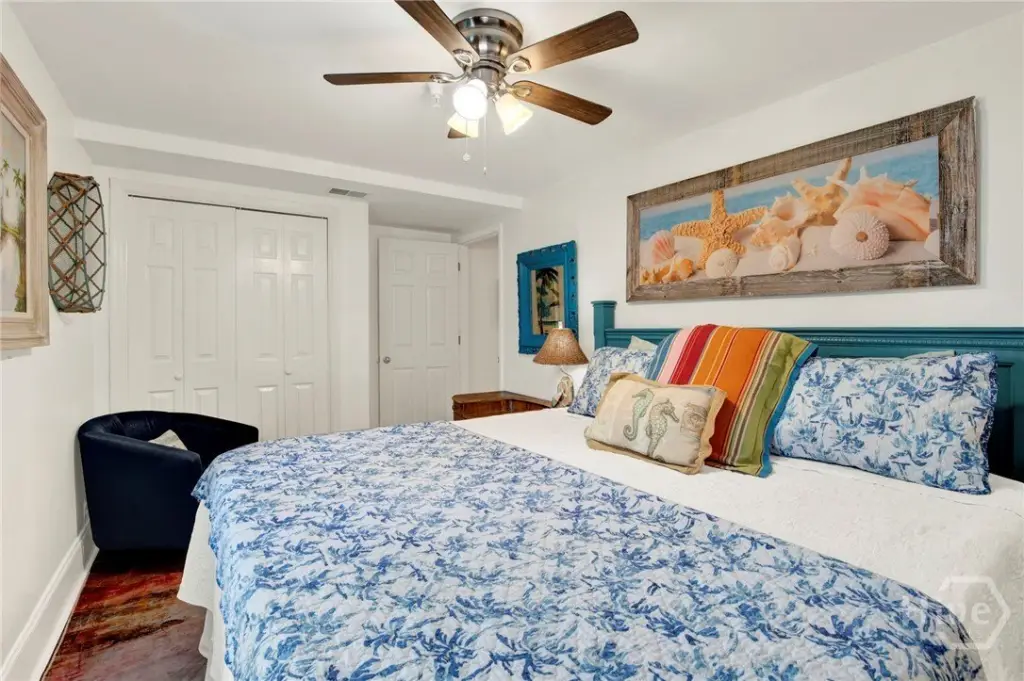
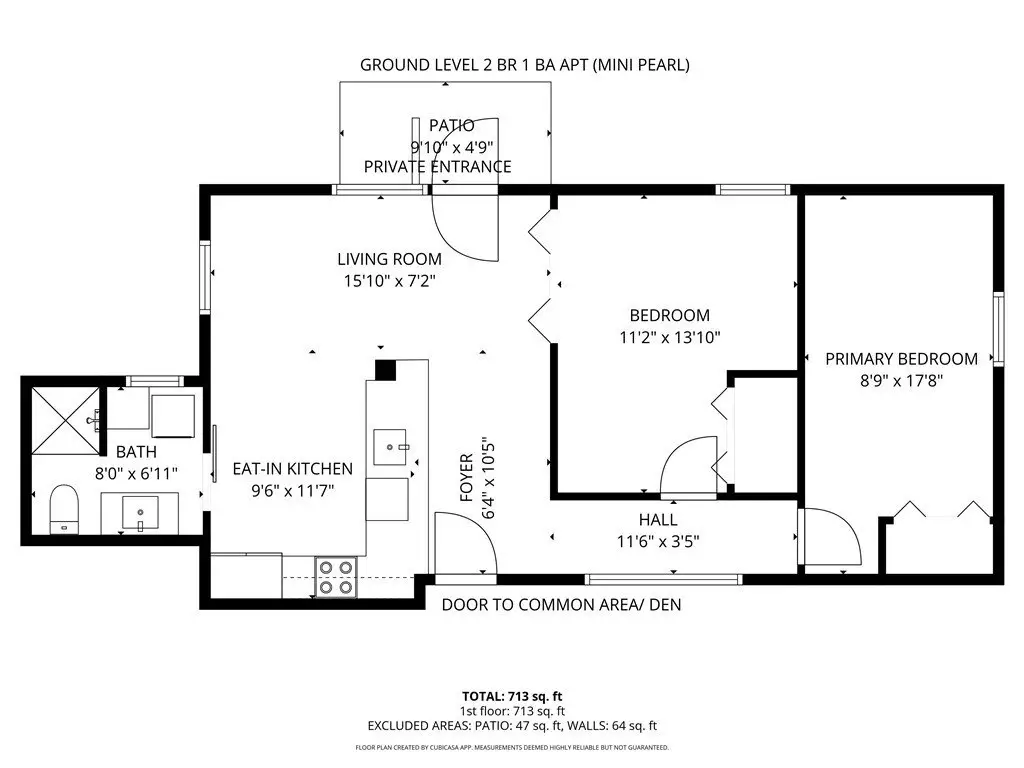
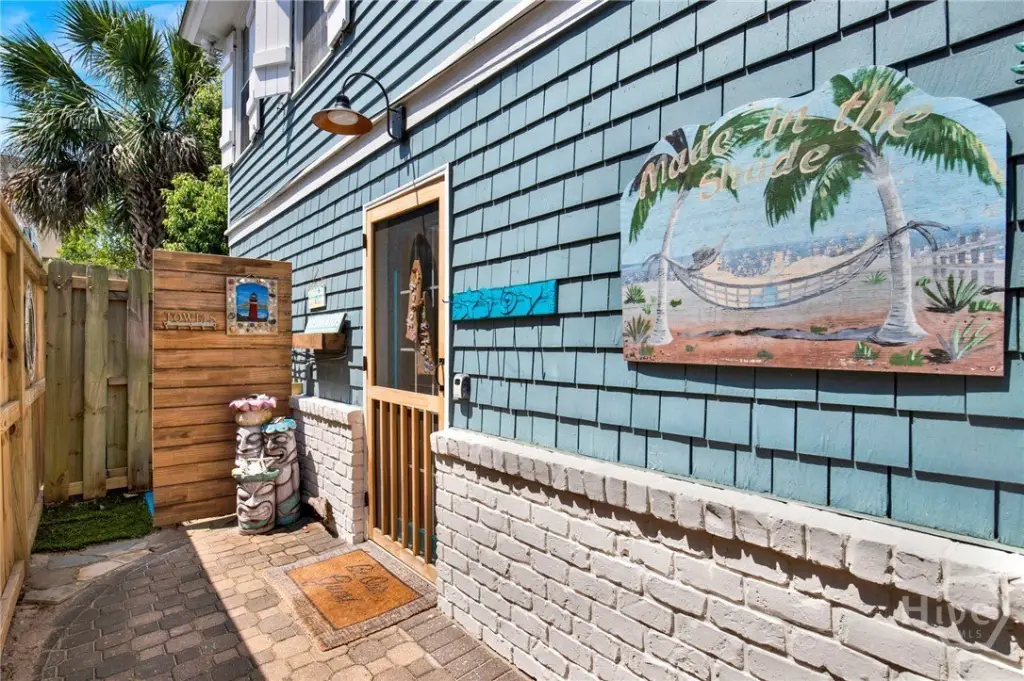
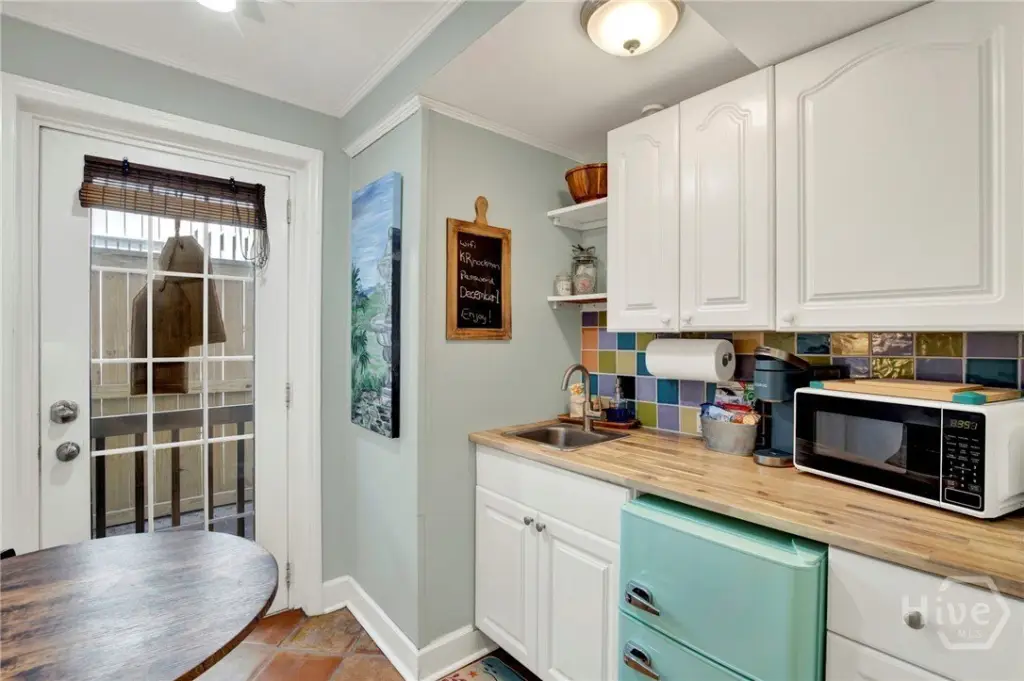
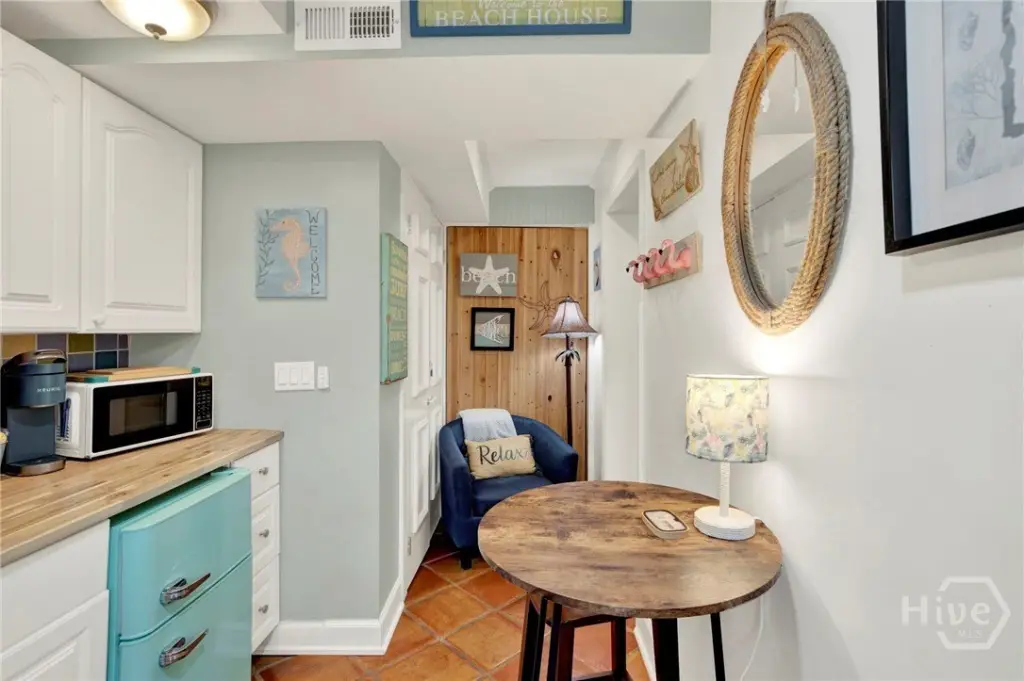
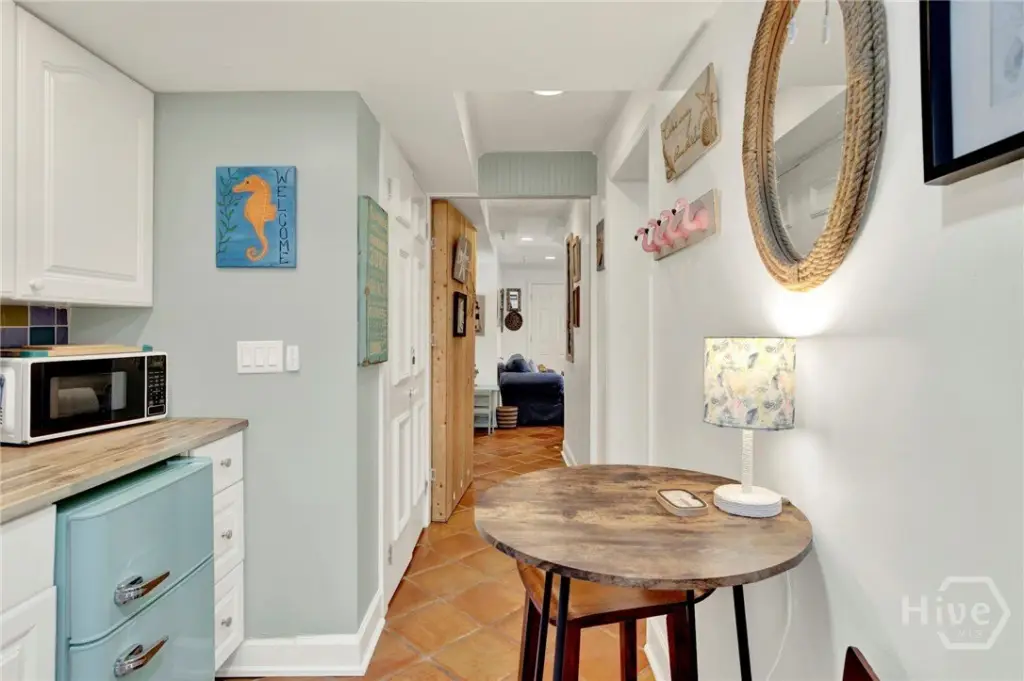
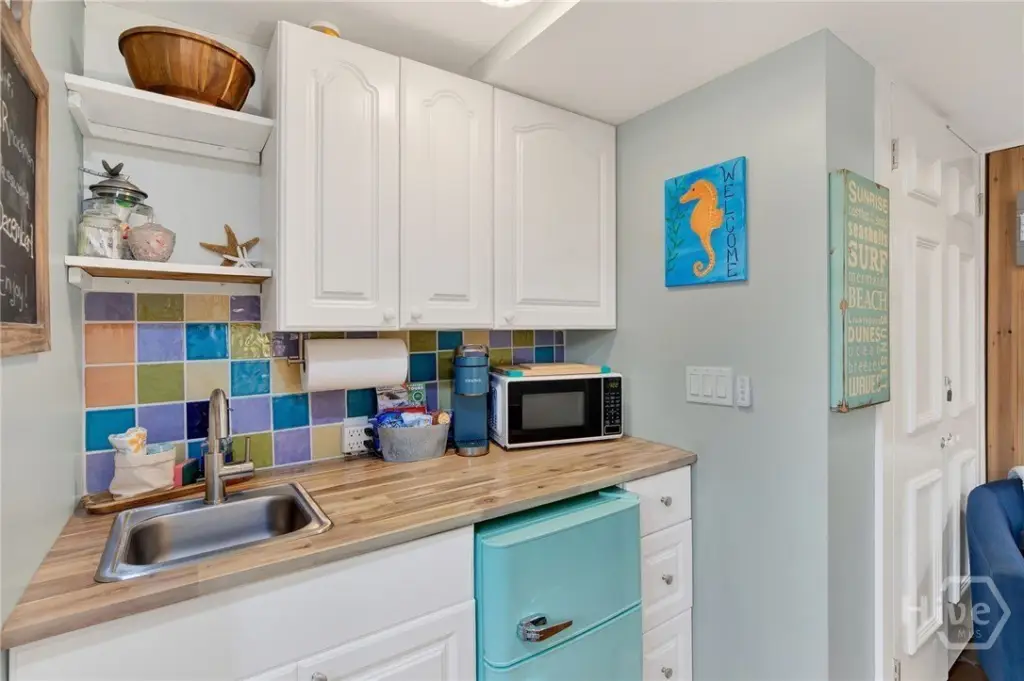
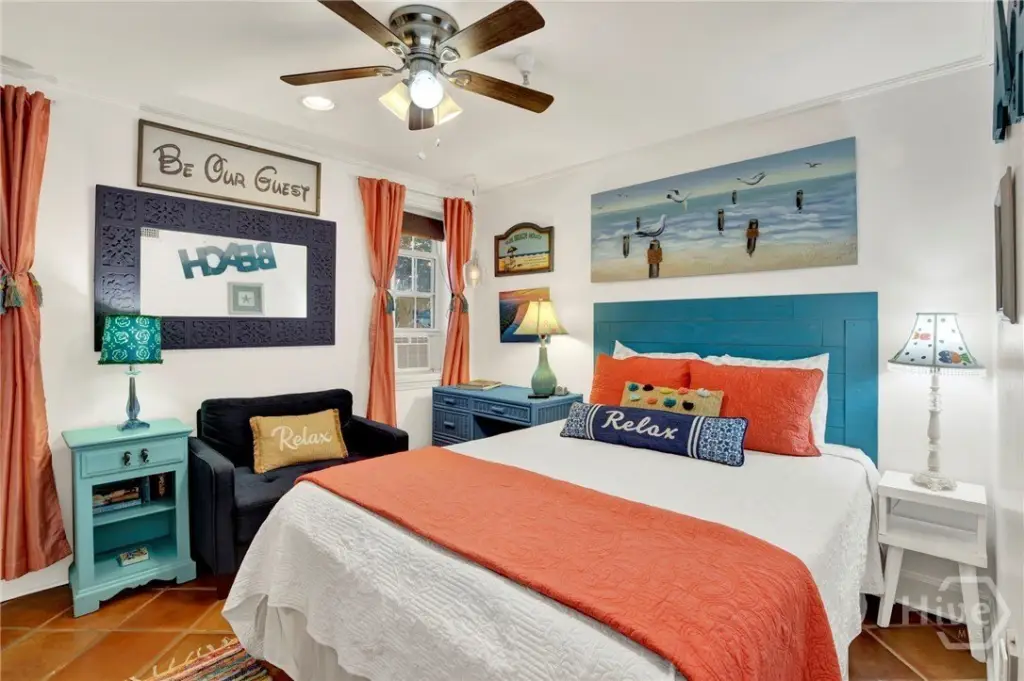
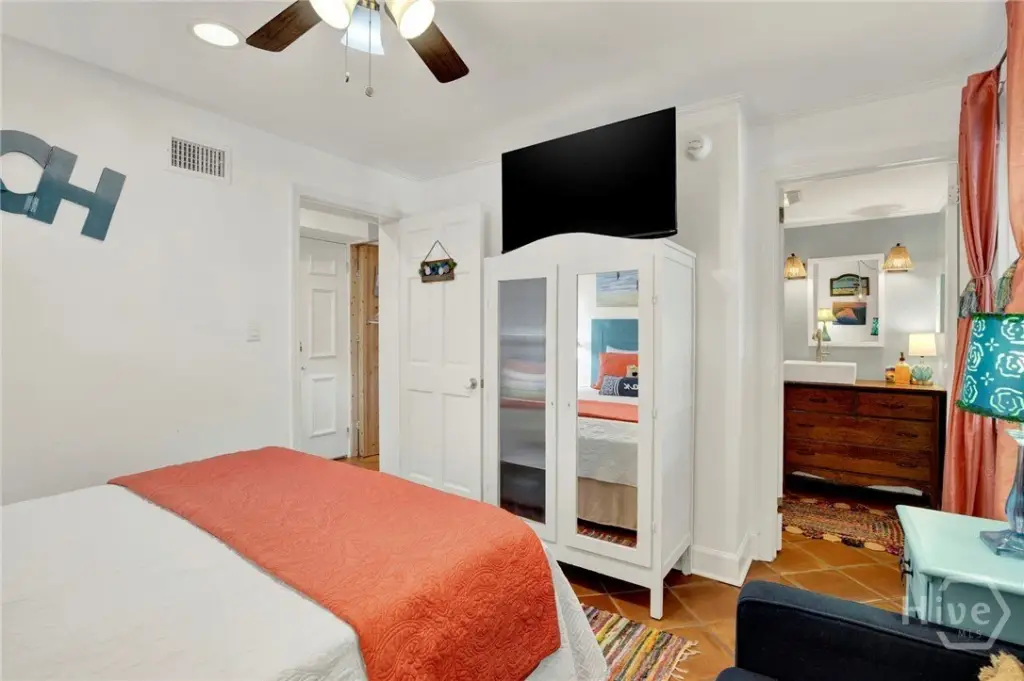
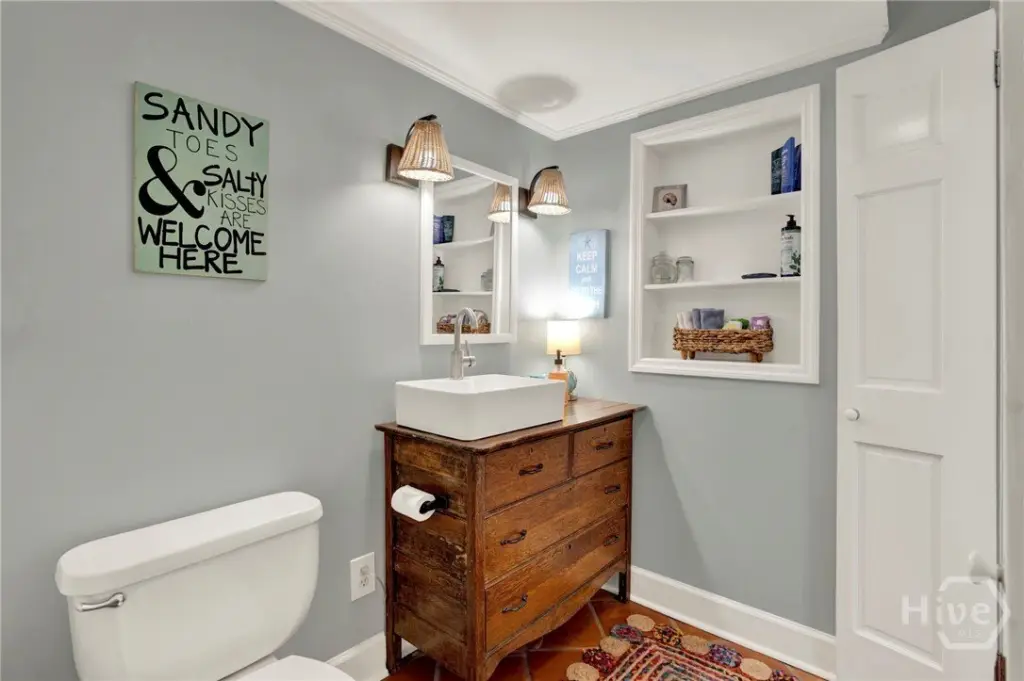
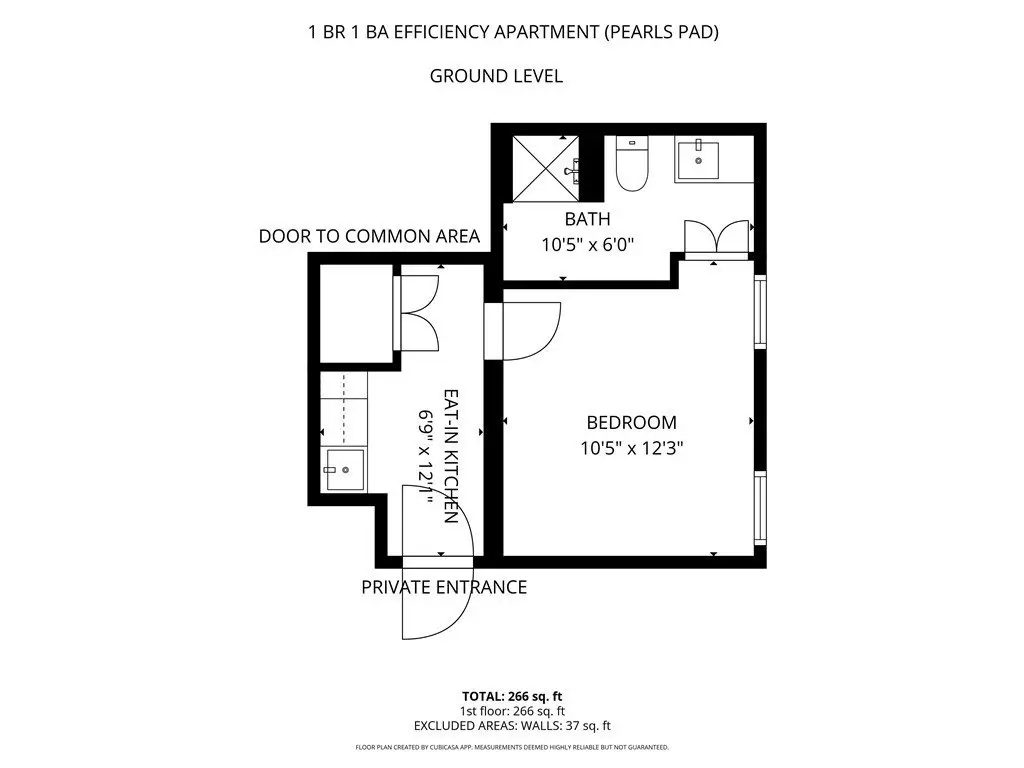
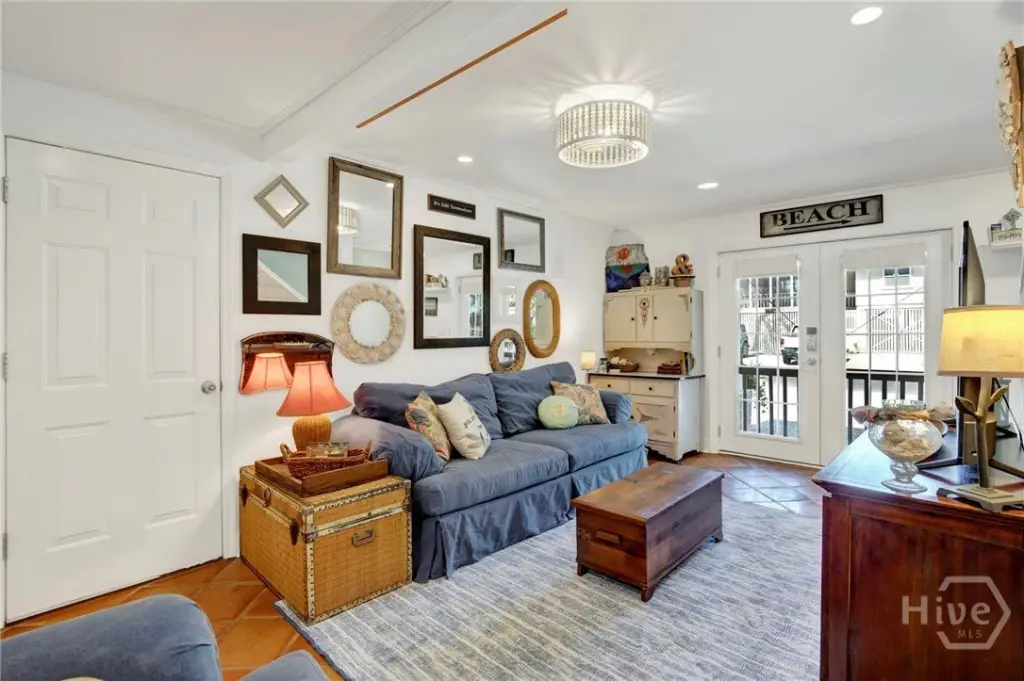
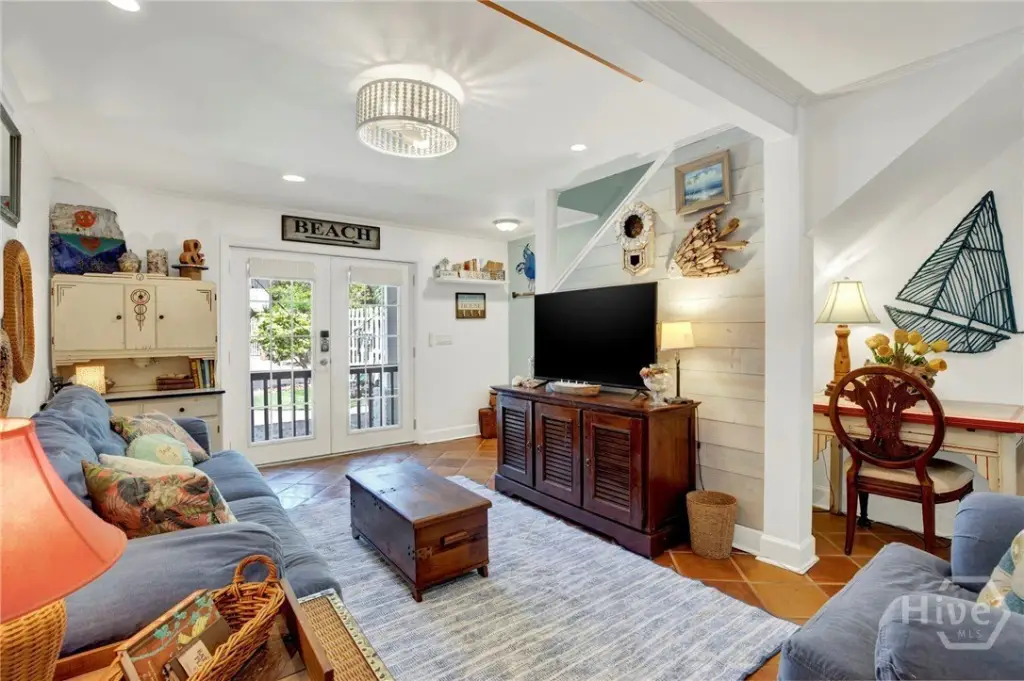
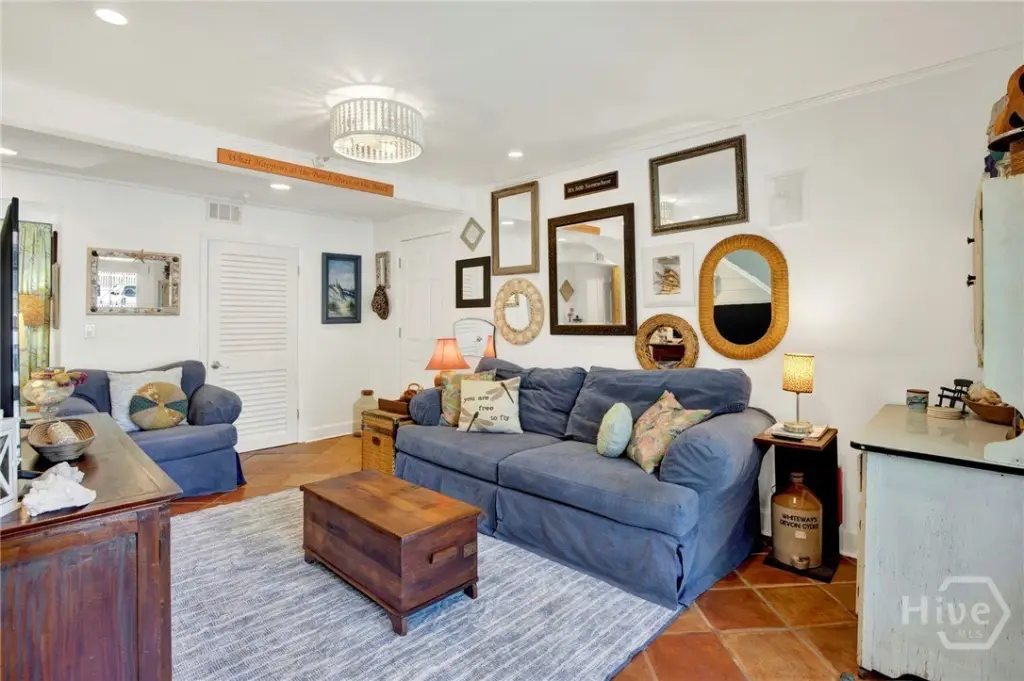
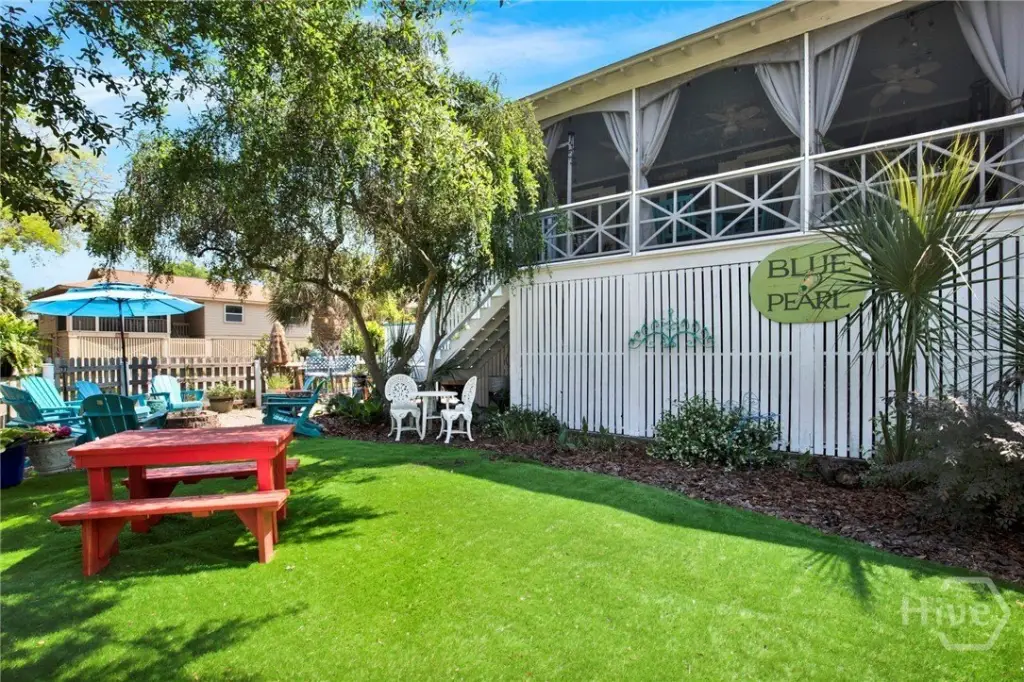
The lower level contains a two-bedroom, one-bath apartment with a full kitchen, washer, and dryer, along with a separate one-bedroom, one-bath efficiency. Each lower-level space has a private entrance, parking, and outdoor area. A shared downstairs entry and den also allow the three living areas to operate together as one six-bedroom home.
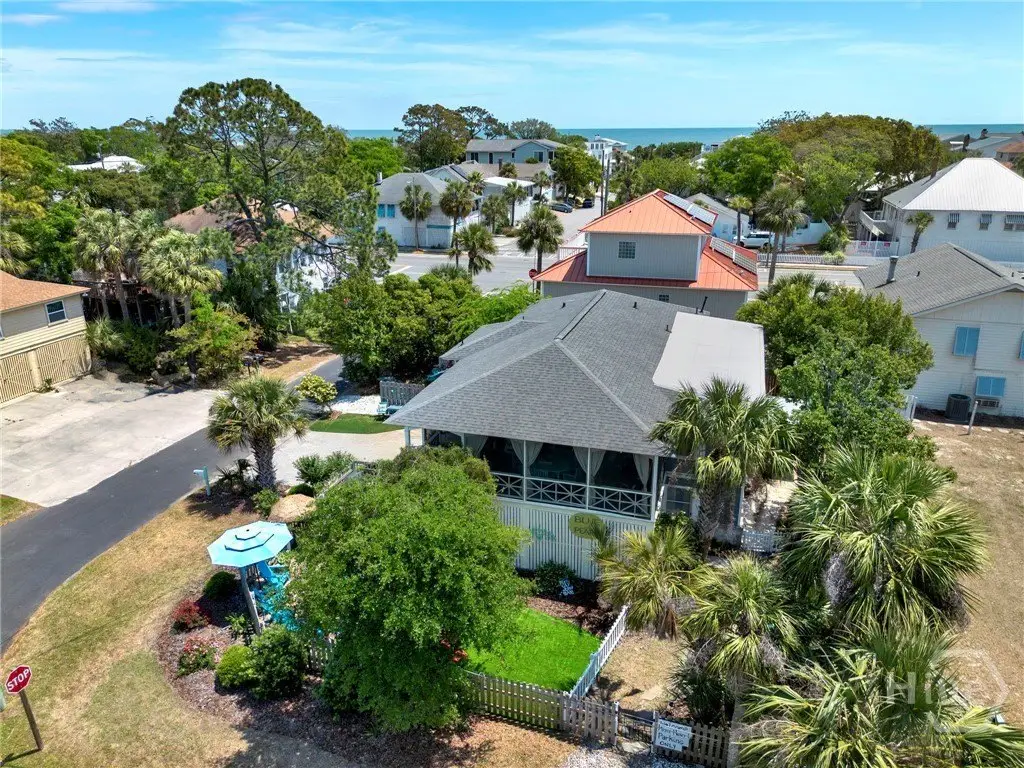
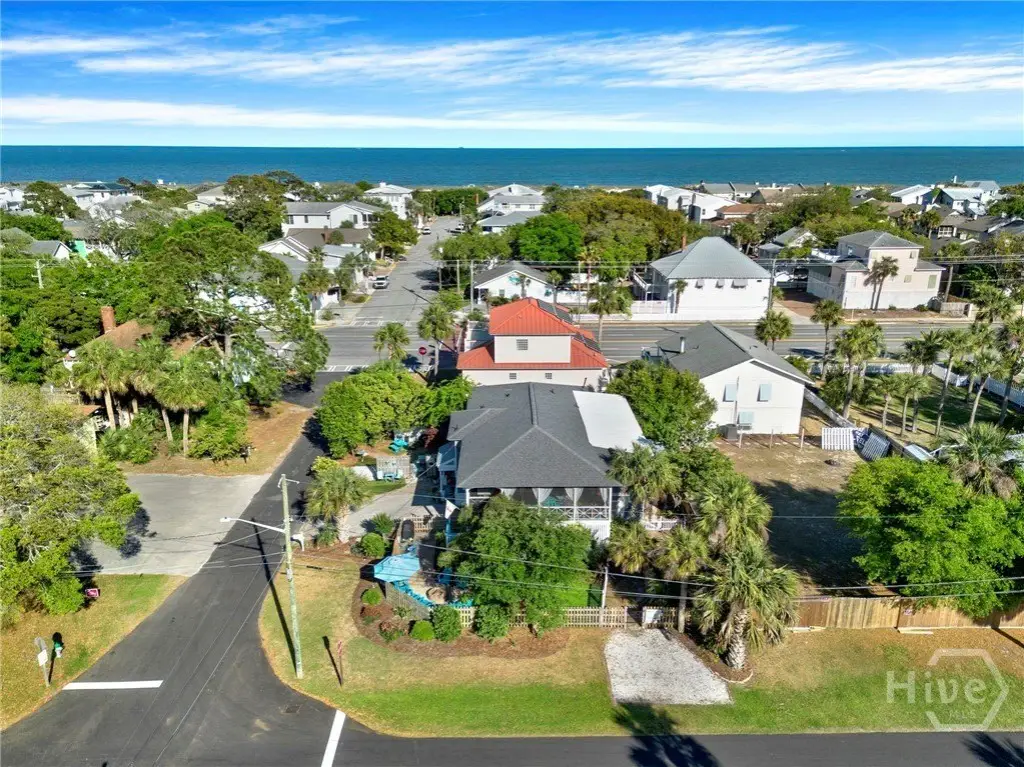
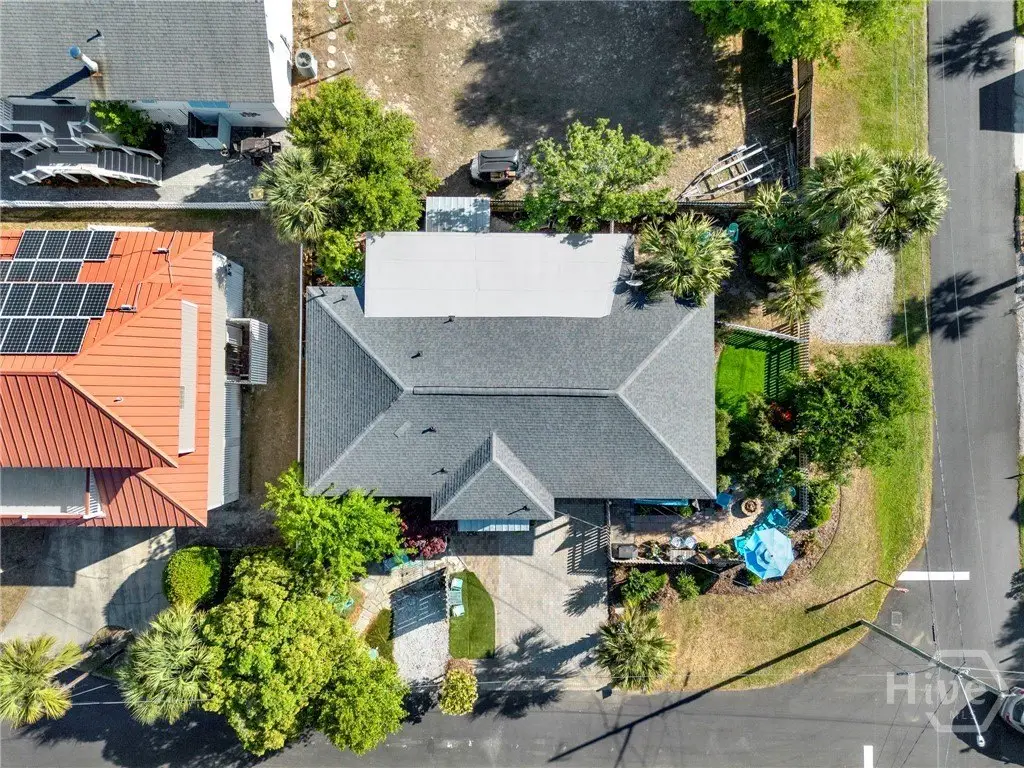
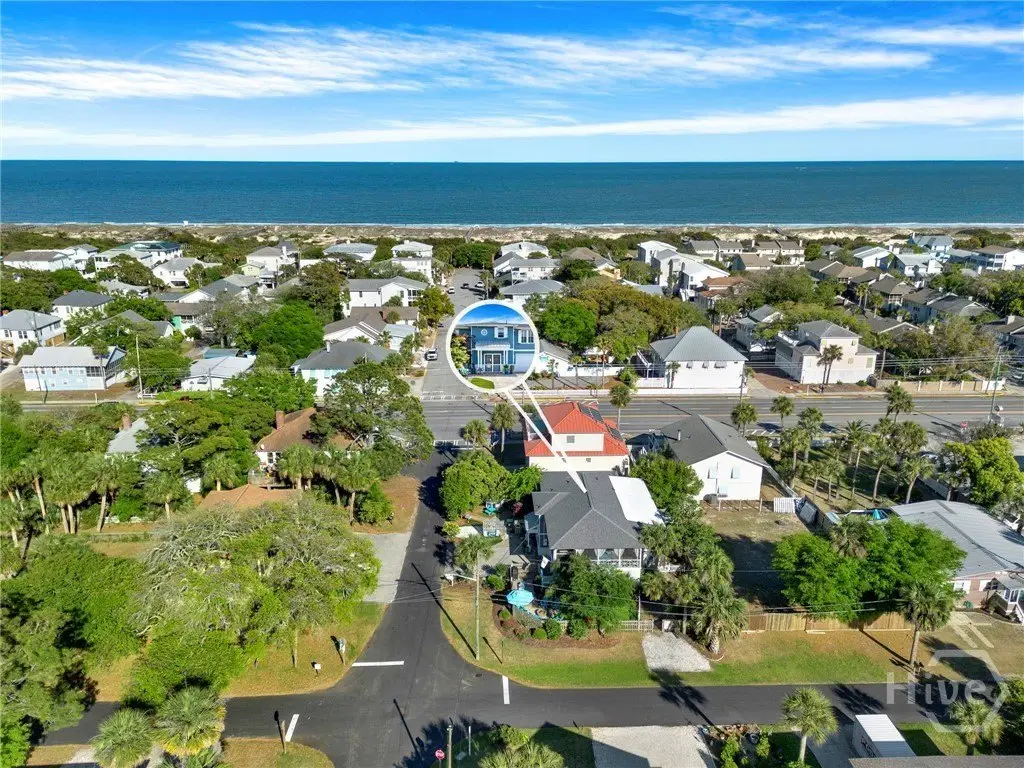
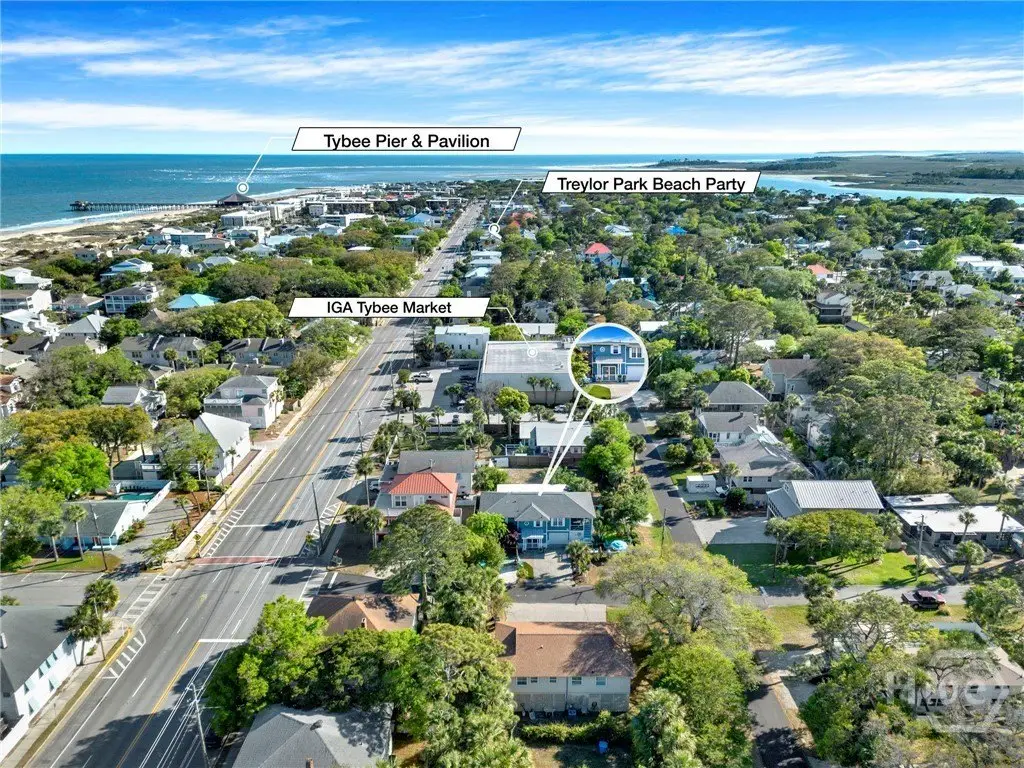
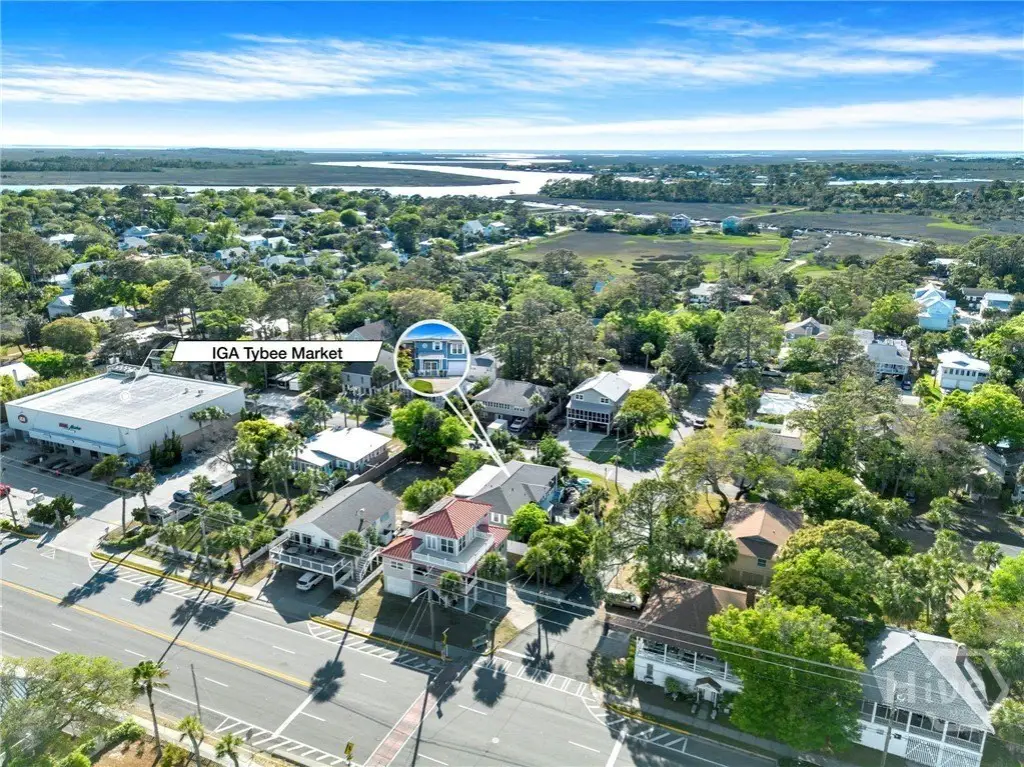
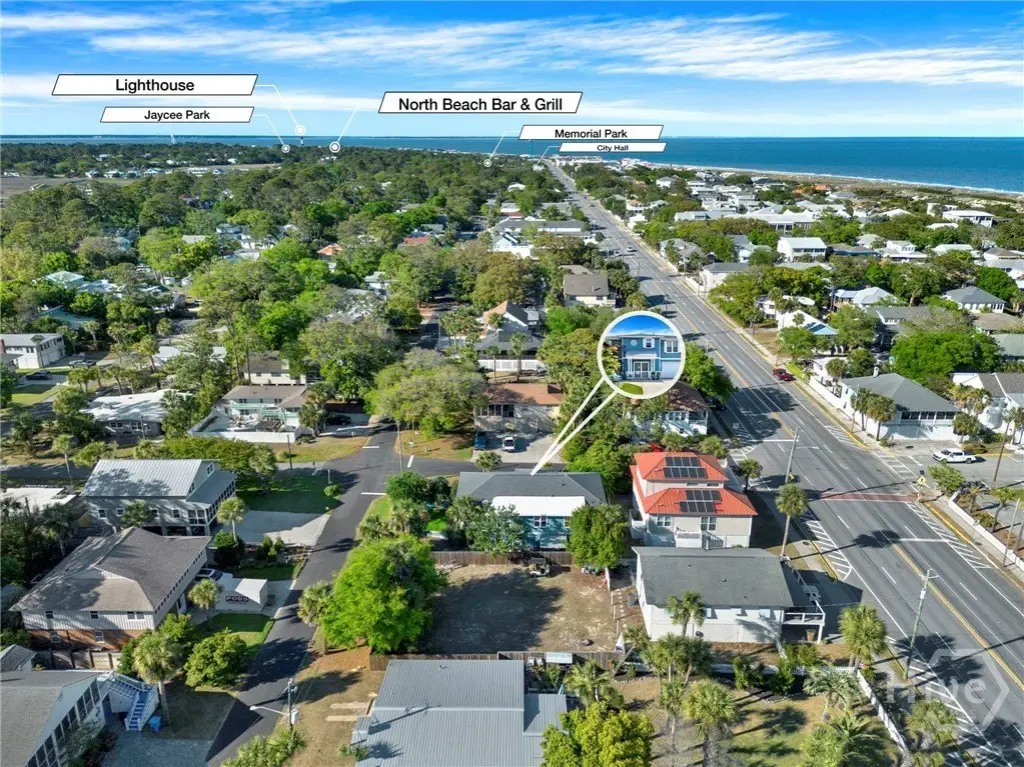
The property sits one block from the beach in a mid-island setting near dining, Memorial Park, and other Tybee Island attractions. Six off-street parking spaces and a one-car garage are included on the 0.11-acre lot.
The lower level contains a two-bedroom, one-bath apartment with a full kitchen, washer, and dryer, along with a separate one-bedroom, one-bath efficiency. Each lower-level space has a private entrance, parking, and outdoor area. A shared downstairs entry and den also allow the three living areas to operate together as one six-bedroom home.
The property sits one block from the beach in a mid-island setting near dining, Memorial Park, and other Tybee Island attractions. Six off-street parking spaces and a one-car garage are included on the 0.11-acre lot.
Key Highlights
- 3,258‑square‑foot triplex built in 1932
- Upper residence with 3 bedrooms, 3 bathrooms, and 3 living areas
- Lower level includes a 2‑bedroom apartment and a 1‑bedroom efficiency
Financial Insights
Estimated NOI and Cap Rate
NOI / Yr
$34,544
Cap Rate
3.01%
Suggested Prices Based on Cap Rates
Cap Rate 5%
$690,880
$690.9K
Cap Rate 7%
$493,486
$493.5K
Cap Rate 9%
$383,822
$383.8K
Market Conditions
NOI Build-Up for 3,258 SF
Gross rent
$52.8K $16.20/SF
− Vacancy
−$3.4K −$1.05/SF
EGI
$49.3K $15.15/SF
− OpEx
−$14.8K −$4.54/SF
NOI
$34.5K $10.60/SF
Area
Chatham County, GA
Vacancy
6.50%
Lease Rate
$16.20 /SF/Yr
Expense Ratio
30.00%
Simulate Cap Rate and NOI
Suggested Prices Based on Cap Rates
Cap Rate 5%
$690,880
Cap Rate 7%
$493,486
Cap Rate 9%
$383,822
Alternative Uses
Best Use
Multifamily LT 5
$493.5K
$431.8K – $575.7K
NOI $34,544 @ 7.0% cap · market cap 3.01%
Second Best
Apartment 5plus
$457.7K
$400.5K – $533.9K
NOI $32,036 @ 7.0% cap · market cap 2.79%
Theoretical Best
Warehouse
$3.04M
$2.66M – $3.55M
NOI $213,137 @ 7.0% cap · market cap 18.55%
Zoning and permitted uses should be independently verified with authorities.
Property Analytics
Unlock full access to Insights
Subscribe to Realmo Intelligence
Open Analytics
Current Use
Lease Details
3
Residential units
Location Intelligence
Trade Area within ½ mile
254
Businesses Nearby
Explore this area
Business Placement
Demographics for 31328, GA
3,430
Population
3,490
Households
1
Avg Household Size
60
Median Age
49%
College-Educated
97%
High-School Grad
9.2 sq mi
ZIP Area
373
Density / Sq Mi
$105,669
Median Household Income
$42,280
Median Earnings
$1,205
Median Rent
$615,200
Median Home Value
Check the figures for this property
Cap Rate, Value Estimation, Potential NOI and more
View Realmo Analytics
Market
Vacancy Rate% for Multifamily in South region

Questions? Ask Rey
Realmo’s AI knows this listing — price, zoning, demand, history. Ask anything.



Frequently Asked Questions
What type of property is this?
Triplex - Three separate living areas support a primary residence plus two private guest accommodations.
Where is this triplex located?
The property is located at 1102 Lovell Avenue Tybee Island, GA.
What is the asking price?
The asking price for this property is $1,149,000.
What are key features of this property?
This property features: 3,258‑square‑foot triplex built in 1932; Upper residence with 3 bedrooms, 3 bathrooms, and 3 living areas; Lower level includes a 2‑bedroom apartment and a 1‑bedroom efficiency



