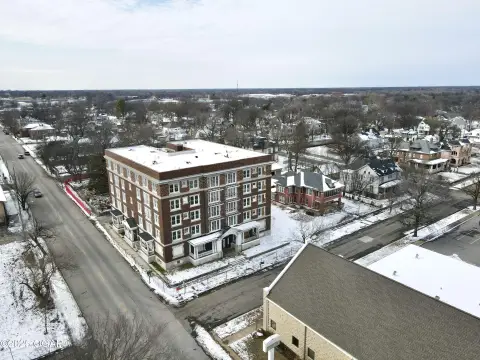
Lenexa, KS Hotels for Sale
Notify Me
List
Map
Osawatomie, KS
Paola, KS
Lane, KS
Rantoul, KS
Wellsville, KS
Louisburg, KS
Lacygne, KS
Edgerton, KS
- Osawatomie, KS
- Paola, KS
- Lane, KS
- Rantoul, KS
- Wellsville, KS
- Louisburg, KS
- Lacygne, KS
- Edgerton, KS
Turn Any Listing Into an Investment Snapshot
Owner equity, real caprate, demand score for every listing.
Go To Analytics Center


Opportunities in Nearby Cities


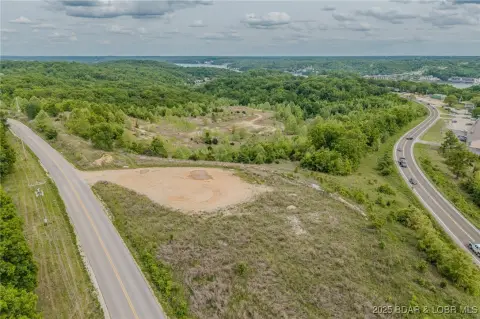
Potential Development Sites for Consideration


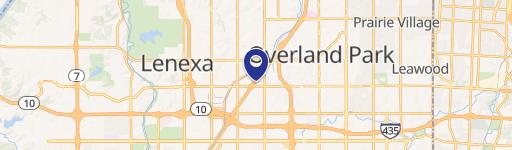
Off-Market Properties in Lenexa, KS


Lenexa, KS Hotels Market Trends and Statistics
Explore 15 hotels for sale in Lenexa, KS on our real estate platform. These investment opportunities span a total of 49,290 square feet of properties for sale, with an estimated market value of $0.00.
Sale prices for resorts in Lenexa, KS start at $0.00, averaging $0.00, and reaching up to $0.00 — offering options for a variety of budgets and business needs. Daily updated analytics ensure you stay ahead with the latest data and market trends.
List
Map
Top Commercial Asset Segments
Commercial property segments ranked by active listings on the market
Demographics Overview
Population
197K
Population Growth (5Y)
+7.1%
Median Household Income
$107,820
College Educated
55.9%
Taxes & Financing
Average Loan-to-Value
65.0%
Listings Trend
New vs delisted commercial listings in Johnson County
New
Delisted
Total CRE Inventory on Market (SF)
Average Property Price per SF
For-sale pricing trends across core commercial property types in Johnson County
Residential Income
Need Help?
Reach out if you need assistance with Realmo tools or have questions about your listings
