Internal Rate of Return (IRR): Definition, Calculator, Formula
A seasoned investor characterized it as “the most dangerous number in commercial real estate”-a 28% IRR masking a development project demanding additional capital, ultimately generating negative returns. This scenario demonstrates IRR’s paradoxical characteristics: sophisticated analytical capability combined with potentially deceptive limitations.
Comprehending IRR’s fundamental definition constitutes merely the initial stage; identifying its inherent constraints differentiates experienced investors from those pursuing metrics without proper context. This guide demonstrates leveraging IRR’s analytical strengths while circumventing common pitfalls.
What is the Internal Rate of Return (IRR)
The Internal Rate of Return (IRR) is a financial metric used to estimate the profitability of an investment by considering both the timing and size of expected cash flows. It represents the discount rate at which the net present value (NPV) of future cash flows equals zero. Unlike simpler return measures, IRR accounts for the time value of money, making it useful for comparing projects with different cash flow patterns. In real estate, a higher IRR generally indicates a more attractive investment, though it should be considered alongside other metrics for a complete analysis.
What are the Time Value of Money and the Discount Rate?
Core Financial Principles The Time Value of Money represents the concept that a dollar today is worth more than a dollar tomorrow because of its potential earning capacity. A discount rate is the interest rate used to determine the present value of future value cash flows.
Critical Foundation for Real Estate Analysis IRR and NPV are entirely built on this principle. Understanding TVM is non-negotiable for valuing any investment that produces cash flow over time, which forms the cornerstone of commercial real estate analysis and rate of return calculations.
Professional Application Strategy Don’t just pick a discount rate out of thin air. It should reflect the risk of the specific deal you’re evaluating.
A stable, long-term NNN lease with a credit tenant deserves a lower discount rate (less risk) than a value-add project with significant vacancy and renovation risk. Your discount rate represents your required return for accepting that particular risk profile.
What is Net Present Value (NPV)?
Definition and Core Calculation Net present value represents the difference between the present value of all future cash inflows and outflows, discounted at your required rate of return. It calculates the value of all future cash a project adds in today’s dollars.
Investment Decision Framework A positive NPV means the project exceeds your required return threshold. A negative NPV indicates it will not meet your investment criteria, providing a clear dollar amount of value created.
Strategic Wealth-Building Perspective IRR asks ‘what’s the rate of return?’, while NPV asks ‘how much money will I make in today’s dollars?’. The second question often proves more important for wealth building.
A $10,000 investment with a 50% IRR is nice, but a $1,000,000 investment with a 20% IRR builds substantial wealth. NPV captures this critical scale consideration; IRR does not.
How to Calculate Internal Rate of Return
The IRR Formula Explained
Mathematical Foundation and Core Structure The IRR formula sets NPV to zero and solves for the rate that makes the net present value equal zero: 0 = NPV = Σ CF_t/(1+IRR)^t. The initial investment appears as a negative cash flow at t=0, while subsequent cash flows from an investment represent positive inflows and any additional outflows.
Strategic Investment Analysis Applications While you will almost never calculate IRR manually, understanding the formula reveals that IRR is intrinsically linked to the timing and magnitude of every single cash flow. This includes the initial investment, ongoing cash inflows and outflows, and the final sale price, demonstrating how each element impacts your return calculation.
Value Creation Optimization Strategies Forget manual maththe formula’s real value lies in showing you the levers you can pull to optimize returns.
To increase IRR, you can: 1) Decrease the initial investment (buy cheaper), 2) Increase cash flows (raise rents, cut costs), 3) Receive cash flows sooner, or 4) Increase the exit value. The formula forces you to think strategically about the entire investment lifecycle.
How to Calculate IRR in Excel: A Step-by-Step Guide
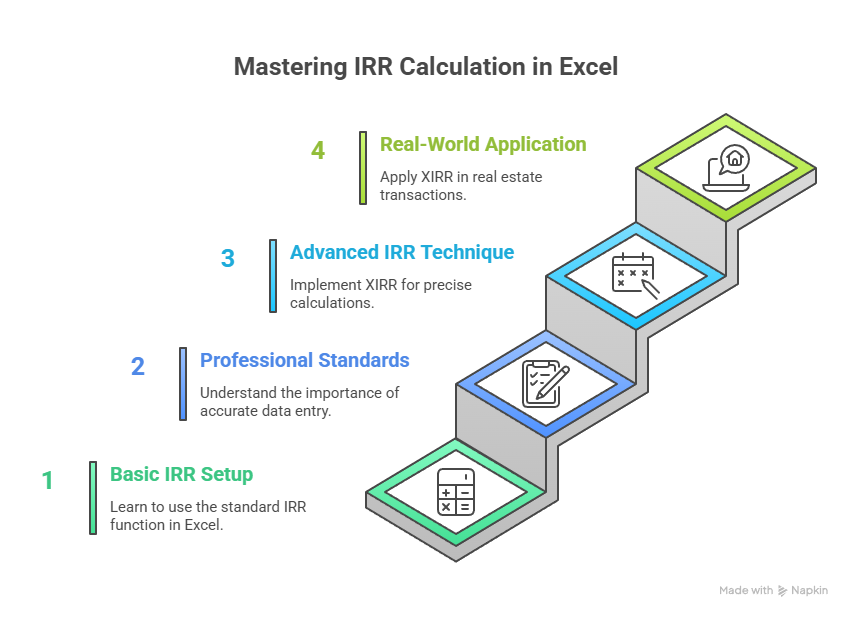
Excel Implementation and Setup Process Excel’s IRR function =IRR(values, [guess]) serves as the universal IRR calculator for this computation. You simply list your cash flows chronologically in a column, with the initial investment as a negative number, and use the IRR function to calculate IRR for the selected range.
Professional Standards and Common Errors This represents the practical, real-world method used by every analyst in commercial real estate. Mastering the setup in Excel is a fundamental skill for investment analysis. A common mistake is including blank cells or incorrectly entering the initial investment as a positive number.
Advanced Professional Implementation Technique Pro tip: Use the IRR function XIRR (=XIRR(values, dates, [guess])) instead of the standard IRR. The basic IRR function assumes all cash flows occur at perfectly periodic intervals.
Real estate transactions are rarely that clean. You might close mid-month and sell 5.5 years later. XIRR uses specific dates for each cash flow, delivering much more precise and realistic calculations. It’s the professional’s choice for accurate investment analysis.
Applying IRR to Real Estate Investment Decisions
What are the Hurdle Rate and Cost of Capital?
Core Investment Threshold Concepts A hurdle rate represents the minimum required rate of return an investor demands from an investment to justify the risk and opportunity cost. The cost of capital encompasses the expense an investor incurs to fund projects, typically reflecting a weighted blend of debt and equity financing costs.
Investment Decision Framework The decision rule operates with mathematical simplicity: If IRR is greater than the hurdle rate, the project or investment merits consideration. If IRR exceeds the hurdle rate, you proceed; otherwise, rejection follows. Your hurdle rate establishes the performance bar every investment must clear.
Dynamic Risk-Adjusted Approach Your hurdle rate should adapt dynamically based on specific risk profiles rather than remaining static across all opportunities.
A core property secured by a 20-year lease to Amazon presents minimal risk, justifying a hurdle rate of 8-10%. Conversely, an opportunistic redevelopment project carries substantial risk, demanding a hurdle rate exceeding 20%. The hurdle rate represents your required return compensation for accepting specific risk levelsnever surrender your risk premium without adequate compensation.
How to Use IRR to Compare Investment Opportunities
Investment Ranking and Selection Process When evaluating multiple investment opportunities, investors calculate IRR for each option to rank them by potential return performance. A highest internal rate of return generally indicates superior desirability, assuming comparable risk profiles and investment characteristics across alternatives.
Capital Allocation Decision Framework This represents IRR’s most prevalent application in commercial real estate. It facilitates optimal capital allocation to the most efficient opportunities by providing standardized metrics for comparing investment optionswhether evaluating a potential apartment acquisition against another similar investment like self-storage development.
Critical Analysis Warning Using IRR to evaluate projects can prove dangerously deceptive without proper context and additional analysis.
Short-term projects, such as one-year flips, typically generate higher IRRs than long-term holds, even when long-term projects create substantially more total profit. IRR demonstrates inherent bias toward speed over absolute value creation. Always ask: “Which project or investment delivers the highest internal rate of return?” followed immediately by: “But which project generates the most total value (NPV)?”
Advanced Analysis: The Pros and Cons of IRR
IRR vs. NPV
Central Capital Budgeting Debate The IRR vs NPV debate represents the cornerstone of sophisticated capital budgeting analysis. While IRR and NPV offer different perspectivesIRR provides a relative measure (rate of return) versus NPV’s absolute measure (net present value in today’s dollars)they can generate contradictory signals for mutually exclusive projects.
Understanding these limitations of IRR becomes crucial when choosing between competing investment opportunities where only one option can be selected.
Professional Investment Decision Framework NPV reigns supreme as the ultimate decision-making metric. The reasoning is fundamental: IRR isn’t designed to account for investment scale, creating potentially misleading comparisons.
Consider this scenario: Would you prefer a 100% high IRR on a $1 investment, or a 20% lower IRR on a $1 million investment? Net present value answers this question correctly by quantifying actual dollar value creation rather than percentage efficiency alone.
Use IRR as an effective screening tool and efficiency measure for real estate investments. However, rely on NPV as the final arbiter when making investment decisions. The fundamental goal of investing focuses on wealth creation, not achieving the highest percentage return without regard to absolute value generation.
The Reinvestment Rate Problem and Other Pitfalls
Fundamental Structural Limitations Beyond the NPV conflict, IRR suffers from two critical structural flaws that sophisticated investors must understand. The Reinvestment Rate Assumption represents IRR’s most significant weakness: the metric implicitly assumes all intermediate cash flows are reinvested at the same rate as the project’s IRR, often creating unrealistic expectations.
The Multiple IRR Problem compounds this issueprojects with unconventional cash flow patterns can produce multiple IRR solutions, rendering the metric mathematically meaningless for decision-making purposes.
The Hidden Reinvestment Rate Assumption The reinvestment assumption constitutes IRR’s most problematic characteristic for real estate investments. Keep in mind that IRR calculations assume every dollar of cash flow can be immediately reinvested at the same high return rate.
If your development project generates a 30% IRR, the formula assumes you can reinvest every cash flow dollar at 30% returns indefinitely. This assumption proves highly unrealistic in most market conditions, artificially inflating perceived investment performance.
Smart analysts combat this flaw using Modified Internal Rate of Return (MIRR). MIRR allows specification of realistic reinvestment rates (typically 6-8%), providing more conservative and achievable return projections. IRR could mislead investors who don’t recognize this fundamental assumption, making MIRR the preferred metric for sophisticated analysis when evaluating the pros and cons of IRR in investment decision-making.
Conclusion
Strategic Integration of IRR in Investment Analysis IRR represents an indispensable tool for rapid analysis, efficiency measurement, and preliminary screening to determine whether projects clear minimum return thresholds. However, sophisticated investors recognize that IRR should never operate in isolation, requiring complementary analysis through NPV calculations and comprehensive assumption validation.
Professional Decision-Making Framework The expert approach leverages IRR for initial screening while relying on NPV and thorough understanding of deal scale for final investment decisions. IRR reveals if you’re positioned in the right performance ballpark, but only NPV determines whether you’ll achieve victory in wealth creation. Master both metrics, and you’ll construct a championship-level commercial real estate portfolio.