Commercial Real Estate ROI Calculator: Analyze Cap Rate and Cash-on-Cash
The fastest way to overpay for a commercial property is to trust the headline numbers. Asking price, gross rent, and projected upside mean very little until you see how the deal performs after vacancy, operating expenses, debt service, and actual cash invested.
Use the ROI calculator below to analyze commercial real estate returns before you move deeper into the deal. It processes lease revenue, vacancy loss, operating expenses, debt service, cap rate, cash flow, cash-on-cash return, and other investment returns in one place. Enter your numbers below and get your results instantly. Then scroll down to understand exactly what they mean.
CRE ROI Calculator
Analyze cap rate, cash flow, DSCR, and cash-on-cash return
Net Operating Income (NOI)
Annual Cash Flow
What Did You Just Calculate? Understanding Your CRE Results
A commercial property investment calculator is useful only if you know how to read the outputs. Сhasing the highest-looking return on the screen isn’t the right approach. The goal is to understand what each number says about price, income quality, debt pressure, and risk.
A serious investor uses the calculator to test three things at once:
- Whether the property is priced correctly
- Whether the property generates enough cash
- Whether the deal can survive financing
That’s where cap rate, NOI, cash flow, DSCR, and cash-on-cash return start working together.
Capitalization rate (CAP): Is this commercial property priced right?
Your commercial cap rate tells you what the property yields before financing enters the picture. The cap rate calculation compares net operating income to purchase price, so it helps you evaluate the asset itself rather than the loan structure behind it.
A higher cap rate often points to a higher expected return, but it usually comes with more risk. A class C industrial property in a weaker submarket may show a higher cap rate than a stabilized class A office building with strong tenants and steady demand. The number is not good or bad by itself. It has to be compared against similar:
- Properties
- Asset class
- Tenant quality
- Lease structure
- Local market conditions
This is also how appraisers think about income-producing commercial real estate. They look at similar properties, current market value, and prevailing capitalization rates to estimate the value of the property.
If the calculator shows that the property value based on your required cap rate is far below the seller’s asking price, that is a pricing signal. It doesn’t automatically kill the deal, but it tells you the burden of proof has changed. The seller needs a strong reason for that price, like:
- Below-market rents
- Planned rent growth
- Strong redevelopment potential
- A real supply-demand imbalance in the submarket
Before-tax cash flow & NOI: Will this asset generate regular cash?
Net operating income, or NOI, shows the property’s income after operating expenses but before debt service. It answers a clean operating question: can the property itself produce income before the mortgage is added?
Annual cash flow goes one step further: it shows the actual cash the property generates after annual debt service. Many deals start to look less attractive at this point. A property may have solid NOI but still produce thin or negative cash flow if:
- The mortgage payment is too high
- The interest rate is too aggressive
- The down payment is too small
Positive cash flow means the asset can help fund itself and return income to the investor. Negative cash flow means the investor has to subsidize the property out of pocket. That may be acceptable in a value-add strategy, but it should never be accidental.
“Vacancy rate is one of the biggest swing factors in commercial real estate. In a retail plaza, office building, or small industrial property, one anchor tenant vacancy can turn a profitable annual cash flow result into a weak or negative one. Before you trust the result, stress-test it. Raise vacancy and collection loss by 10% in the calculator and see whether the property still holds up.” Gary Lubarsky, CEO of Realmo
Debt service coverage ratio (DSCR): Will a commercial lender fund this deal?
Debt service coverage ratio, or DSCR, measures whether the property’s net operating income can cover annual debt service. It’s one of the clearest lender-facing metrics in commercial real estate underwriting.
A DSCR below 1.0 means the commercial property cannot service its own debt from income. In plain terms, the building doesn’t generate enough NOI to pay the mortgage. Many conventional commercial lenders look for a minimum DSCR around 1.25x because they want a cushion between property income and loan payments.
Interest rate changes can compress DSCR fast. When financing costs rise, annual debt service rises too. The property may not change at all operationally, but the loan can suddenly make the deal harder to fund.
The calculator also lets you compare principal-and-interest payments with interest-only debt. Switching to interest-only can temporarily improve DSCR because annual debt service drops. It doesn’t mean the deal has become safer. It only changes the timing of the debt burden.
Use this option carefully, especially if the exit depends on refinancing or aggressive NOI growth.
Cash-on-cash return & multipliers: Measuring deployed capital yield
Cash-on-cash return measures the annual cash flow produced by the actual cash invested. It means the denominator should include the down payment and closing costs, not just the purchase price.
Notice how cash-on-cash return differs from cap rate:
- Cap rate ignores leverage
- Cash-on-cash reacts to it
A lower down payment can increase cash-on-cash return if debt is cheap and cash flow stays strong. But if the interest rate is high or the loan terms are tight, the same leverage can crush annual cash flow and drag the return down.
Closing costs are important here. If you leave them out, the calculator will overstate your return on investment because it will treat your cash invested as smaller than it really is.
Gross Rent Multiplier and Net Income Multiplier are faster benchmarking tools. GRM compares purchase price to rental income. NIM compares purchase price to net income. They don’t replace full underwriting, but they help you compare similar properties in the same submarket quickly. If one asset’s multiplier looks far outside the local range, that’s a signal to investigate:
- The rent roll
- Expense load
- Seller pricing
The Commercial Inputs That Drive Your Results: What to Get Right
A calculator can only be as accurate as the numbers you enter. In CRE, small input errors can create large output distortions because income, vacancy, expenses, and debt all compound through the model.
The fastest way to misuse an ROI calculator is to enter optimistic revenue, rounded expenses, and incomplete financing costs. And the best way to make it useful is to treat every input like an underwriting assumption that needs evidence.
Auditing the rent roll: GSI, other income, and NNN vs. gross expenses
Gross Scheduled Income should come from the actual rent roll, not from a best-case projection. Use:
- Signed leases
- Current rent amounts
- Lease expiration dates
- Escalation clauses
- Tenant payment history where available
Rental income minus operating expenses is what ultimately drives NOI, so the rent roll is the foundation of the calculation.
Other income should be entered separately when it matters. Parking fees, signage income, cell tower leases, storage, laundry, and CAM reimbursements can all affect gross operating income. In some properties, these are minor, but in others, they change the annual cash flow quite a lot.
Lease structure is just as big a factor as income:
- Under a triple net lease, tenants may cover property taxes, insurance, and common area maintenance, reducing the landlord’s direct operating expenses
- Under a modified gross lease, the owner may carry more of those costs
If you enter NNN and gross lease expenses the same way, the calculator output will be wrong.
This is why thorough due diligence is non-negotiable. Verify property taxes, insurance, property management, maintenance and repair costs, utilities, janitorial, security, reserves, and any recurring service contracts. If a property management company is involved, review actual management fees rather than assuming a generic percentage.
Debt and acquisition inputs: Leverage, LTV, and commercial loan terms
The financing section can change the deal as much as the property itself. Interest rate, loan term, payment type, and loan-to-value ratio all affect annual debt service, DSCR, and cash-on-cash return.
LTV defines how much debt sits on the deal and how large the down payment needs to be:
- A higher LTV can reduce upfront cash invested, but it can also increase the mortgage payment and put pressure on cash flow
- A lower LTV may reduce leverage risk but require more capital upfront
Don’t skip closing costs. They’re part of the cash invested, so they belong in the calculator. If you forget them, the cash-on-cash return will look cleaner than reality. Acquisition fees, lender fees, legal costs, title, inspections, and other closing costs may not affect NOI, but they absolutely affect the investor’s actual rate of return.
Beyond Single-Year Ratios: Advanced Metrics for Serious CRE Investors
Cap rate and cash-on-cash return are useful first-year measures, but they don’t tell the whole story. This is especially true for:
- Value-add commercial deals
- Repositioning strategies
- Assets with temporary vacancy
A property may look weak today because vacancy is high, tenant rollover is near, or operating expenses are inflated. If the investment strategy includes lease-up, renovation, better management, or new tenant demand, the real question is not only what the asset produces now. It is what the asset can produce over a five-to-10-year holding period.
Discounted cash flow becomes important here. DCF accounts for the time value of money by modeling future income, expenses, capital events, and exit value. Internal rate of return, or IRR, then helps investors compare the real estate investment against other opportunities in a portfolio.
Use the ROI calculator as the first filter. For complex syndications, redevelopment deals, or institutional real estate investing, follow it with a multi-year model that tests:
- Rent growth
- Vacancy absorption
- Capital expenditures
- Refinance risk
- Exit cap rate
When the Calculator Isn’t Enough: Commercial Valuation Boundaries
A calculator can expose weak math quickly, but it can’t see everything. Static formulas struggle with specialized commercial real property where there are few similar properties for comparison.
Data centers, cold storage, life sciences facilities, adaptive reuse projects, and highly specific industrial assets may not have clean comps in the current market. In those cases, valuation depends on:
- Deeper market research
- Appraiser judgment
- Replacement cost
- Tenant demand
- Buyer appetite
Calculators can’t fully judge qualitative risk either. Property values can be affected by:
- Tenant creditworthiness
- Lease expiration schedules
- Deferred maintenance
- Zoning constraints
- Local supply and demand
- Management quality
An anchor tenant with weak credit may make the income stream less reliable even if the current NOI looks strong.
So treat the calculator as a required filter, not a final verdict. It helps you eliminate bad deals, compare commercial properties, and pressure-test the value of the property. But thorough due diligence, market context, and hands-on management still determine the eventual gain or loss.
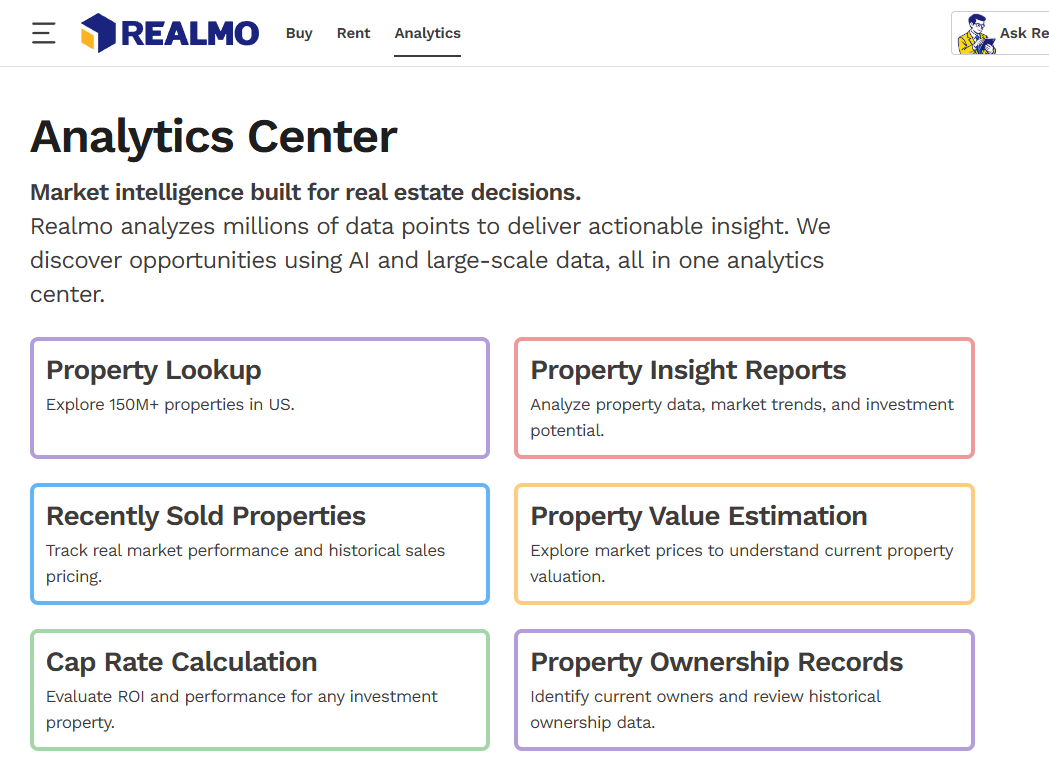
After the calculator gives you the first-pass numbers, you can use Realmo to check whether the deal still makes sense in context. Review the property’s location, surrounding market, current listing environment, ownership signals, and valuation inputs inside the Analytics Center. Then ask Rey, an AI-powered CRE assistant, to find similar commercial properties, compare nearby opportunities, or monitor new listings that match your target cap rate, budget, asset type, and location.
Conclusion
Commercial real estate investment returns require more than one clean-looking ratio. Cap rate, NOI, DSCR, cash flow, and cash-on-cash return each show a different part of the deal. Together, they help you understand price, income, debt pressure, and the property’s value before you commit more time or capital.
Use the ROI calculator as the first digital filter. Before you schedule tours, negotiate terms, or expand your portfolio, run the complete numbers. Good real estate investing starts with a strict habit: calculate first, visit second, invest only when the math can defend the decision.