
New search
Property profile & analytics
FOR SALE
Commercial real estate
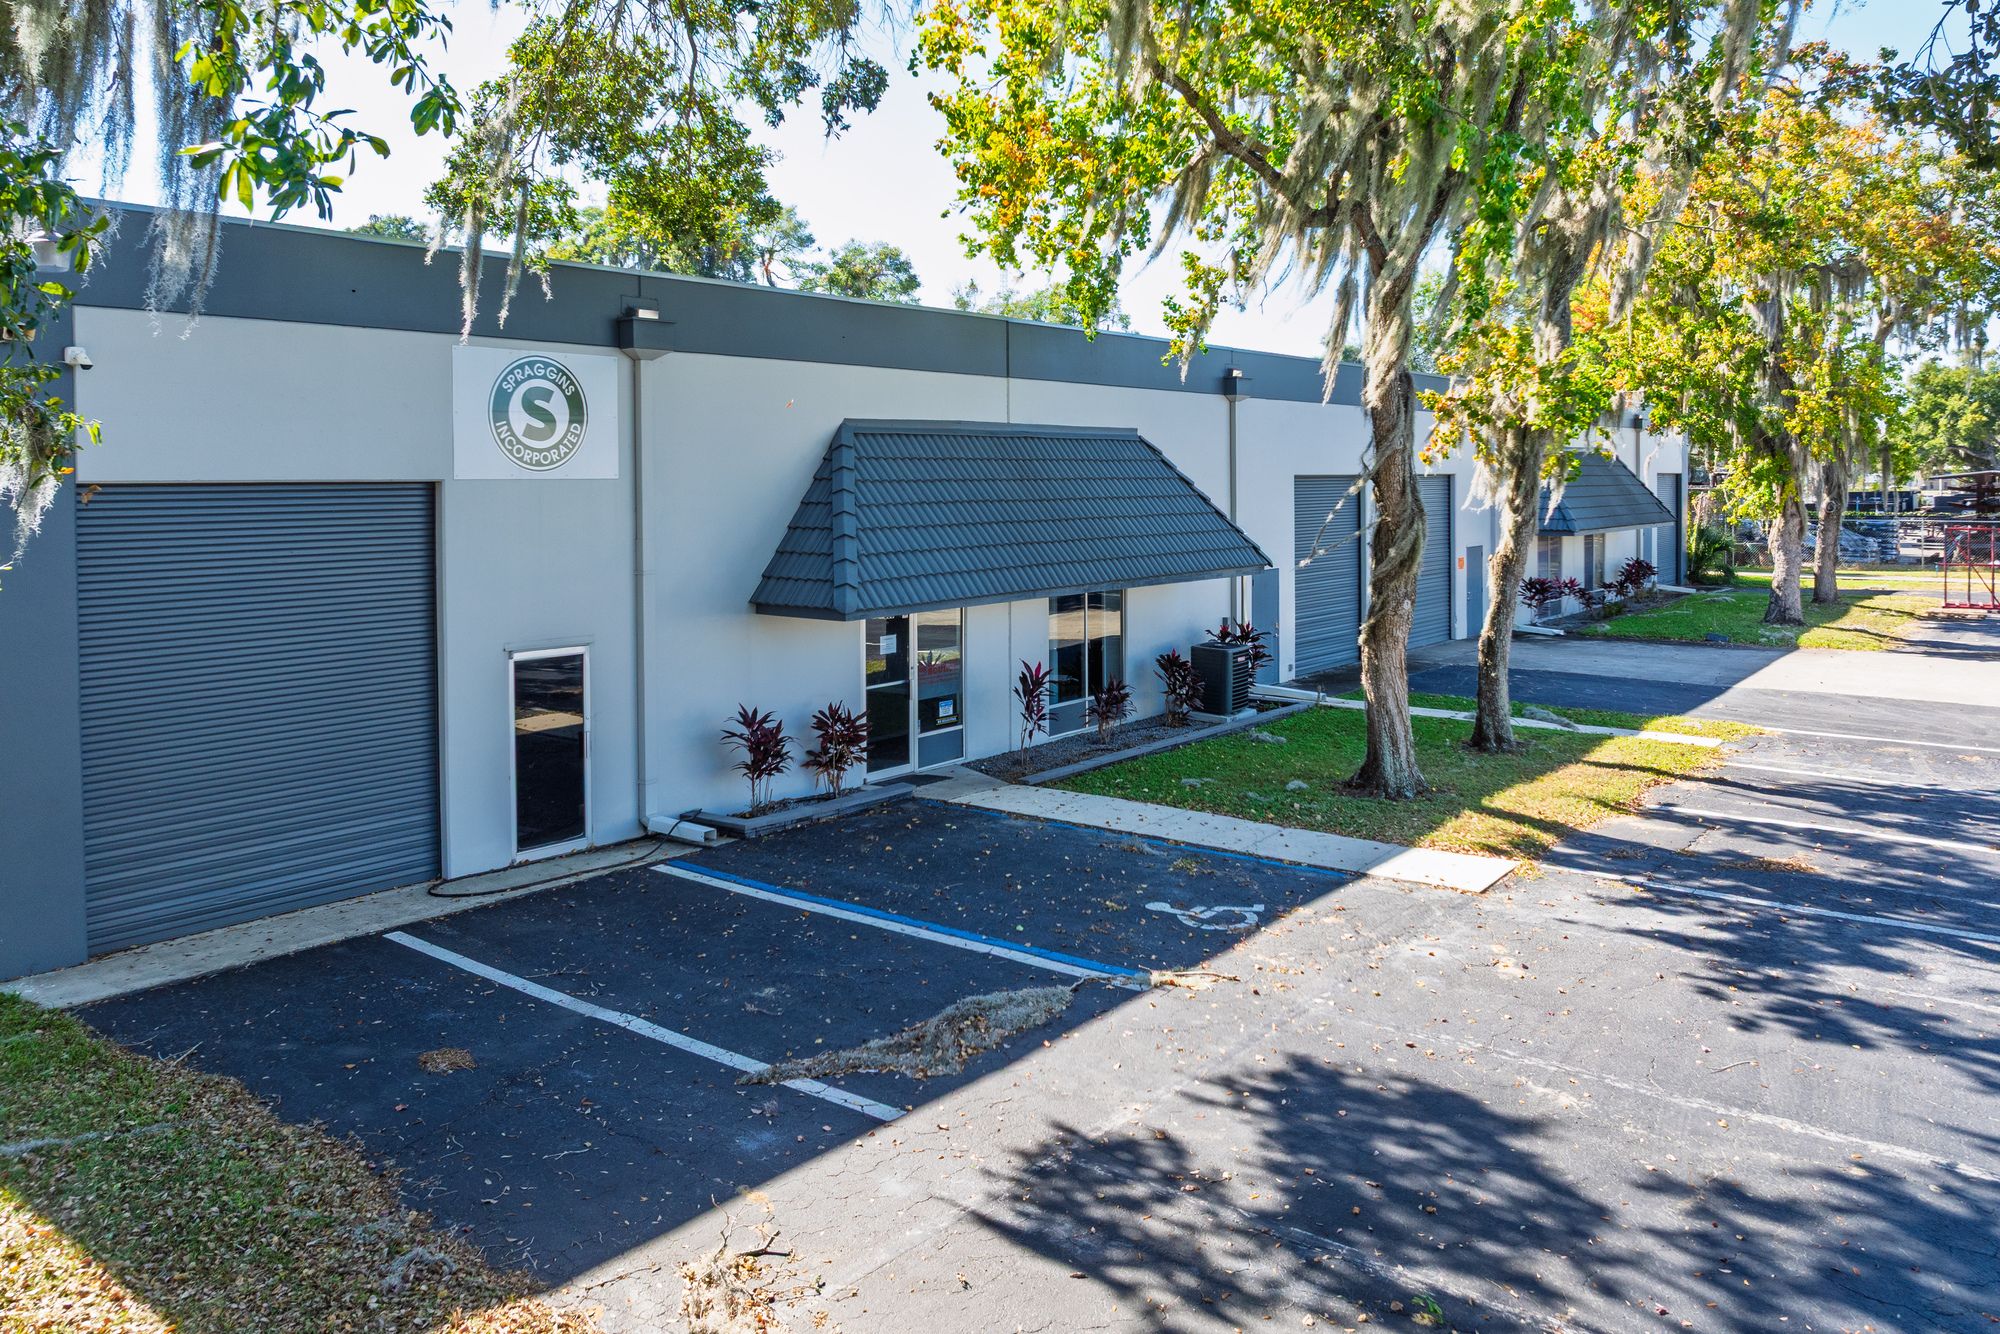
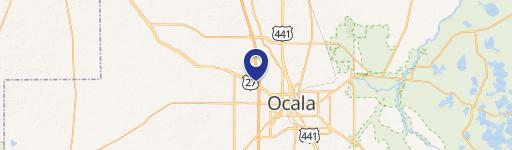
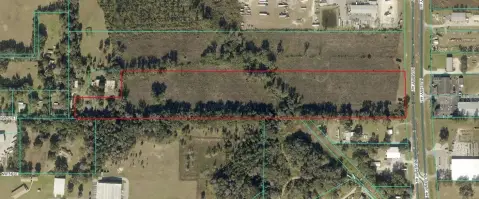
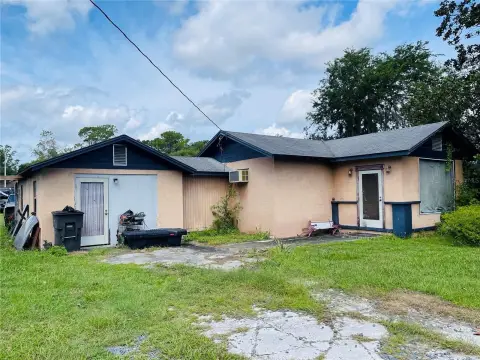
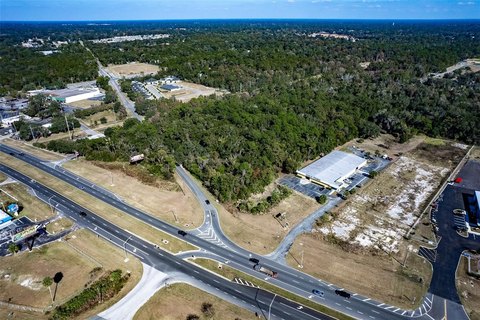
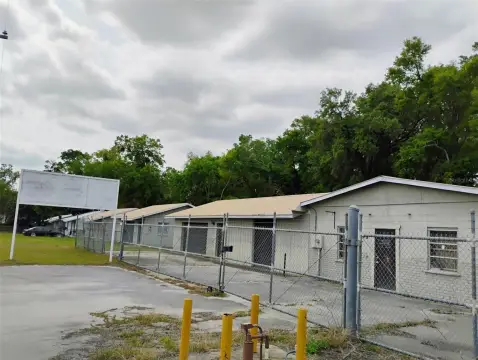
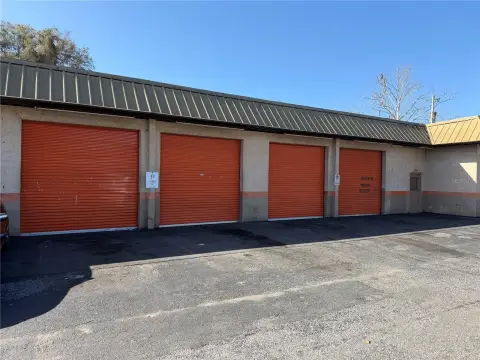
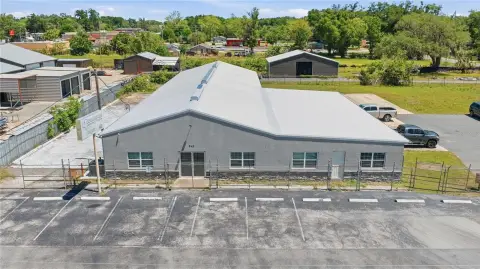
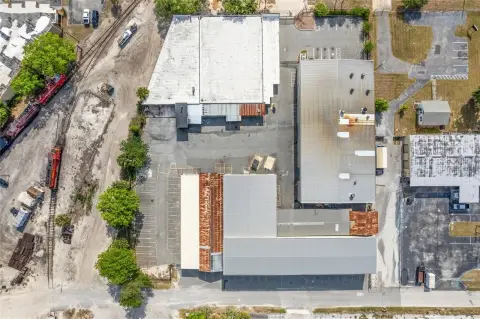
830 NW 25Th Ave, Ocala, FL 32808
Entity Owned
2-yr Hold
~
Est. High Equity
Property ID
US18-4763062
 For Sale
1 / 5
For Sale
1 / 5
$2,400,000
830 NW 25Th Ave, Ocala, FL 32808
View Listing →
Property profile
Verified
Property type
Commercial real estate
Use group
COMMERCIAL (GENERAL)
Year built
1985
Construction
MASONRY/CONCRETE MASONRY UNITS (CMUS)
Total area
16,000 SF
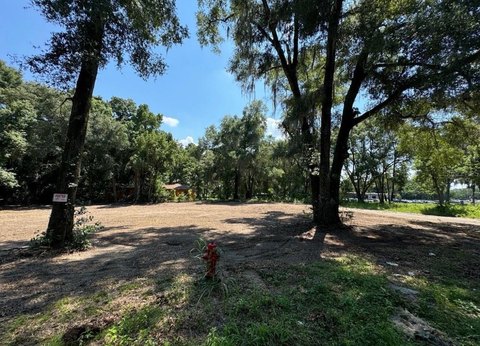
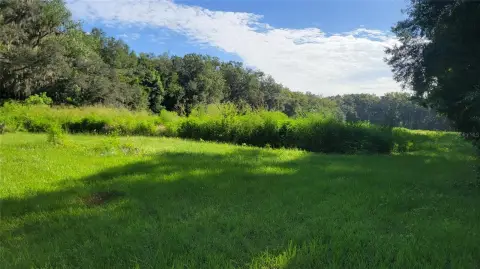
Lot
0.98 ac (42,689 SF)
Zoning code
M1
APN
2239-003-004
UPID
US18-4763062
Cap rate & NOI
Priority signal for investors
Implied cap rate, NOI & suggested price
Cap rate vs submarket · NOI estimate · 3 price anchors
Implied cap rate, NOI & suggested price
Cap vs submarket · NOI estimate · 3 price anchors
Value estimations
Realmo proprietary · 4 methods
AI Approach
AI
$1.20M
CAP Approach
CAP
by Request
Comparable Approach
Comparable
$905k
Blend (final)
Blend
$1.25M
Owner & transaction history
Nw 25th 830 LLC · 2 yrs held
Nw 25th 830 LLC
since 2023
Last sale
$1.5M
5 recorded transactions
Zoning & alternative use
M1 · Ocala, FL
Permitted uses
Permitted uses
Allowed · conditional · prohibited
Cap rate
Implied · in-place · derived from last sale + estimated NOI
Implied Cap rate
#1
Implied · in-place · NOI ÷ last sale
In-place · derived from last sale + estimated NOI
Cap rate, NOI & submarket benchmark
Implied cap rate vs Ocala submarket · NOI estimate · Typical band, median & reading
Implied cap rate, NOI & submarket benchmark
Cap vs Ocala submarket · NOI estimate · typical band, median & reading
Refine your cap rate
8-question underwriting flow
1.
Property current status — Going-In vs Stabilized
2.
Price for denominator — asking / offer / market
3.
Leasing status & lease structure (NNN / Gross)
4.
Tenant risk profile & vacancy assumption
5.
Upload T12 / rent roll / OM (optional)
Refine in 60 seconds, get exact suggested price
T12 upload · Submarket benchmarks · Sensitivity grid
Suggested price · 3 cap rate anchors
Income approach @ 5% / 7% / 9% — aggressive / typical / conservative
Suggested price at 5% / 7% / 9% cap
Aggressive / typical / conservative · Implied $/SF per anchor · Sensitivity grid
Suggested price at 5% / 7% / 9% cap
Aggressive / typical / conservative · implied $/SF · sensitivity
Value
AI, CAP & Alternative Use estimations · Realmo proprietary blendValue Estimations
Based on Realmo’s proprietary methodology
AI Approach
Method
Estimation
Statistic approach
$1,150,000
ML approach
$1,200,000
CAP Approach
CAP Return
Estimation
6%
by Request
6.5%
by Request
7%
by Request
Blend value · Realmo final
$1.25M
Range $1.13M – $1.38M · ±10% · vs last sale $1.50M (Nov 1 2023)
Last sale anchor
$1.50M
Nov 1 2023
Realmo estimate · informational only.
These numbers are calculated by our models from public records and may not reflect actual market value.
Not an appraisal.
Verify with a licensed appraiser before transacting. Realmo accepts no liability for divergence from real-world outcomes.
View the full estimation — every method, every assumption
Confidence drivers & risk notes · Custom comparable set · Free for first 3 / day
Full estimation methodology
Every method · every assumption · confidence drivers
Price per SF
Sale + rent benchmarks
Subject property
$78 / SF
Submarket sale & rent benchmarks
Median sale $/SF · Asking & closed rent · Submarket vacancy
Submarket sale & rent benchmarks
Median sale $/SF · asking & closed rent · submarket vacancy
Property tax & assessments
Tax year 2023Property tax & assessments
Tax year 2023
Tax billed
$11,773
Tax year 2023
Assessed value
$489,005
Assessed 2023
Previous assessed
$479,658
+1.9% YoY
Effective rate
2.41%
On assessed value
Assessed land
$61,899
Assessed improvement
$427,106
Land market value
$61,899
Improvement market value
$591,359
Total market value
$653,258
Applied tax rate
1,001.0000
Comparables
6 recent transactions · within 1.5 miComparable in this city
6 recent transactions
Comparable in this City


Similar Nearby for Sale
Similar Nearby for Lease


Recent comparable sales
Sale price & price/SF · Sale date & distance · Adjustments & confidence
Recent comparable sales
Sale price & $/SF · sale date & distance · adjustments
Property description
Physical attributes from public recordsBuilding & lot
Public records
Property type
Commercial real estate
Use group
COMMERCIAL (GENERAL)
Status
For Sale
Year built
1985
Construction
MASONRY/CONCRETE MASONRY UNITS (CMUS)
Heating
NONE
Cooling
YES
Stories
1
Bathrooms
2
Total area
16,000 SF
Lot
0.98 ac (42,689 SF)
Zoning code
M1
APN
2239-003-004
UPID
US18-4763062
Jurisdiction
MARION
Zoning & alternative use
M1 · Ocala, FL
Zoning M1 · permitted uses
M1 · Ocala, FL
Permitted & conditional uses
Allowed uses · Special-permit conditions · Prohibited uses
Permitted & conditional uses
Allowed · special-permit conditions · prohibited
Ocala. Always verify with local authorities before improvements.
Building & site characteristics
From public records
Year built
1985
Construction
MASONRY/CONCRETE MASONRY UNITS (CMUS)
Heating
NONE
Cooling
Yes
Stories
1
Bathrooms
2
Lot
0.98 ac
Current owner
From public records · entity-resolved
Nw 25th 830 LLC
Entity
Mailing address
3001 MERCY DR, ORLANDO, FL 32808-3113
Ownership since
2023
Owner contacts — direct phone, email, and related entities
Decision-maker phone · Verified email · Related entities & filings
Owner contacts
Email · phone · related entities
Sales History
5 recorded events · public records
Date
Price
Buyer
Seller
Deed Type
Mortgage
Nov 1, 2023
$1,500,000
Nw 25th 830 LLC
Kp Direct LLC
Warranty Deed
$750,000 · One Florida Bank
Aug 19, 2016
—
Kp Direct LLC
Galloway,mary C
Warranty Deed
$394,600 · Bank Of America
Aug 19, 2016
$420,000
Kp Direct LLC
Canaan Ranch LLP
Warranty Deed
—
May 9, 1995
$250,000
Galloway,mary C Trust Etal
Bryan Industrial Properties Ea
Grant Deed
related
$100,000 · Barnett Bk/marion Cnty
—
—
Galloway,mary C|robinson,marguerite Trust Etal
—
Deed Of Trust
related
$55,000 · Community Bk&tr/fl
Coming soon
Costs & Benchmarks
Operating expenses, capex projections, utility benchmarks, and submarket comparables — all in one view.
Coming soon
Risks
Flood, climate, environmental, title, and tenant-concentration risk — surfaced with mitigations and source citations.
Try Rey
Ask anything about this address in plain English.
“Is 15.6% cap rate sustainable?” · “Best tenant mix for BU1?” · “What’s the redev upside?”
Full reports are paid
Unlock the full Property Analytics report
Start free for 7 days — no card required. Full owner contacts, all 4 valuations with methodology, refine flow, comparable adjustments, foot-traffic deep dive, export to PDF / CSV.


