Entity Owned
Property summary
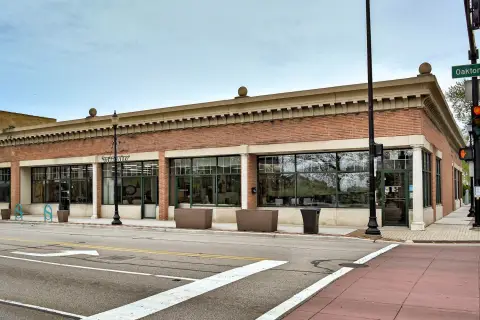
This exceptional investment opportunity presents a fully leased, four-unit retail building situated in the heart of downtown Skokie, Illinois. The property, located at 8046 N Lincoln Avenue, boasts a total of 6,326 square feet and sits on a prime corner lot, ensuring maximum visibility and accessibility. Currently enjoying 100% occupancy, the building features strong, reliable tenants, providing a consistent stream of income and minimizing management demands. Each of the four units is… designed to attract and retain high-quality tenants, offering versatility for a diverse range of retail businesses. The vibrant and bustling location in downtown Skokie guarantees high foot traffic, ensuring consistent customer flow for tenants. This translates to a stable and lucrative investment, ideal for both seasoned investors seeking to expand their portfolio and those new to commercial real estate looking for a low-management, high-return property. The solid brick construction ensures durability and longevity, further enhancing the value of this exceptional investment opportunity. The asking price for this prime retail property is $1,000,000. This represents a compelling opportunity to acquire a well-established, income-producing asset in a thriving downtown location.
Ownership intelligence
Owner of record from public deeds, plus portfolio, hold profile and investor signals where the data supports them. Included with a plan.
Owner contacts
Skip-traced phones and e-mails of the owner. Included with a plan.
Debts
Recorded lenders, amounts and estimated maturities of the owner's loan book — included with a plan.
Property tax · 2022
Value estimate
· Nov 2026Realmo valuation models over county records.
Recently sold
Cap rate analysis
No income signal is modeled for this parcel yet — the Cap Rates tab runs the workflow.
Zoning insight
No data for this sectionNo zoning code is on file for this parcel. Coverage grows with every catalog release.
Location intelligence
Demand index: how under-served this business type is around this point — modeled from the LocInt grid (area demand vs. what already operates, adjusted by real visit traffic). Higher means stronger unmet demand.
Location
Every figure names its source: public record, benchmark, or modeled. Coverage varies by property — thin data is stated as missing, never invented.
Comparables
6 recorded sales · 15 properties nearbyComparable nearby


Similar Nearby for Sale


Similar Nearby for Lease


Instant AI valuation built from comps, income signals, and proprietary benchmarks.A defensible range, not a single guess.
from $199/month
- Lot area
- 0.15 ac
- Year built
- 1954
- Stories
- 1
- APN
- 10-21-413-019
- Assessed value · 2022
- $128,671
- Annual tax · 2022
- $40,110
Cap rate calculated from real income and expense signals, benchmarked against sales of similar assets nearby.
from $199/month
Price sensitivity
The rate is the decision lever; valuation is the consequence.
The recorded zoning designation, what the district officially allows, and the municipal source it comes from.
No zoning code is on file for this parcel. Zoning coverage grows with every catalog release — check back, or open Location Intelligence for use analysis of this corner.
Unlock the evidence behind ownership: portfolio, transactions, debt and any signals we can model, to help you decide who to contact next.
Registration is required before any owner information is shown.
Phones and e-mails of the people behind this property's owner, traced from licensed contact data.
Owner phones and e-mails come with a plan - traced from licensed contact data, with verification and Do-Not-Call flags on every number.
The mortgage data comes with a plan: recorded loans of the owner - lender, amount, rate and the estimated maturity - as part of the Ownership Intelligence workspace.
Registration is required before any owner information is shown.
Rey answers here. ChatGPT, Grok and Claude get the same data packet.
Includes: Price & PSF · Cap rate · Location · Zoning
Our comps and market reports get this label in your Google results.
 One click on Google
- 10 Targeted Leads
- 1 Full Property Report
- Lead Lists by Intent
- Signals & Scores
- Building Details
- Value Estimation
- Cap Rate Evaluation
- Liens & Mortgages
- Ownership & Contacts
- Local Market trends
-
Zoning Insight— not in this plan -
Location Analytics— not in this plan
- 300 Targeted Leads a month
- 30 Full Property Reports
- Lead Lists by Intent
- Signals & Scores
- Building Details
- Value Estimation
- Cap Rate Evaluation
- Liens & Mortgages
- Ownership & Contacts
- Local Market trends
- Zoning Insight
-
Location Analytics— not in this plan
- 1,500 Targeted Leads a month
- 150 Full Property Reports
- Lead Lists by Intent
- Signals & Scores
- Building Details
- Value Estimation
- Cap Rate Evaluation
- Liens & Mortgages
- Ownership & Contacts
- Local Market trends
- Zoning Insight
- Location Analytics
The PDF can’t be displayed here
Use Download PDF or Open in new tab above to view the sample report.
Sample leads
-
 Off Market
8255 OLD HOLLAND RD, CHARLOTTE, NC 28262
Absentee
8255 OLD HOLLAND RD, CHARLOTTE, NC 28262
-
 Off Market
780 W 8TH MILE RD, FERNDALE, MI 48220-2422
Held 22 yrs
780 W 8TH MILE RD, FERNDALE, MI 48220-2422
-
 Off Market
435-437 FRELINGHUYSEN AVE #437, NEWARK, NJ 07114-1426
Held 21 yrs
435-437 FRELINGHUYSEN AVE #437, NEWARK, NJ 07114-1426
-
 Off Market
3157 MAGIC HOLW BLVD, VIRGINIA BEACH, VA 23453-3010
Held 10 yrs
3157 MAGIC HOLW BLVD, VIRGINIA BEACH, VA 23453-3010
Sample leads
-
 Off Market
3933 WALNUT BLVD, BRENTWOOD, CA 94513-1269
Loan from 2012Marcotte Family Lp
3933 WALNUT BLVD, BRENTWOOD, CA 94513-1269
-
 Off Market
9203 HWY 6TH S, HOUSTON, TX 77083-6386
Matures in 15 moLoan from 2018Goldman-sachs Mtg
9203 HWY 6TH S, HOUSTON, TX 77083-6386
-
 Off Market
590 NW 11TH ST, MIAMI, FL 33136-2401
Hurwit Investments Ltd
590 NW 11TH ST, MIAMI, FL 33136-2401
-
 Off Market
147 E ST, ST, NY
Loan from 20067.7% rateNew York National Bank
147 E ST, ST, NY
Still being built. It lands here next, beside the two above.
The PDF can’t be displayed here
Your browser has no PDF viewer of its own.