Realmo Analytics
Get reports on 50M+ commercial properties in the US. Find and target property leads based on your business goal.
We will call you to discuss how Realmo analytics may help you.
 Entity Owned
 For Sale
1 / 2
Property summary
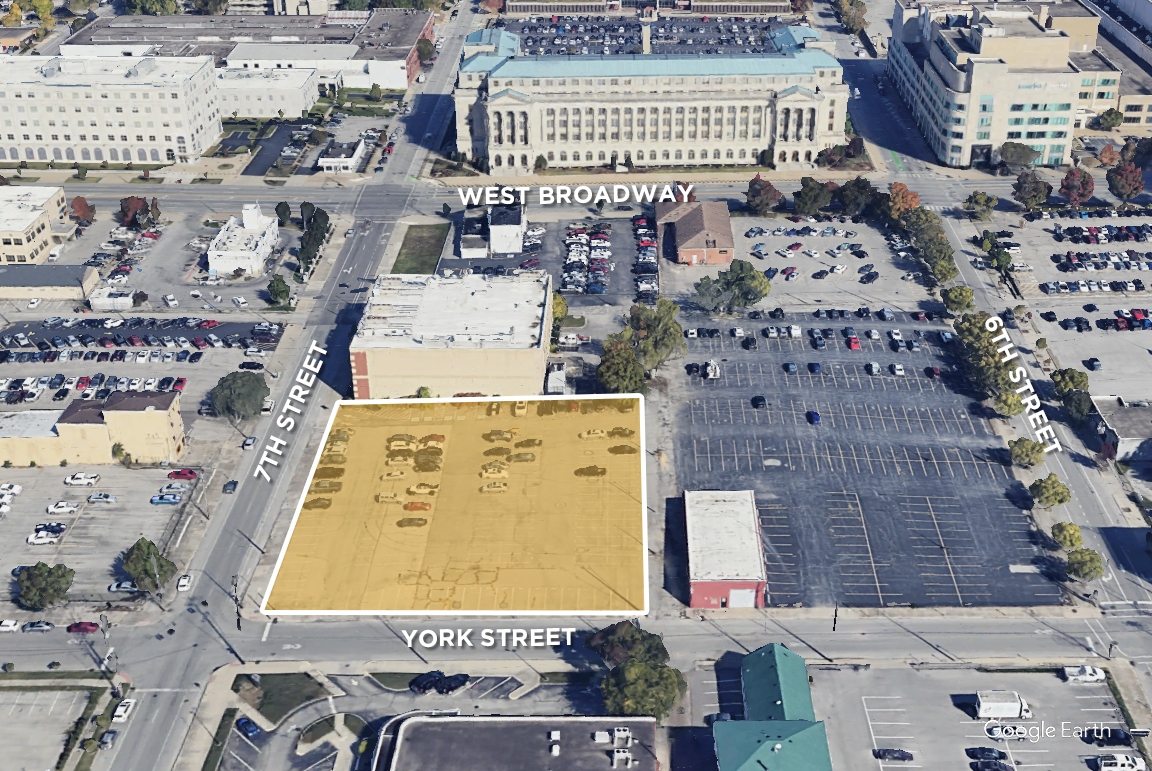
This exceptional commercial land opportunity presents a highly desirable 0.99-acre parcel located in the heart of downtown Louisville, Kentucky. The property, situated at 725 S 7th St, features a substantial 154-space parking lot, ideal for various commercial uses. The lot is comprised of seven contiguous parcels (APN: 029A00390000, 029A00380000, 029A00370000, 029A00360037, 029A00350000, 029A00340000, 029A00330034), offering flexibility for development or continued operation as a parking… facility. Its strategic location on the corner of 7th and York Streets provides excellent ingress and egress, ensuring convenient access for patrons. The property benefits from its proximity to key landmarks including the USPS, LG&E, Gannett/Courier Journal, and numerous government services, guaranteeing high visibility and potential for strong rental income. The asking price is $1,250,000, reflecting the significant value and potential of this prime downtown location. The property is zoned PD - Planned Development, offering a range of development possibilities. This presents a rare opportunity to acquire a substantial commercial land holding in a thriving urban environment. Serious inquiries are encouraged.
Ownership intelligence
Owner of record from public deeds, plus portfolio, hold profile and investor signals where the data supports them. Included with a plan.
Owner contacts
Skip-traced phones and e-mails of the owner. Included with a plan.
Debts
Recorded lenders, amounts and estimated maturities of the owner's loan book — included with a plan.
Property tax · 2023
Value estimate
· Oct 2026Realmo valuation models over county records.
Recently sold
No data for this sectionNo cleaned sale $/SF benchmark exists for this use type in this ZIP, submarket or county yet.
Cap rate analysis
Price anchors at 6 / 6.5 / 7% — in the full report.
Zoning insight
Location intelligence
Demand index: how under-served this business type is around this point — modeled from the LocInt grid (area demand vs. what already operates, adjusted by real visit traffic). Higher means stronger unmet demand.
Location
Every figure names its source: public record, benchmark, or modeled. Coverage varies by property — thin data is stated as missing, never invented.
Comparables
6 recorded sales · 15 properties nearbyComparable nearby


Similar in This City for Sale


Similar in This City for Lease


Instant AI valuation built from comps, income signals, and proprietary benchmarks.A defensible range, not a single guess.
from $199/month
- Lot area
- 0.17 ac
- APN
- 08029A00390000
- Zoning
- C2-COMMERCIAL
- Assessed value · 2023
- $90,550
- Annual tax · 2023
- $1,290
- Estimated market rent / SF
- Potential gross income
- Vacancy allowance
- Effective gross income
- Benchmark operating expenses
- Stabilized NOI
- Property tax · 2023
- $1,290
- Selected cap rate
Cap rate calculated from real income and expense signals, benchmarked against sales of similar assets nearby.
from $199/month
Price sensitivity
The rate is the decision lever; valuation is the consequence.
The recorded zoning designation, what the district officially allows, and the municipal source it comes from.
Zoning designation
Registration is required before the official district profile is shown.
Unlock the evidence behind ownership: portfolio, transactions, debt and any signals we can model, to help you decide who to contact next.
Registration is required before any owner information is shown.
Phones and e-mails of the people behind this property's owner, traced from licensed contact data.
Owner phones and e-mails come with a plan - traced from licensed contact data, with verification and Do-Not-Call flags on every number.
The mortgage data comes with a plan: recorded loans of the owner - lender, amount, rate and the estimated maturity - as part of the Ownership Intelligence workspace.
Registration is required before any owner information is shown.
- 10 Targeted Leads
- 1 Full Property Report
- Lead Lists by Intent
- Signals & Scores
- Building Details
- Value Estimation
- Cap Rate Evaluation
- Liens & Mortgages
- Ownership & Contacts
- Local Market trends
-
Zoning Insight— not in this plan -
Location Analytics— not in this plan
- 300 Targeted Leads a month
- 30 Full Property Reports
- Lead Lists by Intent
- Signals & Scores
- Building Details
- Value Estimation
- Cap Rate Evaluation
- Liens & Mortgages
- Ownership & Contacts
- Local Market trends
- Zoning Insight
-
Location Analytics— not in this plan
- 1,500 Targeted Leads a month
- 150 Full Property Reports
- Lead Lists by Intent
- Signals & Scores
- Building Details
- Value Estimation
- Cap Rate Evaluation
- Liens & Mortgages
- Ownership & Contacts
- Local Market trends
- Zoning Insight
- Location Analytics
The PDF can’t be displayed here
Use Download PDF or Open in new tab above to view the sample report.
Sample leads
-
 Off Market
AK
Absentee
AK
-
 Off Market
406 W, BROADWAY, AK
Absentee
406 W, BROADWAY, AK
-
 Off Market
W, BROADWAY, AK
Absentee
W, BROADWAY, AK
-
 Off Market
1201, CAPTAINS BAY RD, AK
Absentee
1201, CAPTAINS BAY RD, AK
Sample leads
-
 Off Market
1404, ATS, AK
Loan from 20067.7% rateColumbia State Bank
1404, ATS, AK
-
 Off Market
1503, BALLYHOO RD, AK
Loan from 2009Columbia State Bank
1503, BALLYHOO RD, AK
-
 Off Market
721 E, DEPOT DR, AK
Loan from 2019Northrim Bank
721 E, DEPOT DR, AK
-
 Off Market
AK
Loan from 2008Bmo Capital Markets Corp
AK
Still being built. It lands here next, beside the two above.
The PDF can’t be displayed here
Your browser has no PDF viewer of its own.