
New search
Property profile & analytics
OFF-MARKET
Estimated value
$755,000
Outlet malls
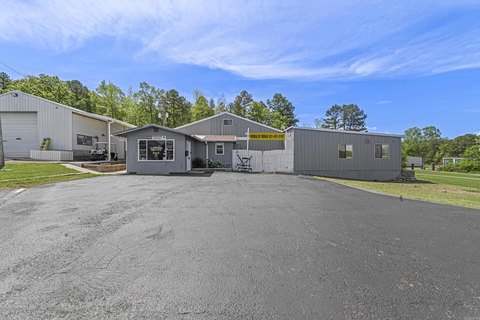
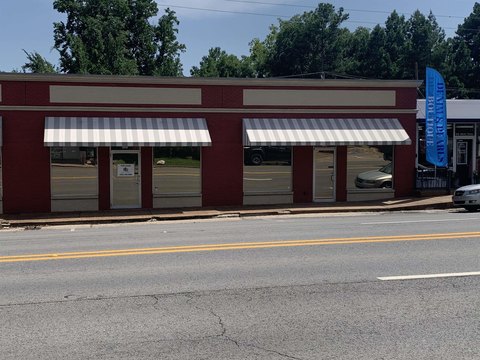
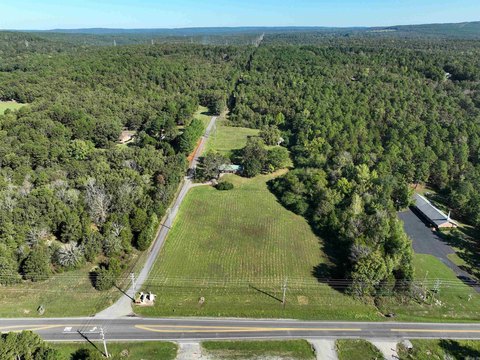
501 7th St, Heber Springs, AR 72543-4402
Entity Owned
7-yr Hold
Absentee Owner
~
Est. High Equity
Property ID
US05-0993200
Property profile
Verified
Property type
Outlet malls
Use group
WHOLESALE OUTLET, DISCOUNT STORE
Year built
1975
Total area
26,328 SF
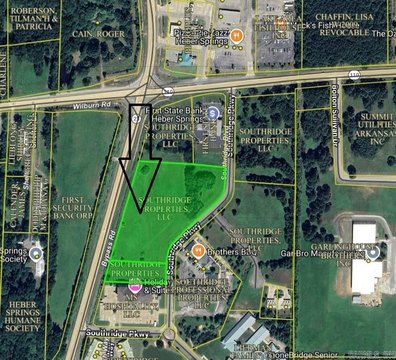
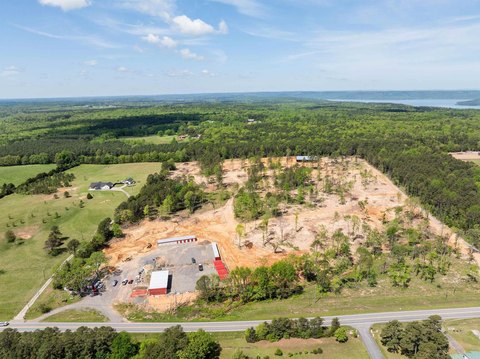
Lot
1.72 ac (75,010 SF)
APN
300-00875-000-C
UPID
US05-0993200
Cap rate & NOI
Priority signal for investors
Implied cap rate, NOI & suggested price
Cap rate vs submarket · NOI estimate · 3 price anchors
Implied cap rate, NOI & suggested price
Cap vs submarket · NOI estimate · 3 price anchors
Current use
Occupant on record · Public records
-
Tractor Supply Co. Pet Store & Service
Value estimations
Realmo proprietary · 4 methods
AI Approach
AI
by Request
CAP Approach
CAP
by Request
Comparable Approach
Comparable
$686k
Blend (final)
Blend
$755k
Owner & transaction history
Fidc 92 LLC · 7 yrs held
Fidc 92 LLC
since 2019
4 recorded transactions
Zoning & alternative use
Permitted uses
Permitted uses
Allowed · conditional · prohibited
Cap rate
Implied · in-place · derived from last sale + estimated NOI
Implied Cap rate
#1
Implied · in-place · NOI ÷ last sale
In-place · derived from last sale + estimated NOI
Cap rate, NOI & submarket benchmark
Implied cap rate vs Heber Springs submarket · NOI estimate · Typical band, median & reading
Implied cap rate, NOI & submarket benchmark
Cap vs Heber Springs submarket · NOI estimate · typical band, median & reading
Refine your cap rate
8-question underwriting flow
1.
Property current status — Going-In vs Stabilized
2.
Price for denominator — asking / offer / market
3.
Leasing status & lease structure (NNN / Gross)
4.
Tenant risk profile & vacancy assumption
5.
Upload T12 / rent roll / OM (optional)
Refine in 60 seconds, get exact suggested price
T12 upload · Submarket benchmarks · Sensitivity grid
Suggested price · 3 cap rate anchors
Income approach @ 5% / 7% / 9% — aggressive / typical / conservative
Suggested price at 5% / 7% / 9% cap
Aggressive / typical / conservative · Implied $/SF per anchor · Sensitivity grid
Suggested price at 5% / 7% / 9% cap
Aggressive / typical / conservative · implied $/SF · sensitivity
Value
AI, CAP & Alternative Use estimations · Realmo proprietary blendValue Estimations
Based on Realmo’s proprietary methodology
AI Approach
Method
Estimation
Statistic approach
by Request
ML approach
by Request
CAP Approach
CAP Return
Estimation
6%
by Request
6.5%
by Request
7%
by Request
Alternative Use
Use
Estimation
RETAIL STORES
$860,000
Current use
Blend value · Realmo final
$755k
Range $680k – $831k · ±10%
Realmo estimate · informational only.
These numbers are calculated by our models from public records and may not reflect actual market value.
Not an appraisal.
Verify with a licensed appraiser before transacting. Realmo accepts no liability for divergence from real-world outcomes.
View the full estimation — every method, every assumption
Confidence drivers & risk notes · Custom comparable set · Free for first 3 / day
Full estimation methodology
Every method · every assumption · confidence drivers
Price per SF
Sale + rent benchmarks
Subject property
$29 / SF
Submarket sale & rent benchmarks
Median sale $/SF · Asking & closed rent · Submarket vacancy
Submarket sale & rent benchmarks
Median sale $/SF · asking & closed rent · submarket vacancy
Property tax & assessments
Tax year 2024Property tax & assessments
Tax year 2024
Tax billed
$7,640
Tax year 2024
Assessed value
$177,678
Assessed 2024
Previous assessed
$177,678
+0.0% YoY
Effective rate
4.30%
On assessed value
Assessed land
$31,498
Assessed improvement
$146,180
Land market value
$157,490
Improvement market value
$730,900
Total market value
$888,390
Applied tax rate
101.0000
Comparables
6 recent transactions · within 1.5 miComparable in this city
6 recent transactions
Comparable in this City


Similar Nearby for Sale
Similar Nearby for Lease


Recent comparable sales
Sale price & price/SF · Sale date & distance · Adjustments & confidence
Recent comparable sales
Sale price & $/SF · sale date & distance · adjustments
Property description
Physical attributes from public recordsBuilding & lot
Public records
Property type
Outlet malls
Use group
WHOLESALE OUTLET, DISCOUNT STORE
Status
Off-Market
Year built
1975
Heating
CENTRAL
Cooling
CENTRAL
Stories
1
Bathrooms
2
Total area
26,328 SF
Lot
1.72 ac (75,010 SF)
APN
300-00875-000-C
UPID
US05-0993200
Jurisdiction
CLEBURNE
Zoning & alternative use
Zoning · permitted uses
Permitted & conditional uses
Allowed uses · Special-permit conditions · Prohibited uses
Permitted & conditional uses
Allowed · special-permit conditions · prohibited
Alternative use value scenarios
Repositioning upside vs current use
RETAIL STORES Current
Est. value
$860,000
RETAIL STORES Current
Alternative use deep dive — conversion cost, permits, timeline
Conversion cost estimate · Permit path & risks · Stabilized NOI per option
Alternative use deep dive
Conversion cost · permit path · stabilized NOI per option
Building & site characteristics
From public records
Year built
1975
Heating
CENTRAL
Cooling
Yes
Stories
1
Bathrooms
2
Lot
1.72 ac
Current owner
From public records · entity-resolved
Fidc 92 LLC
Entity
Mailing address
100 DEBARTOLO PL STE #400, YOUNGSTOWN, OH 44512-6099
Mailing matches property
Different — outreach signal
Owner-occupied
No
Ownership since
2019
Owner contacts — direct phone, email, and related entities
Decision-maker phone · Verified email · Related entities & filings
Owner contacts
Email · phone · related entities
Sales History
4 recorded events · public records
Date
Price
Buyer
Seller
Deed Type
Mortgage
May 30, 2019
$800,000
Fidc 92 LLC
Quality Floorz Of Heber Springs LLC
Warranty Deed
$1,925,000 · Ameriserv Financial Bank
Aug 28, 2018
—
Quality Floorz Of Heber Springs LLC
—
Deed
related
$523,000 · Centennial Bank
Dec 19, 2016
$585,000
Quality Floorz Of Heber Springs LLC
Dale Parish
Warranty Deed
$468,000 · Fnbt Bank
Jan 29, 2008
—
Robert W Clay
Town And Country Super Market Incor
Warranty Deed
—
Coming soon
Costs & Benchmarks
Operating expenses, capex projections, utility benchmarks, and submarket comparables — all in one view.
Coming soon
Risks
Flood, climate, environmental, title, and tenant-concentration risk — surfaced with mitigations and source citations.
Try Rey
Ask anything about this address in plain English.
“Is 15.6% cap rate sustainable?” · “Best tenant mix for BU1?” · “What’s the redev upside?”
You own 501 7th St?
List it free. Reach 20,000 daily buyers.
We’ve already pulled the facts. Confirm photos + price and you’re live in 2 minutes.
List this address →
Full reports are paid
Unlock the full Property Analytics report
Start free for 7 days — no card required. Full owner contacts, all 4 valuations with methodology, refine flow, comparable adjustments, foot-traffic deep dive, export to PDF / CSV.


