
New search
Property profile & analytics
FOR SALE
Industrial land
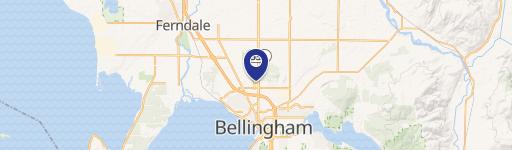
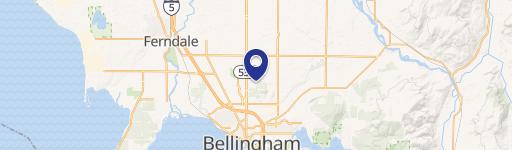
465 Sequoia Dr, Bellingham, WA 98226
Entity Owned
4-yr Hold
Absentee Owner
~
Est. High Equity
Property ID
US90-0392068
 For Sale
$3,200,000
465 Sequoia Dr, Bellingham, WA 98226
View Listing →
Property profile
Verified
Property type
Industrial land
Use group
INDUSTRIAL - VACANT LAND
Lot
1.71 ac (74,662 SF)
Zoning code
PIC
APN
380201 311122 0000
UPID
US90-0392068
Cap rate & NOI
Priority signal for investors
Implied cap rate, NOI & suggested price
Cap rate vs submarket · NOI estimate · 3 price anchors
Implied cap rate, NOI & suggested price
Cap vs submarket · NOI estimate · 3 price anchors
Value estimations
Realmo proprietary · 4 methods
AI Approach
AI
$870k
CAP Approach
CAP
by Request
Comparable Approach
Comparable
by Request
Blend (final)
Blend
$830k
Owner & transaction history
B&d Farncis Holdings LLC · 4 yrs held
B&d Farncis Holdings LLC
since 2021
Last sale
$765,000
7 recorded transactions
Zoning & alternative use
PIC · Bellingham, WA
Permitted uses
Permitted uses
Allowed · conditional · prohibited
Cap rate
Implied · in-place · derived from last sale + estimated NOI
Implied Cap rate
#1
Implied · in-place · NOI ÷ last sale
In-place · derived from last sale + estimated NOI
Cap rate, NOI & submarket benchmark
Implied cap rate vs Bellingham submarket · NOI estimate · Typical band, median & reading
Implied cap rate, NOI & submarket benchmark
Cap vs Bellingham submarket · NOI estimate · typical band, median & reading
Refine your cap rate
8-question underwriting flow
1.
Property current status — Going-In vs Stabilized
2.
Price for denominator — asking / offer / market
3.
Leasing status & lease structure (NNN / Gross)
4.
Tenant risk profile & vacancy assumption
5.
Upload T12 / rent roll / OM (optional)
Refine in 60 seconds, get exact suggested price
T12 upload · Submarket benchmarks · Sensitivity grid
Suggested price · 3 cap rate anchors
Income approach @ 5% / 7% / 9% — aggressive / typical / conservative
Suggested price at 5% / 7% / 9% cap
Aggressive / typical / conservative · Implied $/SF per anchor · Sensitivity grid
Suggested price at 5% / 7% / 9% cap
Aggressive / typical / conservative · implied $/SF · sensitivity
Value
AI, CAP & Alternative Use estimations · Realmo proprietary blendValue Estimations
Based on Realmo’s proprietary methodology
AI Approach
Method
Estimation
Statistic approach
$915,000
ML approach
$870,000
CAP Approach
CAP Return
Estimation
6%
by Request
6.5%
by Request
7%
by Request
Blend value · Realmo final
$830k
Range $747k – $913k · ±10% · vs last sale $765k (Oct 15 2021)
Last sale anchor
$765k
Oct 15 2021
Realmo estimate · informational only.
These numbers are calculated by our models from public records and may not reflect actual market value.
Not an appraisal.
Verify with a licensed appraiser before transacting. Realmo accepts no liability for divergence from real-world outcomes.
View the full estimation — every method, every assumption
Confidence drivers & risk notes · Custom comparable set · Free for first 3 / day
Full estimation methodology
Every method · every assumption · confidence drivers
Price per SF
Sale + rent benchmarks
Subject property
—
Submarket sale & rent benchmarks
Median sale $/SF · Asking & closed rent · Submarket vacancy
Submarket sale & rent benchmarks
Median sale $/SF · asking & closed rent · submarket vacancy
Property tax & assessments
Tax year 2024Property tax & assessments
Tax year 2024
Tax billed
$3,129
Tax year 2024
Assessed value
$421,130
Assessed 2023
Previous assessed
$379,397
+11.0% YoY
Effective rate
0.74%
On assessed value
Assessed land
$421,130
Land market value
$421,130
Total market value
$421,130
Applied tax rate
105.0000
Comparables
6 recent transactions · within 1.5 miComparable in this city
6 recent transactions
Comparable in this City


Similar Nearby for Sale

Similar Nearby for Lease


Recent comparable sales
Sale price & price/SF · Sale date & distance · Adjustments & confidence
Recent comparable sales
Sale price & $/SF · sale date & distance · adjustments
Property description
Physical attributes from public recordsBuilding & lot
Public records
Property type
Industrial land
Use group
INDUSTRIAL - VACANT LAND
Status
For Sale
Heating
NONE
Lot
1.71 ac (74,662 SF)
Zoning code
PIC
APN
380201 311122 0000
UPID
US90-0392068
Jurisdiction
WHATCOM
Zoning & alternative use
PIC · Bellingham, WA
Zoning PIC · permitted uses
PIC · Bellingham, WA
Permitted & conditional uses
Allowed uses · Special-permit conditions · Prohibited uses
Permitted & conditional uses
Allowed · special-permit conditions · prohibited
Bellingham. Always verify with local authorities before improvements.
Building & site characteristics
From public records
Heating
NONE
Lot
1.71 ac
Current owner
From public records · entity-resolved
B&d Farncis Holdings LLC
Entity
Mailing address
468 W HORTON RD, BELLINGHAM, WA 98226-1205
Mailing matches property
Different — outreach signal
Owner-occupied
No
Ownership since
2021
Owner contacts — direct phone, email, and related entities
Decision-maker phone · Verified email · Related entities & filings
Owner contacts
Email · phone · related entities
Sales History
7 recorded events · public records
Date
Price
Buyer
Seller
Deed Type
Mortgage
Oct 15, 2021
$765,000
B&d Farncis Holdings LLC
R & H Farms INC
Warranty Deed
—
Oct 23, 2013
$400,000
R & H Farrns INC
Bank Of The Pacific
Grant Deed
—
Jul 26, 2010
$3,175,000
Bank Of Pacific
Clark Laughlan H
Trustees Deed
related
—
May 29, 2009
—
Sv Investments LLC
—
Deed Of Trust
related
$4,425,000 · Bank Of Pacific
Aug 15, 2005
$1,775,000
Sv Investments LLC
Syre,david R & Kay E
Quit Claim Deed
related
$1,342,000 · Whidbey Island Bank
Aug 15, 2005
—
David R Syre
Trillium Corp
Quit Claim Deed
related
—
—
—
Trillium Corp
—
Deed Of Trust
related
$300,000 · Lloyd Born
Coming soon
Costs & Benchmarks
Operating expenses, capex projections, utility benchmarks, and submarket comparables — all in one view.
Coming soon
Risks
Flood, climate, environmental, title, and tenant-concentration risk — surfaced with mitigations and source citations.
Try Rey
Ask anything about this address in plain English.
“Is 15.6% cap rate sustainable?” · “Best tenant mix for BU1?” · “What’s the redev upside?”
Full reports are paid
Unlock the full Property Analytics report
Start free for 7 days — no card required. Full owner contacts, all 4 valuations with methodology, refine flow, comparable adjustments, foot-traffic deep dive, export to PDF / CSV.


