
New search
Property profile & analytics
OFF-MARKET
Estimated value
$2,140,000
Banks
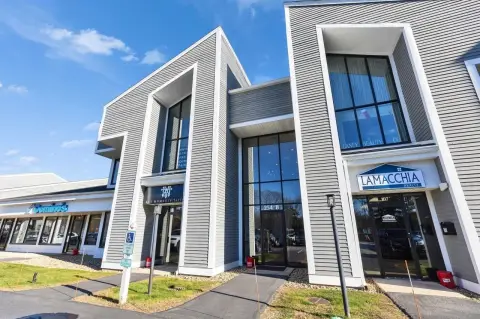
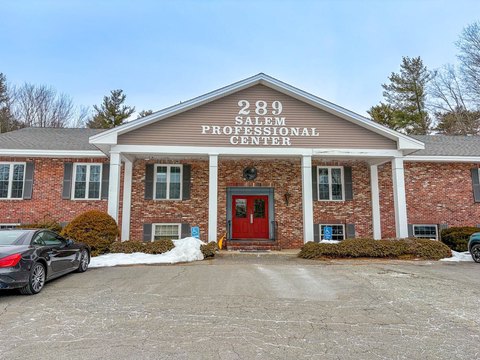
45 Broadway, Salem, NH 03079-3014
Entity Owned
6-yr Hold
~
Est. High Equity
Property ID
US58-0255284
Property profile
Verified
Property type
Banks
Use group
FINANCIAL BUILDING
Year built
1980
Construction
FRAME
Total area
4,273 SF
Lot
0.89 ac (38,768 SF)
Zoning code
CIC
APN
SLEM M:99 B:1062 L:
UPID
US58-0255284
Cap rate & NOI
Priority signal for investors
Implied cap rate, NOI & suggested price
Cap rate vs submarket · NOI estimate · 3 price anchors
Implied cap rate, NOI & suggested price
Cap vs submarket · NOI estimate · 3 price anchors
Current use
Occupant on record · Public records
-
Zachary Magistro Financial Advisor
-
Citizens Bank Loan Service
-
Michelle LaFlamme - Citizens, Home Mortgage Loan Service Bank
-
Michael Meehan Financial Advisor
-
Citizens Bank ATM Atm
Value estimations
Realmo proprietary · 4 methods
AI Approach
AI
$2.33M
CAP Approach
CAP
by Request
Comparable Approach
Comparable
by Request
Blend (final)
Blend
$2.14M
Owner & transaction history
45 Salem Holdings LLC · 6 yrs held
45 Salem Holdings LLC
since 2020
Last sale
$1.8M
5 recorded transactions
Zoning & alternative use
CIC · Salem, NH
Permitted uses
Permitted uses
Allowed · conditional · prohibited
Cap rate
Implied · in-place · derived from last sale + estimated NOI
Implied Cap rate
#1
Implied · in-place · NOI ÷ last sale
In-place · derived from last sale + estimated NOI
Cap rate, NOI & submarket benchmark
Implied cap rate vs Salem submarket · NOI estimate · Typical band, median & reading
Implied cap rate, NOI & submarket benchmark
Cap vs Salem submarket · NOI estimate · typical band, median & reading
Refine your cap rate
8-question underwriting flow
1.
Property current status — Going-In vs Stabilized
2.
Price for denominator — asking / offer / market
3.
Leasing status & lease structure (NNN / Gross)
4.
Tenant risk profile & vacancy assumption
5.
Upload T12 / rent roll / OM (optional)
Refine in 60 seconds, get exact suggested price
T12 upload · Submarket benchmarks · Sensitivity grid
Suggested price · 3 cap rate anchors
Income approach @ 5% / 7% / 9% — aggressive / typical / conservative
Suggested price at 5% / 7% / 9% cap
Aggressive / typical / conservative · Implied $/SF per anchor · Sensitivity grid
Suggested price at 5% / 7% / 9% cap
Aggressive / typical / conservative · implied $/SF · sensitivity
Value
AI, CAP & Alternative Use estimations · Realmo proprietary blendValue Estimations
Based on Realmo’s proprietary methodology
AI Approach
Method
Estimation
Statistic approach
$2,565,000
ML approach
$2,330,000
CAP Approach
CAP Return
Estimation
6%
by Request
6.5%
by Request
7%
by Request
Blend value · Realmo final
$2.14M
Range $1.93M – $2.35M · ±10% · vs last sale $1.83M (Jan 31 2020)
Last sale anchor
$1.83M
Jan 31 2020
Realmo estimate · informational only.
These numbers are calculated by our models from public records and may not reflect actual market value.
Not an appraisal.
Verify with a licensed appraiser before transacting. Realmo accepts no liability for divergence from real-world outcomes.
View the full estimation — every method, every assumption
Confidence drivers & risk notes · Custom comparable set · Free for first 3 / day
Full estimation methodology
Every method · every assumption · confidence drivers
Price per SF
Sale + rent benchmarks
Subject property
$501 / SF
Submarket sale & rent benchmarks
Median sale $/SF · Asking & closed rent · Submarket vacancy
Submarket sale & rent benchmarks
Median sale $/SF · asking & closed rent · submarket vacancy
Property tax & assessments
Tax year 2023Property tax & assessments
Tax year 2023
Tax billed
$19,117
Tax year 2023
Assessed value
$1,127,200
Assessed 2023
Previous assessed
$1,127,200
+0.0% YoY
Effective rate
1.70%
On assessed value
Assessed land
$424,500
Assessed improvement
$702,700
Applied tax rate
66,660.0000
Comparables
6 recent transactions · within 1.5 miComparable in this city
6 recent transactions
Comparable in this City


Similar Nearby for Sale

Similar Nearby for Lease
Recent comparable sales
Sale price & price/SF · Sale date & distance · Adjustments & confidence
Recent comparable sales
Sale price & $/SF · sale date & distance · adjustments
Property description
Physical attributes from public recordsBuilding & lot
Public records
Property type
Banks
Use group
FINANCIAL BUILDING
Status
Off-Market
Year built
1980
Construction
FRAME
Heating
HOT WATER
Cooling
YES
Buildings
1
Stories
1
Total area
4,273 SF
Lot
0.89 ac (38,768 SF)
Zoning code
CIC
APN
SLEM M:99 B:1062 L:
UPID
US58-0255284
Jurisdiction
SALEM TOWN
Metro division
ROCKINGHAM COUNTY-STRAFFORD COUNTY, NH METROPOLITAN DIVISION
Zoning & alternative use
CIC · Salem, NH
Zoning CIC · permitted uses
CIC · Salem, NH
Permitted & conditional uses
Allowed uses · Special-permit conditions · Prohibited uses
Permitted & conditional uses
Allowed · special-permit conditions · prohibited
Salem. Always verify with local authorities before improvements.
Building & site characteristics
From public records
Year built
1980
Construction
FRAME
Heating
HOT WATER
Cooling
Yes
Stories
1
Buildings
1
Lot
0.89 ac
Current owner
From public records · entity-resolved
45 Salem Holdings LLC
Entity
Mailing address
321 LAFAYETTE RDD, HAMPTON, NH 03842-2158
Ownership since
2020
Owner contacts — direct phone, email, and related entities
Decision-maker phone · Verified email · Related entities & filings
Owner contacts
Email · phone · related entities
Sales History
5 recorded events · public records
Date
Price
Buyer
Seller
Deed Type
Mortgage
Jan 31, 2020
$2,200,000
45 Salem Holdings LLC
Spp Citizens Nlref V LLC
Quit Claim Deed
related
$1,760,000 · North Shore Bk
Jan 9, 2020
$1,775,267
Spp Citizens Nlref V LLC
Arc Cbslmnh001 LLC
Quit Claim Deed
related
$39,500,000 · Sunflower Bk
Dec 31, 2012
$1,832,100
Arc Cbslmnh 1 LLC
American Cfg Portfolio
Warranty Deed
—
Feb 7, 2008
—
Inland Amer Cfg Portf LLC
—
Deed Of Trust
related
$200,000,000 · Sovereign Bank
Jun 27, 2007
$2,136,500
Inland American Cfg Port
Citizens Bank Of Nh
Warranty Deed
—
Coming soon
Costs & Benchmarks
Operating expenses, capex projections, utility benchmarks, and submarket comparables — all in one view.
Coming soon
Risks
Flood, climate, environmental, title, and tenant-concentration risk — surfaced with mitigations and source citations.
Try Rey
Ask anything about this address in plain English.
“Is 15.6% cap rate sustainable?” · “Best tenant mix for BU1?” · “What’s the redev upside?”
You own 45 Broadway?
List it free. Reach 20,000 daily buyers.
We’ve already pulled the facts. Confirm photos + price and you’re live in 2 minutes.
List this address →
Full reports are paid
Unlock the full Property Analytics report
Start free for 7 days — no card required. Full owner contacts, all 4 valuations with methodology, refine flow, comparable adjustments, foot-traffic deep dive, export to PDF / CSV.


