
New search
Property profile & analytics
OFF-MARKET
Estimated value
$9,790,000
Mobile home & RV parks
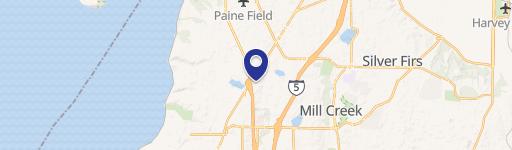
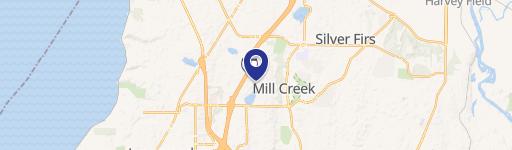
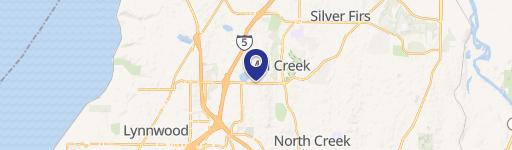
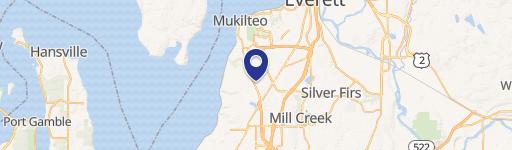
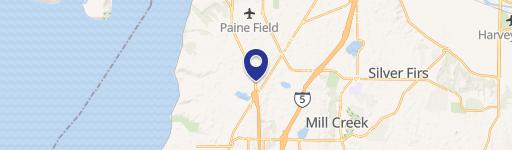
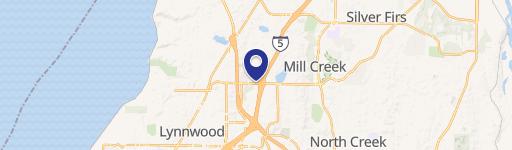
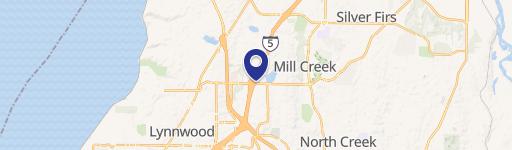
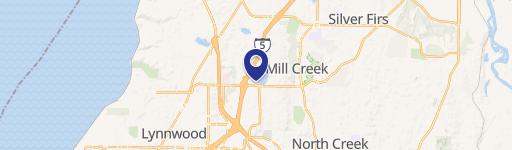
4111 164th SW St, Lynnwood, WA 98087-6909
Entity Owned
2-yr Hold
~
Est. High Equity
Property ID
US90-0393264
Property profile
Verified
Property type
Mobile home & RV parks
Use group
MOBILE HOME PARK, TRAILER PARK
Year built
1977
Construction
WOOD
Total area
2,272 SF
Lot
10.03 ac (436,907 SF)
Zoning code
SE
APN
372900200400
UPID
US90-0393264
Cap rate & NOI
Priority signal for investors
Implied cap rate, NOI & suggested price
Cap rate vs submarket · NOI estimate · 3 price anchors
Implied cap rate, NOI & suggested price
Cap vs submarket · NOI estimate · 3 price anchors
Current use
Occupant on record · Public records
-
Lynnwood Heights Mobile Home Campground & RV Park
Value estimations
Realmo proprietary · 4 methods
AI Approach
AI
$10.21M
CAP Approach
CAP
by Request
Comparable Approach
Comparable
by Request
Blend (final)
Blend
$9.79M
Owner & transaction history
Ch Realty X Cc Mhc Seattle Lynnwood · 2 yrs held
Ch Realty X Cc Mhc Seattle Lynnwood
since 2023
Last sale
$9.5M
4 recorded transactions
Zoning & alternative use
SE · Lynnwood, WA
Permitted uses
Permitted uses
Allowed · conditional · prohibited
Cap rate
Implied · in-place · derived from last sale + estimated NOI
Implied Cap rate
#1
Implied · in-place · NOI ÷ last sale
In-place · derived from last sale + estimated NOI
Cap rate, NOI & submarket benchmark
Implied cap rate vs Lynnwood submarket · NOI estimate · Typical band, median & reading
Implied cap rate, NOI & submarket benchmark
Cap vs Lynnwood submarket · NOI estimate · typical band, median & reading
Refine your cap rate
8-question underwriting flow
1.
Property current status — Going-In vs Stabilized
2.
Price for denominator — asking / offer / market
3.
Leasing status & lease structure (NNN / Gross)
4.
Tenant risk profile & vacancy assumption
5.
Upload T12 / rent roll / OM (optional)
Refine in 60 seconds, get exact suggested price
T12 upload · Submarket benchmarks · Sensitivity grid
Suggested price · 3 cap rate anchors
Income approach @ 5% / 7% / 9% — aggressive / typical / conservative
Suggested price at 5% / 7% / 9% cap
Aggressive / typical / conservative · Implied $/SF per anchor · Sensitivity grid
Suggested price at 5% / 7% / 9% cap
Aggressive / typical / conservative · implied $/SF · sensitivity
Value
AI, CAP & Alternative Use estimations · Realmo proprietary blendValue Estimations
Based on Realmo’s proprietary methodology
AI Approach
Method
Estimation
Statistic approach
$9,945,000
ML approach
$10,210,000
CAP Approach
CAP Return
Estimation
6%
by Request
6.5%
by Request
7%
by Request
Blend value · Realmo final
$9.79M
Range $8.81M – $10.77M · ±10% · vs last sale $9.50M (Jun 30 2023)
Last sale anchor
$9.50M
Jun 30 2023
Realmo estimate · informational only.
These numbers are calculated by our models from public records and may not reflect actual market value.
Not an appraisal.
Verify with a licensed appraiser before transacting. Realmo accepts no liability for divergence from real-world outcomes.
View the full estimation — every method, every assumption
Confidence drivers & risk notes · Custom comparable set · Free for first 3 / day
Full estimation methodology
Every method · every assumption · confidence drivers
Price per SF
Sale + rent benchmarks
Subject property
$4,309 / SF
Submarket sale & rent benchmarks
Median sale $/SF · Asking & closed rent · Submarket vacancy
Submarket sale & rent benchmarks
Median sale $/SF · asking & closed rent · submarket vacancy
Property tax & assessments
Tax year 2023Property tax & assessments
Tax year 2023
Tax billed
$52,980
Tax year 2023
Assessed value
$5,750,000
Assessed 2023
Previous assessed
$4,970,000
+15.7% YoY
Effective rate
0.92%
On assessed value
Assessed land
$4,326,300
Assessed improvement
$1,423,700
Land market value
$4,326,300
Improvement market value
$1,423,700
Total market value
$5,750,000
Applied tax rate
2,446.0000
Comparables
6 recent transactions · within 1.5 miComparable in this city
6 recent transactions
Comparable in this City


Similar Nearby for Sale


Similar Nearby for Lease


Recent comparable sales
Sale price & price/SF · Sale date & distance · Adjustments & confidence
Recent comparable sales
Sale price & $/SF · sale date & distance · adjustments
Property description
Physical attributes from public recordsBuilding & lot
Public records
Property type
Mobile home & RV parks
Use group
MOBILE HOME PARK, TRAILER PARK
Status
Off-Market
Year built
1977
Construction
WOOD
Heating
YES
Cooling
NONE
Stories
1
Total area
2,272 SF
Lot
10.03 ac (436,907 SF)
Zoning code
SE
APN
372900200400
UPID
US90-0393264
Jurisdiction
SNOHOMISH
Metro division
SEATTLE-BELLEVUE-EVERETT, WA METROPOLITAN DIVISION
Zoning & alternative use
SE · Lynnwood, WA
Zoning SE · permitted uses
SE · Lynnwood, WA
Permitted & conditional uses
Allowed uses · Special-permit conditions · Prohibited uses
Permitted & conditional uses
Allowed · special-permit conditions · prohibited
Lynnwood. Always verify with local authorities before improvements.
Building & site characteristics
From public records
Year built
1977
Construction
WOOD
Heating
YES
Cooling
Yes
Stories
1
Lot
10.03 ac
Current owner
From public records · entity-resolved
Ch Realty X Cc Mhc Seattle Lynnwood
Entity
Mailing address
13023 NE HWY 99TH #764, VANCOUVER, WA 98686-2767
Ownership since
2023
Owner contacts — direct phone, email, and related entities
Decision-maker phone · Verified email · Related entities & filings
Owner contacts
Email · phone · related entities
Sales History
4 recorded events · public records
Date
Price
Buyer
Seller
Deed Type
Mortgage
Jun 30, 2023
$9,500,000
Ch Realty X Cc Mhc Seattle Lynnwood
Pleasant Valley Manor LLC
Bargain And Sale Deed
—
Aug 11, 2017
—
Pleasant Valley Manor LLC
—
Deed
related
$2,075,000 · Jpmorgan Chase Bank NA
May 11, 1999
—
Pleasant Valley Manor LLC
Clark,morton & Eloise L
Quit Claim Deed
related
—
Mar 18, 1999
$2,800,000
Plesant Valley Manor LLC
Edel Weiss
Grant Deed
$2,100,000 · Washington Mutual Fsb
Coming soon
Costs & Benchmarks
Operating expenses, capex projections, utility benchmarks, and submarket comparables — all in one view.
Coming soon
Risks
Flood, climate, environmental, title, and tenant-concentration risk — surfaced with mitigations and source citations.
Try Rey
Ask anything about this address in plain English.
“Is 15.6% cap rate sustainable?” · “Best tenant mix for BU1?” · “What’s the redev upside?”
You own 4111 164th SW St?
List it free. Reach 20,000 daily buyers.
We’ve already pulled the facts. Confirm photos + price and you’re live in 2 minutes.
List this address →
Full reports are paid
Unlock the full Property Analytics report
Start free for 7 days — no card required. Full owner contacts, all 4 valuations with methodology, refine flow, comparable adjustments, foot-traffic deep dive, export to PDF / CSV.


