
New search
Property profile & analytics
FOR SALE
Investment properties
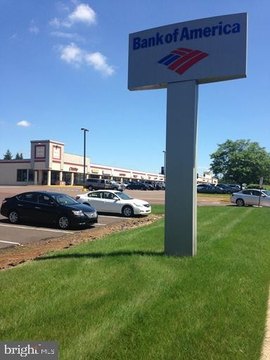
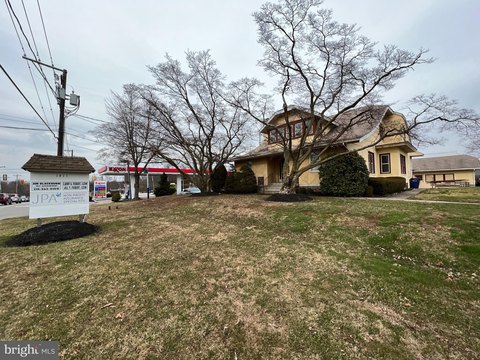
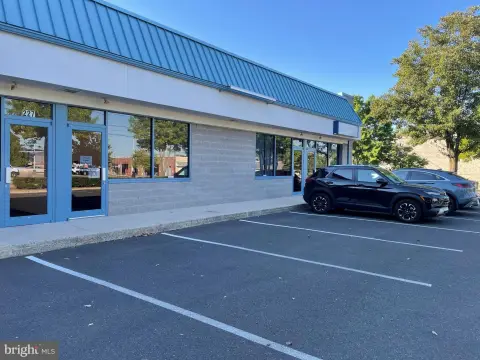
401 W Main St, Lansdale, PA 19446
Entity Owned
19-yr Hold
Free & Clear
Property ID
US73-1332756
 For Sale
1 / 3
For Sale
1 / 3
$1,150,000
401 W Main St, Lansdale, PA 19446
View Listing →
Property profile
Verified
Property type
Investment properties
Use group
OFFICE/RESIDENTIAL (MIXED USE)
Year built
1958
Total area
18,360 SF
Lot
0.24 ac (10,260 SF)
Zoning code
B
APN
11-00-09544-00-3
UPID
US73-1332756
Cap rate & NOI
Priority signal for investors
Implied cap rate, NOI & suggested price
Cap rate vs submarket · NOI estimate · 3 price anchors
Implied cap rate, NOI & suggested price
Cap vs submarket · NOI estimate · 3 price anchors
Value estimations
Realmo proprietary · 4 methods
AI Approach
AI
by Request
CAP Approach
CAP
by Request
Comparable Approach
Comparable
$1.35M
Blend (final)
Blend
$1.45M
Owner & transaction history
Lansdale Properties Group · 19 yrs held
Lansdale Properties Group
since 2006
1 recorded transaction
Zoning & alternative use
B · Lansdale, PA
Permitted uses
Permitted uses
Allowed · conditional · prohibited
Top alternative use upside
Neighborhood: shopping center
$2.4M
+40.1%
Cap rate
Implied · in-place · derived from last sale + estimated NOI
Implied Cap rate
#1
Implied · in-place · NOI ÷ last sale
In-place · derived from last sale + estimated NOI
Cap rate, NOI & submarket benchmark
Implied cap rate vs Lansdale submarket · NOI estimate · Typical band, median & reading
Implied cap rate, NOI & submarket benchmark
Cap vs Lansdale submarket · NOI estimate · typical band, median & reading
Refine your cap rate
8-question underwriting flow
1.
Property current status — Going-In vs Stabilized
2.
Price for denominator — asking / offer / market
3.
Leasing status & lease structure (NNN / Gross)
4.
Tenant risk profile & vacancy assumption
5.
Upload T12 / rent roll / OM (optional)
Refine in 60 seconds, get exact suggested price
T12 upload · Submarket benchmarks · Sensitivity grid
Suggested price · 3 cap rate anchors
Income approach @ 5% / 7% / 9% — aggressive / typical / conservative
Suggested price at 5% / 7% / 9% cap
Aggressive / typical / conservative · Implied $/SF per anchor · Sensitivity grid
Suggested price at 5% / 7% / 9% cap
Aggressive / typical / conservative · implied $/SF · sensitivity
Value
AI, CAP & Alternative Use estimations · Realmo proprietary blendValue Estimations
Based on Realmo’s proprietary methodology
AI Approach
Method
Estimation
Statistic approach
by Request
ML approach
by Request
CAP Approach
CAP Return
Estimation
6%
by Request
6.5%
by Request
7%
by Request
Alternative Use
Use
Estimation
COMMERCIAL (GENERAL)
$1,710,000
Current use
NEIGHBORHOOD: SHOPPING CENTER
$2,395,000
Change: +40% · Conversion: Difficult
Blend value · Realmo final
$1.45M
Range $1.31M – $1.60M · ±10%
Realmo estimate · informational only.
These numbers are calculated by our models from public records and may not reflect actual market value.
Not an appraisal.
Verify with a licensed appraiser before transacting. Realmo accepts no liability for divergence from real-world outcomes.
View the full estimation — every method, every assumption
Confidence drivers & risk notes · Custom comparable set · Free for first 3 / day
Full estimation methodology
Every method · every assumption · confidence drivers
Price per SF
Sale + rent benchmarks
Subject property
$79 / SF
Submarket sale & rent benchmarks
Median sale $/SF · Asking & closed rent · Submarket vacancy
Submarket sale & rent benchmarks
Median sale $/SF · asking & closed rent · submarket vacancy
Property tax & assessments
Tax year 2023Property tax & assessments
Tax year 2023
Tax billed
$21,951
Tax year 2023
Assessed value
$521,830
Assessed 2024
Previous assessed
$521,830
+0.0% YoY
Effective rate
4.21%
On assessed value
Assessed land
$115,480
Assessed improvement
$406,350
Land market value
$115,480
Improvement market value
$406,350
Total market value
$521,830
Applied tax rate
11.0000
Comparables
6 recent transactions · within 1.5 miComparable in this city
6 recent transactions
Comparable in this City


Similar Nearby for Sale


Similar Nearby for Lease


Recent comparable sales
Sale price & price/SF · Sale date & distance · Adjustments & confidence
Recent comparable sales
Sale price & $/SF · sale date & distance · adjustments
Property description
Physical attributes from public recordsBuilding & lot
Public records
Property type
Investment properties
Use group
OFFICE/RESIDENTIAL (MIXED USE)
Status
For Sale
Year built
1958
Heating
FORCED AIR
Cooling
CENTRAL
Total area
18,360 SF
Lot
0.24 ac (10,260 SF)
Zoning code
B
APN
11-00-09544-00-3
UPID
US73-1332756
Jurisdiction
MONTGOMERY
Metro division
PHILADELPHIA, PA METROPOLITAN DIVISION
Zoning & alternative use
B · Lansdale, PA
Zoning B · permitted uses
B · Lansdale, PA
Permitted & conditional uses
Allowed uses · Special-permit conditions · Prohibited uses
Permitted & conditional uses
Allowed · special-permit conditions · prohibited
Lansdale. Always verify with local authorities before improvements.
Alternative use value scenarios
Repositioning upside vs current use
COMMERCIAL (GENERAL) Current
Est. value
$1.7M
NEIGHBORHOOD: SHOPPING CENTER
Est. value
$2.4M
COMMERCIAL (GENERAL) Current
NEIGHBORHOOD: SHOPPING CENTER
Alternative use deep dive — conversion cost, permits, timeline
Conversion cost estimate · Permit path & risks · Stabilized NOI per option
Alternative use deep dive
Conversion cost · permit path · stabilized NOI per option
Building & site characteristics
From public records
Year built
1958
Heating
FORCED AIR
Cooling
Yes
Lot
0.24 ac
Current owner
From public records · entity-resolved
Lansdale Properties Group
Entity
Free & Clear · 19 yrs held
Mailing address
PO BOX 172, LEDERACH, PA 19450-0172
Ownership since
2006
Owner contacts — direct phone, email, and related entities
Decision-maker phone · Verified email · Related entities & filings
Owner contacts
Email · phone · related entities
Sales History
1 recorded event · public records
Date
Price
Buyer
Seller
Deed Type
Mortgage
Aug 17, 2006
$230,000
Lansdale Properties Group
Montgomery Cnty Indl Dev Auth
Grant Deed
—
Coming soon
Costs & Benchmarks
Operating expenses, capex projections, utility benchmarks, and submarket comparables — all in one view.
Coming soon
Risks
Flood, climate, environmental, title, and tenant-concentration risk — surfaced with mitigations and source citations.
Try Rey
Ask anything about this address in plain English.
“Is 15.6% cap rate sustainable?” · “Best tenant mix for BU1?” · “What’s the redev upside?”
Full reports are paid
Unlock the full Property Analytics report
Start free for 7 days — no card required. Full owner contacts, all 4 valuations with methodology, refine flow, comparable adjustments, foot-traffic deep dive, export to PDF / CSV.


