
New search
Property profile & analytics
OFF-MARKET
Estimated value
$4,200,000
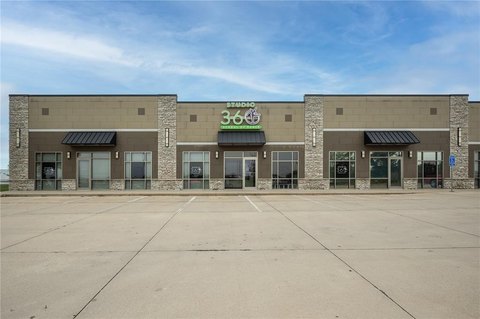
Strip malls
3005 Wiley SW Blvd, Cedar Rapids, IA 52404-3178
Entity Owned
4-yr Hold
~
Est. High Equity
Property ID
US25-2479170
Property profile
Verified
Property type
Strip malls
Use group
SHOPPING CENTER, STRIP CENTER
Year built
2002
Total area
37,600 SF
Lot
4.24 ac (184,694 SF)
APN
20011-01004-00000
UPID
US25-2479170
Cap rate & NOI
Priority signal for investors
Implied cap rate, NOI & suggested price
Cap rate vs submarket · NOI estimate · 3 price anchors
Implied cap rate, NOI & suggested price
Cap vs submarket · NOI estimate · 3 price anchors
Current use
Occupant on record · Public records
-
China King Restaurant
-
Laundromat (Bike/Boat/Book/etc) Store
-
America's Best Contacts & Eyeglasses Physician
-
Metro by T-Mobile Telecommunications Service
-
GameStop Arcade & Gaming Center Electronics & Wireless Store
Value estimations
Realmo proprietary · 4 methods
AI Approach
AI
$3.89M
CAP Approach
CAP
$5.86M
Comparable Approach
Comparable
by Request
Blend (final)
Blend
$4.20M
Owner & transaction history
Pool 6 Properties LLC · 4 yrs held
Pool 6 Properties LLC
since 2021
Last sale
$4.5M
6 recorded transactions
Zoning & alternative use
Permitted uses
Permitted uses
Allowed · conditional · prohibited
Top alternative use upside
Restaurant
$5.9M
+92.9%
Auto repair, garage
$4.0M
+30.2%
Medical building
$3.8M
+21.9%
Cap rate
Implied · in-place · derived from last sale + estimated NOI
Implied Cap rate
#1
Implied · in-place · NOI ÷ last sale
In-place · derived from last sale + estimated NOI
Cap rate, NOI & submarket benchmark
Implied cap rate vs Cedar Rapids submarket · NOI estimate · Typical band, median & reading
Implied cap rate, NOI & submarket benchmark
Cap vs Cedar Rapids submarket · NOI estimate · typical band, median & reading
Refine your cap rate
8-question underwriting flow
1.
Property current status — Going-In vs Stabilized
2.
Price for denominator — asking / offer / market
3.
Leasing status & lease structure (NNN / Gross)
4.
Tenant risk profile & vacancy assumption
5.
Upload T12 / rent roll / OM (optional)
Refine in 60 seconds, get exact suggested price
T12 upload · Submarket benchmarks · Sensitivity grid
Suggested price · 3 cap rate anchors
Income approach @ 5% / 7% / 9% — aggressive / typical / conservative
Suggested price at 5% / 7% / 9% cap
Aggressive / typical / conservative · Implied $/SF per anchor · Sensitivity grid
Suggested price at 5% / 7% / 9% cap
Aggressive / typical / conservative · implied $/SF · sensitivity
Value
AI, CAP & Alternative Use estimations · Realmo proprietary blendValue Estimations
Based on Realmo’s proprietary methodology
AI Approach
Method
Estimation
Statistic approach
$3,960,000
ML approach
$3,885,000
CAP Approach
CAP Return
Estimation
6%
$6,350,000
6.5%
$5,860,000
7%
$5,440,000
Alternative Use
Use
Estimation
NEIGHBORHOOD: SHOPPING CENTER
$3,080,000
Current use
RESTAURANT
$5,945,000
Change: +93% · Conversion: Difficult
AUTO REPAIR, GARAGE
$4,010,000
Change: +30% · Conversion: Difficult
MEDICAL BUILDING
$3,755,000
Change: +22% · Conversion: Difficult
RETAIL STORES
$3,095,000
Change: +0% · Conversion: Easy
OFFICE BUILDING
$2,935,000
Change: -5% · Conversion: Moderate
Blend value · Realmo final
$4.20M
Range $3.78M – $4.62M · ±10% · vs last sale $4.48M (Jul 20 2021)
Last sale anchor
$4.48M
Jul 20 2021
Realmo estimate · informational only.
These numbers are calculated by our models from public records and may not reflect actual market value.
Not an appraisal.
Verify with a licensed appraiser before transacting. Realmo accepts no liability for divergence from real-world outcomes.
View the full estimation — every method, every assumption
Confidence drivers & risk notes · Custom comparable set · Free for first 3 / day
Full estimation methodology
Every method · every assumption · confidence drivers
Price per SF
Sale + rent benchmarks
Subject property
$112 / SF
Submarket sale & rent benchmarks
Median sale $/SF · Asking & closed rent · Submarket vacancy
Submarket sale & rent benchmarks
Median sale $/SF · asking & closed rent · submarket vacancy
Property tax & assessments
Tax year 2022Property tax & assessments
Tax year 2022
Tax billed
$129,782
Tax year 2022
Assessed value
$3,886,800
Assessed 2023
Previous assessed
$3,886,800
+0.0% YoY
Effective rate
3.34%
On assessed value
Assessed land
$918,000
Assessed improvement
$2,968,800
Land market value
$918,000
Improvement market value
$2,968,800
Total market value
$3,886,800
Comparables
6 recent transactions · within 1.5 miComparable in this city
6 recent transactions
Comparable in this City


Similar Nearby for Sale


Similar Nearby for Lease


Recent comparable sales
Sale price & price/SF · Sale date & distance · Adjustments & confidence
Recent comparable sales
Sale price & $/SF · sale date & distance · adjustments
Property description
Physical attributes from public recordsBuilding & lot
Public records
Property type
Strip malls
Use group
SHOPPING CENTER, STRIP CENTER
Status
Off-Market
Year built
2002
Heating
NONE
Stories
1
Total area
37,600 SF
Lot
4.24 ac (184,694 SF)
APN
20011-01004-00000
UPID
US25-2479170
Jurisdiction
LINN
Zoning & alternative use
Zoning · permitted uses
Permitted & conditional uses
Allowed uses · Special-permit conditions · Prohibited uses
Permitted & conditional uses
Allowed · special-permit conditions · prohibited
Alternative use value scenarios
Repositioning upside vs current use
NEIGHBORHOOD: SHOPPING CENTER Current
Est. value
$3.1M
RESTAURANT
Est. value
$5.9M
AUTO REPAIR, GARAGE
Est. value
$4.0M
MEDICAL BUILDING
Est. value
$3.8M
RETAIL STORES
Est. value
$3.1M
OFFICE BUILDING
Est. value
$2.9M
NEIGHBORHOOD: SHOPPING CENTER Current
RESTAURANT
AUTO REPAIR, GARAGE
MEDICAL BUILDING
RETAIL STORES
OFFICE BUILDING
Alternative use deep dive — conversion cost, permits, timeline
Conversion cost estimate · Permit path & risks · Stabilized NOI per option
Alternative use deep dive
Conversion cost · permit path · stabilized NOI per option
Building & site characteristics
From public records
Year built
2002
Heating
NONE
Stories
1
Lot
4.24 ac
Current owner
From public records · entity-resolved
Pool 6 Properties LLC
Entity
Mailing address
7777 BONHOMME AVE STE #1700, SAINT LOUIS, MO 63105-1984
Ownership since
2021
Owner contacts — direct phone, email, and related entities
Decision-maker phone · Verified email · Related entities & filings
Owner contacts
Email · phone · related entities
Sales History
6 recorded events · public records
Date
Price
Buyer
Seller
Deed Type
Mortgage
Feb 11, 2026
—
Pool 6 Properties LLC
—
Deed
related
$62,000,000 · Blackrock Global Cre Debt C8 Reit LLC
Jul 12, 2023
—
Pool 6 Properties LLC
—
Deed
related
$7,875,000 · First Bankers Trust Co NA
Jul 20, 2021
$4,479,000
Pool 6 Properties LLC
Sfp Pool Six LLC
Special Warranty Deed
$37,420,000 · Bsp Of Finance LLC
Jul 24, 2014
—
Sfp Pool Six LLC
Coldwater Liquidating Trust
Trustees Deed
related
$34,000,000 · Privatebank & Tr
Oct 21, 2013
—
Coldwater,liquidating Trust
Coldwater Portfolio Ptrs LLC
Quit Claim Deed
related
—
Mar 14, 2006
$5,749,500
Coldwater Portfolio Partners LLC
Cedar Rapids Iowa Associates LLC
Special Warranty Deed
$73,440,000 · Greenwich Capital Financial Product
Coming soon
Costs & Benchmarks
Operating expenses, capex projections, utility benchmarks, and submarket comparables — all in one view.
Coming soon
Risks
Flood, climate, environmental, title, and tenant-concentration risk — surfaced with mitigations and source citations.
Try Rey
Ask anything about this address in plain English.
“Is 15.6% cap rate sustainable?” · “Best tenant mix for BU1?” · “What’s the redev upside?”
You own 3005 Wiley SW Blvd?
List it free. Reach 20,000 daily buyers.
We’ve already pulled the facts. Confirm photos + price and you’re live in 2 minutes.
List this address →
Full reports are paid
Unlock the full Property Analytics report
Start free for 7 days — no card required. Full owner contacts, all 4 valuations with methodology, refine flow, comparable adjustments, foot-traffic deep dive, export to PDF / CSV.


