
New search
Property profile & analytics
OFF-MARKET
Estimated value
$625,000
Super regional malls
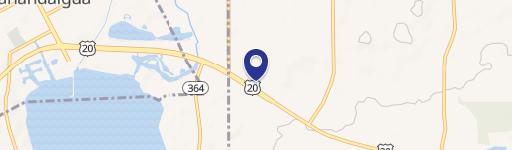
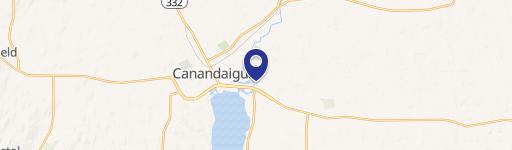
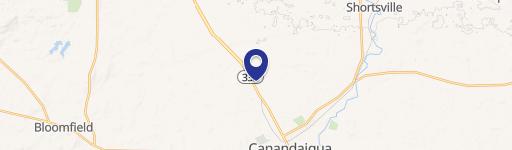
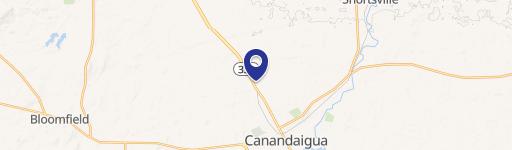
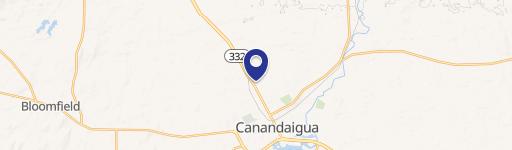
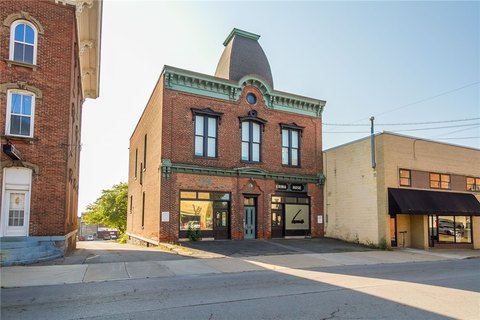
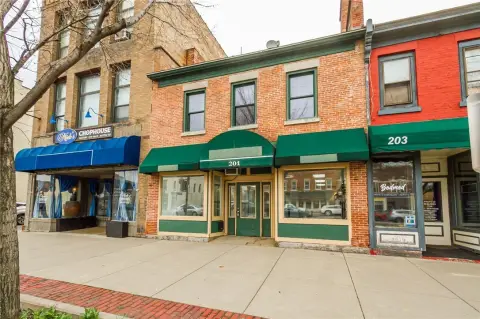
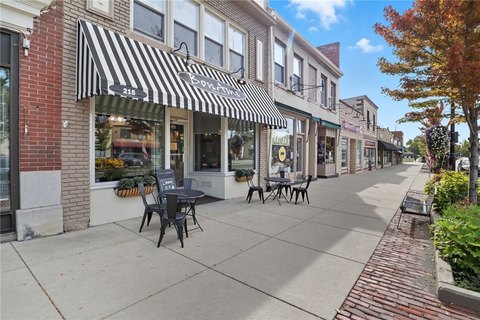
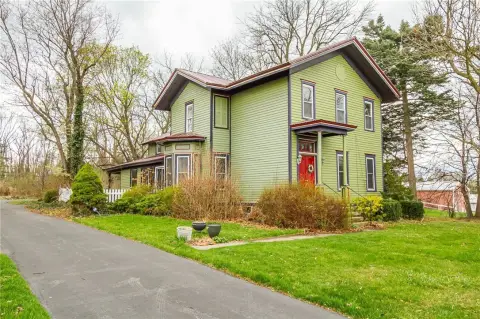
300 Eastern Blvd, Canandaigua, NY 14424
Entity Owned
6-yr Hold
Absentee Owner
Free & Clear
Property ID
US63-0224770
Property profile
Verified
Property type
Super regional malls
Use group
REGIONAL SHOPPING CENTER, MALL
Year built
1985
Total area
84,381 SF
Lot
7.5 ac (326,700 SF)
Zoning code
C3
APN
320200 84.19-1-6.2
UPID
US63-0224770
Cap rate & NOI
Priority signal for investors
Implied cap rate, NOI & suggested price
Cap rate vs submarket · NOI estimate · 3 price anchors
Implied cap rate, NOI & suggested price
Cap vs submarket · NOI estimate · 3 price anchors
Value estimations
Realmo proprietary · 4 methods
AI Approach
AI
$425k
CAP Approach
CAP
by Request
Comparable Approach
Comparable
$825k
Blend (final)
Blend
$625k
Owner & transaction history
300 Eastern Blvd LLC · 6 yrs held
300 Eastern Blvd LLC
since 2020
4 recorded transactions
Zoning & alternative use
C3 · Canandaigua, NY
Permitted uses
Permitted uses
Allowed · conditional · prohibited
Cap rate
Implied · in-place · derived from last sale + estimated NOI
Implied Cap rate
#1
Implied · in-place · NOI ÷ last sale
In-place · derived from last sale + estimated NOI
Cap rate, NOI & submarket benchmark
Implied cap rate vs Canandaigua submarket · NOI estimate · Typical band, median & reading
Implied cap rate, NOI & submarket benchmark
Cap vs Canandaigua submarket · NOI estimate · typical band, median & reading
Refine your cap rate
8-question underwriting flow
1.
Property current status — Going-In vs Stabilized
2.
Price for denominator — asking / offer / market
3.
Leasing status & lease structure (NNN / Gross)
4.
Tenant risk profile & vacancy assumption
5.
Upload T12 / rent roll / OM (optional)
Refine in 60 seconds, get exact suggested price
T12 upload · Submarket benchmarks · Sensitivity grid
Suggested price · 3 cap rate anchors
Income approach @ 5% / 7% / 9% — aggressive / typical / conservative
Suggested price at 5% / 7% / 9% cap
Aggressive / typical / conservative · Implied $/SF per anchor · Sensitivity grid
Suggested price at 5% / 7% / 9% cap
Aggressive / typical / conservative · implied $/SF · sensitivity
Value
AI, CAP & Alternative Use estimations · Realmo proprietary blendValue Estimations
Based on Realmo’s proprietary methodology
AI Approach
Method
Estimation
Statistic approach
by Request
ML approach
$425,000
CAP Approach
CAP Return
Estimation
6%
by Request
6.5%
by Request
7%
by Request
Alternative Use
Use
Estimation
NEIGHBORHOOD: SHOPPING CENTER
$920,000
Current use
Blend value · Realmo final
$625k
Range $563k – $688k · ±10%
Realmo estimate · informational only.
These numbers are calculated by our models from public records and may not reflect actual market value.
Not an appraisal.
Verify with a licensed appraiser before transacting. Realmo accepts no liability for divergence from real-world outcomes.
View the full estimation — every method, every assumption
Confidence drivers & risk notes · Custom comparable set · Free for first 3 / day
Full estimation methodology
Every method · every assumption · confidence drivers
Price per SF
Sale + rent benchmarks
Subject property
$7 / SF
Submarket sale & rent benchmarks
Median sale $/SF · Asking & closed rent · Submarket vacancy
Submarket sale & rent benchmarks
Median sale $/SF · asking & closed rent · submarket vacancy
Property tax & assessments
Property tax & assessments
Assessed value
$4,600,000
Assessed 2023
Previous assessed
$5,503,400
-16.4% YoY
Assessed land
$2,025,000
Assessed improvement
$2,575,000
Land market value
$2,301,136
Improvement market value
$2,926,137
Total market value
$5,227,273
Applied tax rate
320,200.0000
Comparables
6 recent transactions · within 1.5 miComparable in this city
6 recent transactions
Comparable in this City

Similar Nearby for Sale


Similar Nearby for Lease


Recent comparable sales
Sale price & price/SF · Sale date & distance · Adjustments & confidence
Recent comparable sales
Sale price & $/SF · sale date & distance · adjustments
Property description
Physical attributes from public recordsBuilding & lot
Public records
Property type
Super regional malls
Use group
REGIONAL SHOPPING CENTER, MALL
Status
Off-Market
Year built
1985
Heating
NONE
Cooling
CENTRAL
Stories
1
Total area
84,381 SF
Lot
7.5 ac (326,700 SF)
Zoning code
C3
APN
320200 84.19-1-6.2
UPID
US63-0224770
Jurisdiction
ONTARIO
Zoning & alternative use
C3 · Canandaigua, NY
Zoning C3 · permitted uses
C3 · Canandaigua, NY
Permitted & conditional uses
Allowed uses · Special-permit conditions · Prohibited uses
Permitted & conditional uses
Allowed · special-permit conditions · prohibited
Canandaigua. Always verify with local authorities before improvements.
Alternative use value scenarios
Repositioning upside vs current use
NEIGHBORHOOD: SHOPPING CENTER Current
Est. value
$920,000
NEIGHBORHOOD: SHOPPING CENTER Current
Alternative use deep dive — conversion cost, permits, timeline
Conversion cost estimate · Permit path & risks · Stabilized NOI per option
Alternative use deep dive
Conversion cost · permit path · stabilized NOI per option
Building & site characteristics
From public records
Year built
1985
Heating
NONE
Cooling
Yes
Stories
1
Lot
7.5 ac
Current owner
From public records · entity-resolved
300 Eastern Blvd LLC
Entity
Free & Clear · 6 yrs held
Mailing address
400 ANDREWS ST STE #500, ROCHESTER, NY 14604-1461
Mailing matches property
Different — outreach signal
Owner-occupied
No
Ownership since
2020
Owner contacts — direct phone, email, and related entities
Decision-maker phone · Verified email · Related entities & filings
Owner contacts
Email · phone · related entities
Sales History
4 recorded events · public records
Date
Price
Buyer
Seller
Deed Type
Mortgage
Apr 24, 2020
$900,000
300 Eastern Blvd LLC
Cor Eastern Boulevard Co
Deed
—
Feb 7, 2020
—
Grandview Apartments 2
—
Deed
related
$5,000,000 · Five Star Bank
Nov 19, 2019
$5,150,000
Grandview Apartments 2
Cor Eastern Boulevard Co
Deed
—
Jun 26, 2006
$4,200,000
Cor Eastern Blvd Co. LLC
Wegmans Food Markets INC
Deed
—
Coming soon
Costs & Benchmarks
Operating expenses, capex projections, utility benchmarks, and submarket comparables — all in one view.
Coming soon
Risks
Flood, climate, environmental, title, and tenant-concentration risk — surfaced with mitigations and source citations.
Try Rey
Ask anything about this address in plain English.
“Is 15.6% cap rate sustainable?” · “Best tenant mix for BU1?” · “What’s the redev upside?”
You own 300 Eastern Blvd?
List it free. Reach 20,000 daily buyers.
We’ve already pulled the facts. Confirm photos + price and you’re live in 2 minutes.
List this address →
Full reports are paid
Unlock the full Property Analytics report
Start free for 7 days — no card required. Full owner contacts, all 4 valuations with methodology, refine flow, comparable adjustments, foot-traffic deep dive, export to PDF / CSV.


