
New search
Property profile & analytics
OFF-MARKET
Estimated value
$1,440,000
Showrooms
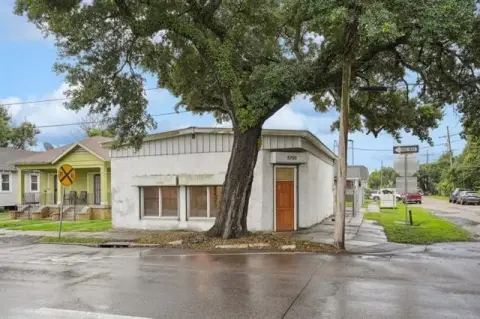
2800 Johnson St, New Orleans, LA 70117-6916
Entity Owned
1-yr Hold
~
Est. High Equity
Property ID
US36-2589999
Property profile
Verified
Property type
Showrooms
Use group
SHOW ROOM, WAREHOUSE
Year built
1900
Total area
39,244 SF
Lot
1.1 ac (48,100 SF)
APN
39W500219
UPID
US36-2589999
Cap rate & NOI
Priority signal for investors
Implied cap rate, NOI & suggested price
Cap rate vs submarket · NOI estimate · 3 price anchors
Implied cap rate, NOI & suggested price
Cap vs submarket · NOI estimate · 3 price anchors
Current use
Occupant on record · Public records
-
International Materials Industries, LLC Building Supply Industrial Manufacturer
Value estimations
Realmo proprietary · 4 methods
AI Approach
AI
by Request
CAP Approach
CAP
by Request
Comparable Approach
Comparable
$1.91M
Blend (final)
Blend
$1.44M
Owner & transaction history
2800 North Johnson LLC · 1 yrs held
2800 North Johnson LLC
since 2024
Last sale
$2.0M
7 recorded transactions
Zoning & alternative use
Permitted uses
Permitted uses
Allowed · conditional · prohibited
Cap rate
Implied · in-place · derived from last sale + estimated NOI
Implied Cap rate
#1
Implied · in-place · NOI ÷ last sale
In-place · derived from last sale + estimated NOI
Cap rate, NOI & submarket benchmark
Implied cap rate vs New Orleans submarket · NOI estimate · Typical band, median & reading
Implied cap rate, NOI & submarket benchmark
Cap vs New Orleans submarket · NOI estimate · typical band, median & reading
Refine your cap rate
8-question underwriting flow
1.
Property current status — Going-In vs Stabilized
2.
Price for denominator — asking / offer / market
3.
Leasing status & lease structure (NNN / Gross)
4.
Tenant risk profile & vacancy assumption
5.
Upload T12 / rent roll / OM (optional)
Refine in 60 seconds, get exact suggested price
T12 upload · Submarket benchmarks · Sensitivity grid
Suggested price · 3 cap rate anchors
Income approach @ 5% / 7% / 9% — aggressive / typical / conservative
Suggested price at 5% / 7% / 9% cap
Aggressive / typical / conservative · Implied $/SF per anchor · Sensitivity grid
Suggested price at 5% / 7% / 9% cap
Aggressive / typical / conservative · implied $/SF · sensitivity
Value
AI, CAP & Alternative Use estimations · Realmo proprietary blendValue Estimations
Based on Realmo’s proprietary methodology
AI Approach
Method
Estimation
Statistic approach
by Request
ML approach
by Request
CAP Approach
CAP Return
Estimation
6%
by Request
6.5%
by Request
7%
by Request
Blend value · Realmo final
$1.44M
Range $1.30M – $1.58M · ±10% · vs last sale $2.00M (Jul 17 2024)
Last sale anchor
$2.00M
Jul 17 2024
Realmo estimate · informational only.
These numbers are calculated by our models from public records and may not reflect actual market value.
Not an appraisal.
Verify with a licensed appraiser before transacting. Realmo accepts no liability for divergence from real-world outcomes.
View the full estimation — every method, every assumption
Confidence drivers & risk notes · Custom comparable set · Free for first 3 / day
Full estimation methodology
Every method · every assumption · confidence drivers
Price per SF
Sale + rent benchmarks
Subject property
$37 / SF
Submarket sale & rent benchmarks
Median sale $/SF · Asking & closed rent · Submarket vacancy
Submarket sale & rent benchmarks
Median sale $/SF · asking & closed rent · submarket vacancy
Property tax & assessments
Property tax & assessments
Assessed value
$158,990
Assessed 2023
Previous assessed
$95,930
+65.7% YoY
Assessed land
$12,030
Assessed improvement
$146,960
Land market value
$120,300
Improvement market value
$979,700
Total market value
$1,100,000
Applied tax rate
3.0000
Comparables
6 recent transactions · within 1.5 miComparable in this city
6 recent transactions
Comparable in this City


Similar Nearby for Sale


Similar Nearby for Lease


Recent comparable sales
Sale price & price/SF · Sale date & distance · Adjustments & confidence
Recent comparable sales
Sale price & $/SF · sale date & distance · adjustments
Property description
Physical attributes from public recordsBuilding & lot
Public records
Property type
Showrooms
Use group
SHOW ROOM, WAREHOUSE
Status
Off-Market
Year built
1900
Heating
NONE
Total area
39,244 SF
Lot
1.1 ac (48,100 SF)
APN
39W500219
UPID
US36-2589999
Jurisdiction
ORLEANS
Zoning & alternative use
Zoning · permitted uses
Permitted & conditional uses
Allowed uses · Special-permit conditions · Prohibited uses
Permitted & conditional uses
Allowed · special-permit conditions · prohibited
Building & site characteristics
From public records
Year built
1900
Heating
NONE
Lot
1.1 ac
Current owner
From public records · entity-resolved
2800 North Johnson LLC
Entity
Mailing address
2272 S HICKORY ST, FOLEY, AL 36535-3468
Ownership since
2024
Owner contacts — direct phone, email, and related entities
Decision-maker phone · Verified email · Related entities & filings
Owner contacts
Email · phone · related entities
Sales History
8 recorded events · public records
Date
Price
Buyer
Seller
Deed Type
Mortgage
Apr 17, 2026
—
2800 North Johnson LLC
—
Deed
related
$3,700,000
Oct 17, 2024
$2,000,000
2800 North Johnson LLC
Tin Man Properties LLC
Warranty Deed
$1,400,000 · Velocity Commercial Capital LLC
Oct 4, 2022
—
Tin Man Properties LLC Of Alabama
—
Deed
related
$1,400,000 · Synovous Bank
Jun 30, 2022
$1,100,000
Tin Man Properties LLC Of Alabama
International Material Industries L
Deed
$900,000 · Synovous Bank
Sep 2, 2020
—
International Material Industr
—
Deed
related
$400,000 · Robert E Allende
Sep 1, 2017
—
International Material Industr
—
Grant Deed
related
$1,180,000 · Business First Bk
Sep 14, 2007
$330,000
International Material Industr
Advance Polybag INC
Grant Deed
—
—
—
International Material Industr
—
Deed Of Trust
related
$400,000 · Robert E Allende
Coming soon
Costs & Benchmarks
Operating expenses, capex projections, utility benchmarks, and submarket comparables — all in one view.
Coming soon
Risks
Flood, climate, environmental, title, and tenant-concentration risk — surfaced with mitigations and source citations.
Try Rey
Ask anything about this address in plain English.
“Is 15.6% cap rate sustainable?” · “Best tenant mix for BU1?” · “What’s the redev upside?”
You own 2800 Johnson St?
List it free. Reach 20,000 daily buyers.
We’ve already pulled the facts. Confirm photos + price and you’re live in 2 minutes.
List this address →
Full reports are paid
Unlock the full Property Analytics report
Start free for 7 days — no card required. Full owner contacts, all 4 valuations with methodology, refine flow, comparable adjustments, foot-traffic deep dive, export to PDF / CSV.


