
New search
Property profile & analytics
FOR LEASE
Office buildings
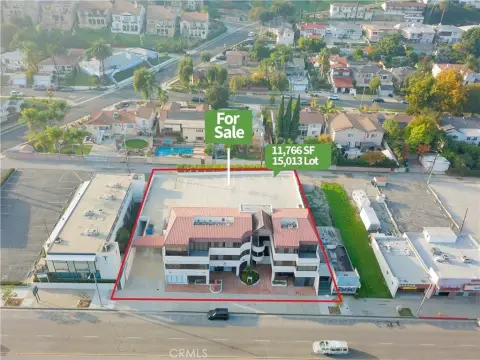
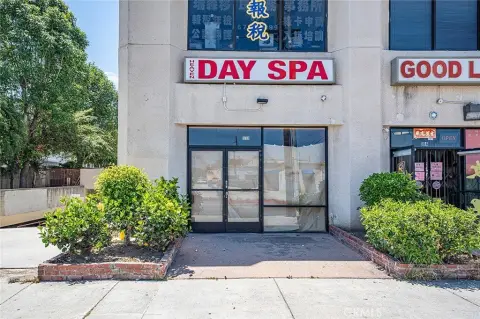
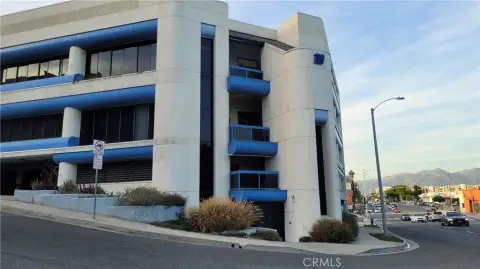
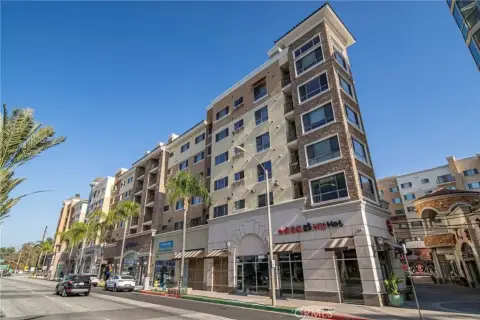
2525 Corporate Pl, Monterey Park, CA 91754
Entity Owned
2-yr Hold
Absentee Owner
Free & Clear
Property ID
US09-8546915
 For Lease
1 / 2
For Lease
1 / 2
$16,765,000
2525 Corporate Pl, Monterey Park, CA 91754
View Listing →
Property profile
Verified
Property type
Office buildings
Use group
OFFICE BUILDING (MULTI-STORY)
Year built
1986
Construction
TILT-UP CONCRETE
Total area
79,203 SF
Lot
4.53 ac (197,381 SF)
Zoning code
MPC2*
APN
5237-024-026
UPID
US09-8546915
Cap rate & NOI
Priority signal for investors
Implied cap rate, NOI & suggested price
Cap rate vs submarket · NOI estimate · 3 price anchors
Implied cap rate, NOI & suggested price
Cap vs submarket · NOI estimate · 3 price anchors
Current use
Occupant on record · Public records
-
Department of Children and Family Services Social Service Agency Charitable Organization
-
LARICS Association / Organization
Value estimations
Realmo proprietary · 4 methods
AI Approach
AI
$10.54M
CAP Approach
CAP
by Request
Comparable Approach
Comparable
$18.10M
Blend (final)
Blend
$16.77M
Owner & transaction history
2000 Gold Limited Partnership · 2 yrs held
2000 Gold Limited Partnership
since 2023
Last sale
$16.6M
2 recorded transactions
Zoning & alternative use
MPC2* · Monterey Park, CA
Permitted uses
Permitted uses
Allowed · conditional · prohibited
Cap rate
Implied · in-place · derived from last sale + estimated NOI
Implied Cap rate
#1
Implied · in-place · NOI ÷ last sale
In-place · derived from last sale + estimated NOI
Cap rate, NOI & submarket benchmark
Implied cap rate vs Monterey Park submarket · NOI estimate · Typical band, median & reading
Implied cap rate, NOI & submarket benchmark
Cap vs Monterey Park submarket · NOI estimate · typical band, median & reading
Refine your cap rate
8-question underwriting flow
1.
Property current status — Going-In vs Stabilized
2.
Price for denominator — asking / offer / market
3.
Leasing status & lease structure (NNN / Gross)
4.
Tenant risk profile & vacancy assumption
5.
Upload T12 / rent roll / OM (optional)
Refine in 60 seconds, get exact suggested price
T12 upload · Submarket benchmarks · Sensitivity grid
Suggested price · 3 cap rate anchors
Income approach @ 5% / 7% / 9% — aggressive / typical / conservative
Suggested price at 5% / 7% / 9% cap
Aggressive / typical / conservative · Implied $/SF per anchor · Sensitivity grid
Suggested price at 5% / 7% / 9% cap
Aggressive / typical / conservative · implied $/SF · sensitivity
Value
AI, CAP & Alternative Use estimations · Realmo proprietary blendValue Estimations
Based on Realmo’s proprietary methodology
AI Approach
Method
Estimation
Statistic approach
$15,765,000
ML approach
$10,535,000
CAP Approach
CAP Return
Estimation
6%
by Request
6.5%
by Request
7%
by Request
Blend value · Realmo final
$16.77M
Range $15.09M – $18.44M · ±10% · vs last sale $16.60M (Dec 29 2023)
Last sale anchor
$16.60M
Dec 29 2023
Realmo estimate · informational only.
These numbers are calculated by our models from public records and may not reflect actual market value.
Not an appraisal.
Verify with a licensed appraiser before transacting. Realmo accepts no liability for divergence from real-world outcomes.
View the full estimation — every method, every assumption
Confidence drivers & risk notes · Custom comparable set · Free for first 3 / day
Full estimation methodology
Every method · every assumption · confidence drivers
Price per SF
Sale + rent benchmarks
Subject property
$212 / SF
Submarket sale & rent benchmarks
Median sale $/SF · Asking & closed rent · Submarket vacancy
Submarket sale & rent benchmarks
Median sale $/SF · asking & closed rent · submarket vacancy
Property tax & assessments
Tax year 2024Property tax & assessments
Tax year 2024
Tax billed
$157,971
Tax year 2024
Assessed value
$10,374,913
Assessed 2024
Previous assessed
$10,374,913
+0.0% YoY
Effective rate
1.52%
On assessed value
Assessed land
$6,514,863
Assessed improvement
$3,860,050
Comparables
6 recent transactions · within 1.5 miComparable in this city
6 recent transactions
Comparable in this City

Similar Nearby for Sale


Similar Nearby for Lease


Recent comparable sales
Sale price & price/SF · Sale date & distance · Adjustments & confidence
Recent comparable sales
Sale price & $/SF · sale date & distance · adjustments
Property description
Physical attributes from public recordsBuilding & lot
Public records
Property type
Office buildings
Use group
OFFICE BUILDING (MULTI-STORY)
Status
For Lease
Year built
1986
Construction
TILT-UP CONCRETE
Heating
NONE
Stories
2
Total area
79,203 SF
Lot
4.53 ac (197,381 SF)
Zoning code
MPC2*
APN
5237-024-026
UPID
US09-8546915
Jurisdiction
LOS ANGELES
Metro division
LOS ANGELES-LONG BEACH-GLENDALE, CA METROPOLITAN DIVISION
Zoning & alternative use
MPC2* · Monterey Park, CA
Zoning MPC2* · permitted uses
MPC2* · Monterey Park, CA
Permitted & conditional uses
Allowed uses · Special-permit conditions · Prohibited uses
Permitted & conditional uses
Allowed · special-permit conditions · prohibited
Monterey Park. Always verify with local authorities before improvements.
Building & site characteristics
From public records
Year built
1986
Construction
TILT-UP CONCRETE
Heating
NONE
Stories
2
Lot
4.53 ac
Current owner
From public records · entity-resolved
2000 Gold Limited Partnership
Entity
Free & Clear · 2 yrs held
Mailing address
2530 CORPORATE PL STE A210, MONTEREY PARK, CA 91754-7628
Mailing matches property
Different — outreach signal
Owner-occupied
No
Ownership since
2023
Owner contacts — direct phone, email, and related entities
Decision-maker phone · Verified email · Related entities & filings
Owner contacts
Email · phone · related entities
Sales History
2 recorded events · public records
Date
Price
Buyer
Seller
Deed Type
Mortgage
Dec 29, 2023
$16,600,000
2000 Gold Limited Partnership
Eastgroup Properties LP
Grant Deed
—
Jul 31, 1998
—
East Group Properties L P
—
Deed Of Trust
related
—
Coming soon
Costs & Benchmarks
Operating expenses, capex projections, utility benchmarks, and submarket comparables — all in one view.
Coming soon
Risks
Flood, climate, environmental, title, and tenant-concentration risk — surfaced with mitigations and source citations.
Try Rey
Ask anything about this address in plain English.
“Is 15.6% cap rate sustainable?” · “Best tenant mix for BU1?” · “What’s the redev upside?”
Full reports are paid
Unlock the full Property Analytics report
Start free for 7 days — no card required. Full owner contacts, all 4 valuations with methodology, refine flow, comparable adjustments, foot-traffic deep dive, export to PDF / CSV.


