
New search
Property profile & analytics
FOR SALE
Drive through restaurants
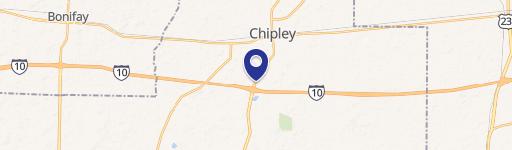
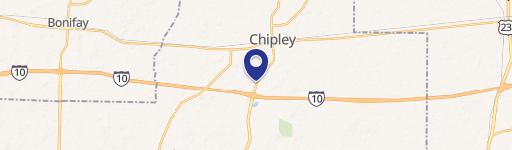
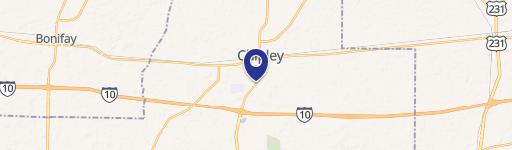
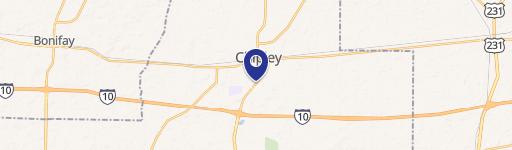
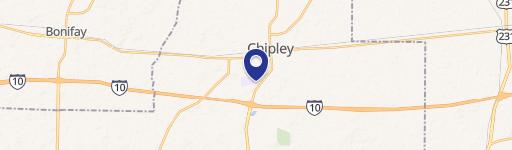
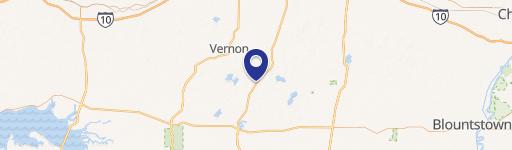
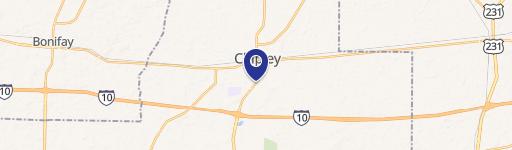
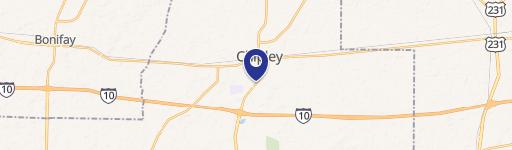
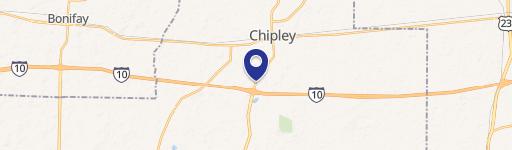
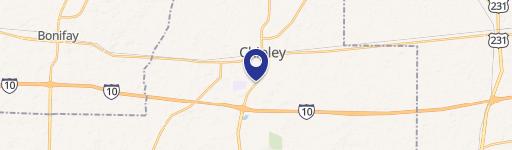
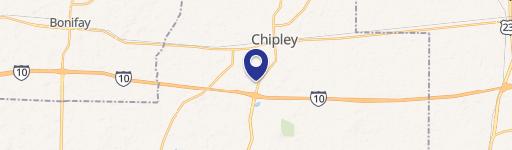
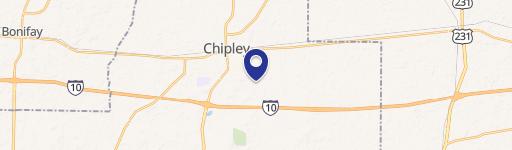
1698 Main St, Chipley, FL 32428
Entity Owned
Free & Clear
Property ID
US18-3623958
 For Sale
1 / 4
For Sale
1 / 4
$4,204,000
1698 Main St, Chipley, FL 32428
View Listing →
Property profile
Verified
Property type
Drive through restaurants
Use group
DRIVE-THRU RESTAURANT, FAST FOOD
Year built
1995
Total area
6,681 SF
Lot
2.33 ac (101,582 SF)
APN
23410005
UPID
US18-3623958
Cap rate & NOI
Priority signal for investors
Implied cap rate, NOI & suggested price
Cap rate vs submarket · NOI estimate · 3 price anchors
Implied cap rate, NOI & suggested price
Cap vs submarket · NOI estimate · 3 price anchors
Value estimations
Realmo proprietary · 4 methods
AI Approach
AI
$2.42M
CAP Approach
CAP
by Request
Comparable Approach
Comparable
by Request
Blend (final)
Blend
$2.57M
Owner & transaction history
Help Care Center V Corp
Help Care Center V Corp
since 2025
Last sale
$3.5M
7 recorded transactions
Zoning & alternative use
Permitted uses
Permitted uses
Allowed · conditional · prohibited
Cap rate
Implied · in-place · derived from last sale + estimated NOI
Implied Cap rate
#1
Implied · in-place · NOI ÷ last sale
In-place · derived from last sale + estimated NOI
Cap rate, NOI & submarket benchmark
Implied cap rate vs Chipley submarket · NOI estimate · Typical band, median & reading
Implied cap rate, NOI & submarket benchmark
Cap vs Chipley submarket · NOI estimate · typical band, median & reading
Refine your cap rate
8-question underwriting flow
1.
Property current status — Going-In vs Stabilized
2.
Price for denominator — asking / offer / market
3.
Leasing status & lease structure (NNN / Gross)
4.
Tenant risk profile & vacancy assumption
5.
Upload T12 / rent roll / OM (optional)
Refine in 60 seconds, get exact suggested price
T12 upload · Submarket benchmarks · Sensitivity grid
Suggested price · 3 cap rate anchors
Income approach @ 5% / 7% / 9% — aggressive / typical / conservative
Suggested price at 5% / 7% / 9% cap
Aggressive / typical / conservative · Implied $/SF per anchor · Sensitivity grid
Suggested price at 5% / 7% / 9% cap
Aggressive / typical / conservative · implied $/SF · sensitivity
Value
AI, CAP & Alternative Use estimations · Realmo proprietary blendValue Estimations
Based on Realmo’s proprietary methodology
AI Approach
Method
Estimation
Statistic approach
$2,400,000
ML approach
$2,415,000
CAP Approach
CAP Return
Estimation
6%
by Request
6.5%
by Request
7%
by Request
Blend value · Realmo final
$2.57M
Range $2.31M – $2.82M · ±10% · vs last sale $3.46M (Dec 31 2025)
Last sale anchor
$3.46M
Dec 31 2025
Realmo estimate · informational only.
These numbers are calculated by our models from public records and may not reflect actual market value.
Not an appraisal.
Verify with a licensed appraiser before transacting. Realmo accepts no liability for divergence from real-world outcomes.
View the full estimation — every method, every assumption
Confidence drivers & risk notes · Custom comparable set · Free for first 3 / day
Full estimation methodology
Every method · every assumption · confidence drivers
Price per SF
Sale + rent benchmarks
Subject property
$384 / SF
Submarket sale & rent benchmarks
Median sale $/SF · Asking & closed rent · Submarket vacancy
Submarket sale & rent benchmarks
Median sale $/SF · asking & closed rent · submarket vacancy
Property tax & assessments
Tax year 2023Property tax & assessments
Tax year 2023
Tax billed
$24,797
Tax year 2023
Assessed value
$1,200,791
Assessed 2023
Previous assessed
$1,200,791
+0.0% YoY
Effective rate
2.07%
On assessed value
Assessed land
$319,819
Assessed improvement
$880,972
Land market value
$319,819
Improvement market value
$880,972
Total market value
$1,200,791
Applied tax rate
2.0000
Comparables
6 recent transactions · within 1.5 miComparable in this city
6 recent transactions
Comparable in this City

Similar Nearby for Sale

Similar Nearby for Lease
Recent comparable sales
Sale price & price/SF · Sale date & distance · Adjustments & confidence
Recent comparable sales
Sale price & $/SF · sale date & distance · adjustments
Property description
Physical attributes from public recordsBuilding & lot
Public records
Property type
Drive through restaurants
Use group
DRIVE-THRU RESTAURANT, FAST FOOD
Status
For Sale
Year built
1995
Heating
FORCED AIR
Cooling
CENTRAL
Buildings
1
Total area
6,681 SF
Lot
2.33 ac (101,582 SF)
APN
23410005
UPID
US18-3623958
Jurisdiction
WASHINGTON
Zoning & alternative use
Zoning · permitted uses
Permitted & conditional uses
Allowed uses · Special-permit conditions · Prohibited uses
Permitted & conditional uses
Allowed · special-permit conditions · prohibited
Building & site characteristics
From public records
Year built
1995
Heating
FORCED AIR
Cooling
Yes
Buildings
1
Lot
2.33 ac
Current owner
From public records · entity-resolved
Help Care Center V Corp
Entity
Free & Clear · 0 yrs held
Mailing address
105 TALLAPOOSA ST STE #307, MONTGOMERY, AL 36104-2549
Ownership since
2025
Owner contacts — direct phone, email, and related entities
Decision-maker phone · Verified email · Related entities & filings
Owner contacts
Email · phone · related entities
Sales History
8 recorded events · public records
Date
Price
Buyer
Seller
Deed Type
Mortgage
Dec 31, 2025
$3,464,000
Help Care Center V Corp
Tg Fuel 2 LLC
Special Warranty Deed
—
Dec 30, 2024
$3,450,000
Tg Fuel 2 LLC
Nla Chipley LLC
Special Warranty Deed
—
Feb 18, 2021
$2,208,000
Nla Chipley LLC
Clark East Tower Ltd Dividend Hsng
Special Warranty Deed
$2,537,000 · Bankplus
Jul 27, 2016
—
Clark East Tower Limited Divid
—
Deed
related
$13,600,000 · Miscellaneous Ins Co
May 15, 2007
$1,788,000
Clark East Tower Ltd Dividend Hsng
Cpcg Gold I LLC
Special Warranty Deed
$14,650,000 · Midfirst Bank
Aug 25, 2006
$1,608,000
Cpcg Gold I LLC
Applefield Seven Family
Grant Deed
related
$19,887,599 · Wfb NA
—
—
Clark East Tower Limited Divid
—
Deed Of Trust
related
$13,600,000 · Miscellaneous Ins Co
—
—
Applefield Seven Family
—
Deed Of Trust
related
$562,801 · Wachovia Bk/sc
Coming soon
Costs & Benchmarks
Operating expenses, capex projections, utility benchmarks, and submarket comparables — all in one view.
Coming soon
Risks
Flood, climate, environmental, title, and tenant-concentration risk — surfaced with mitigations and source citations.
Try Rey
Ask anything about this address in plain English.
“Is 15.6% cap rate sustainable?” · “Best tenant mix for BU1?” · “What’s the redev upside?”
Full reports are paid
Unlock the full Property Analytics report
Start free for 7 days — no card required. Full owner contacts, all 4 valuations with methodology, refine flow, comparable adjustments, foot-traffic deep dive, export to PDF / CSV.


